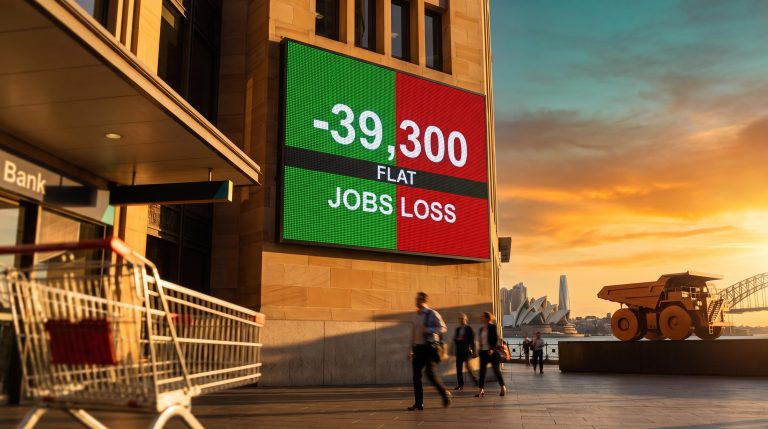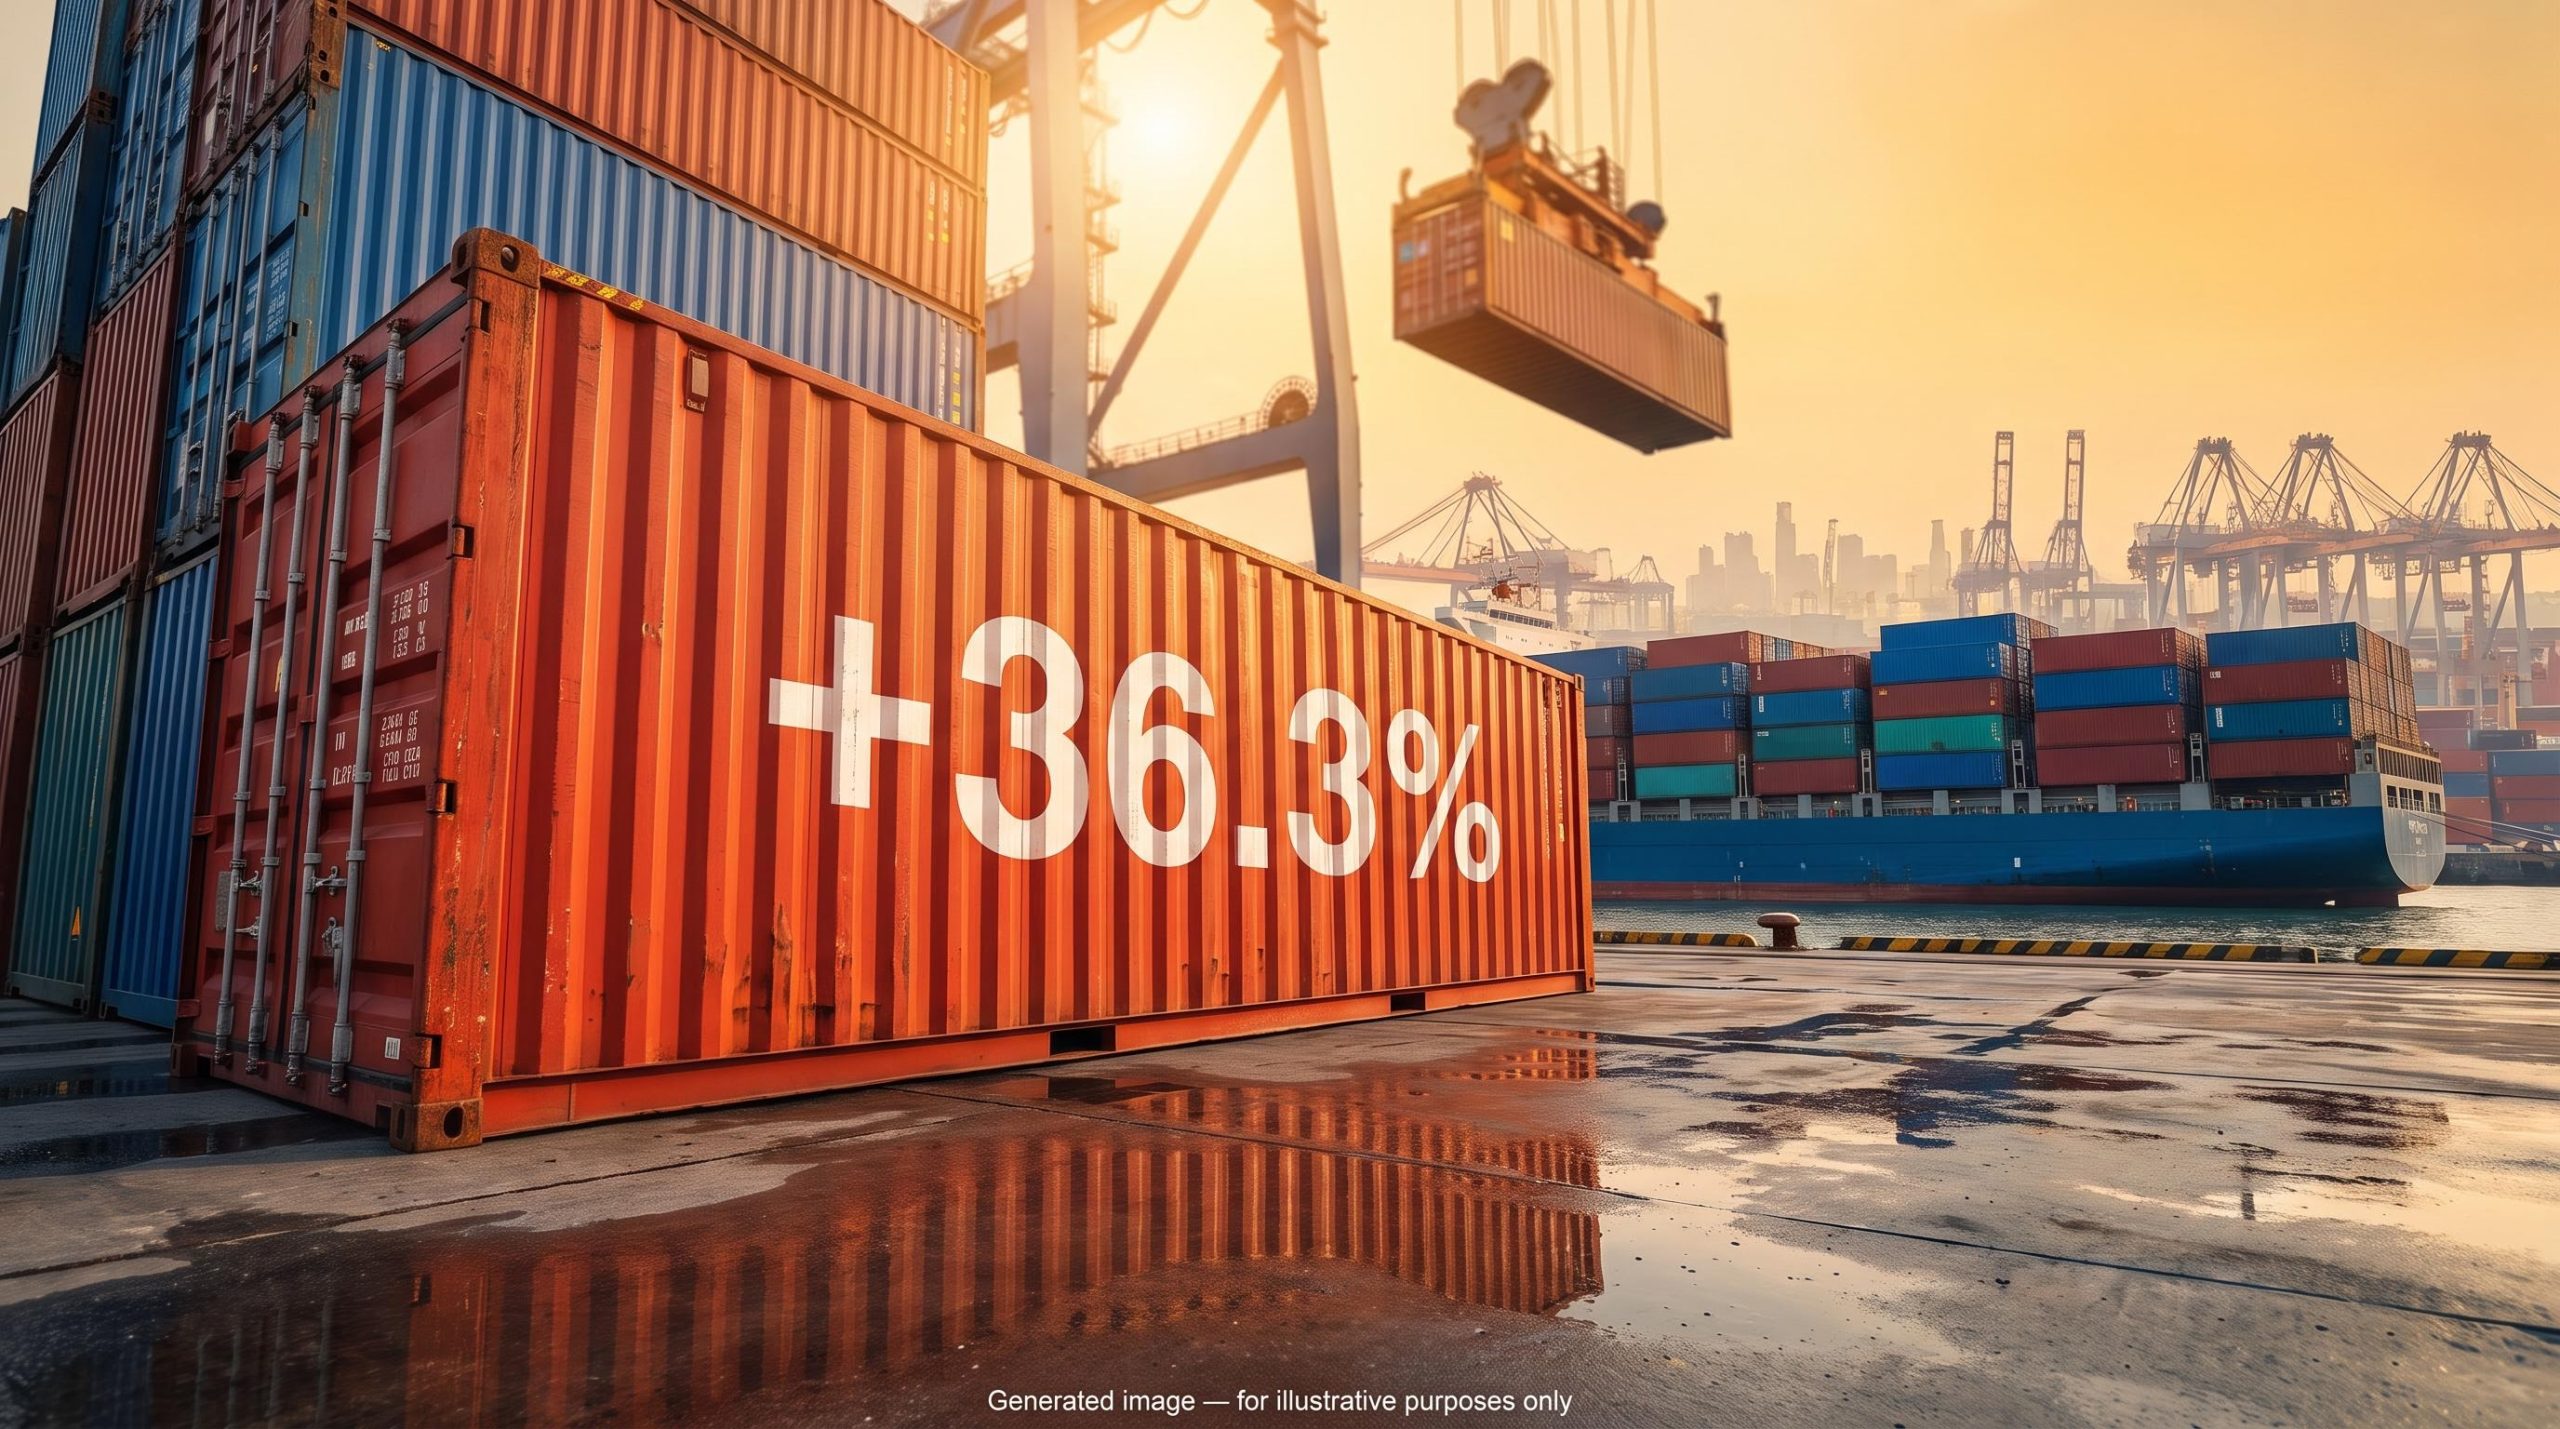
China’s exports grew 36.3% in September, far ahead of the roughly 25.5% economists expected. The surge pushed the country’s monthly trade surplus to US$133.53 billion, its widest in 20 months, and the figures landed on Wednesday, one day before European Union leaders sat down in Brussels.
The same release had more in it. Producer prices rose at their fastest pace since 2022, and new credit leaned heavily on government bond issuance rather than household borrowing.
Taken together, the numbers show a Chinese economy growing through factories and foreign buyers, while consumers at home stay cautious. That timing gives the data political weight in Europe.
Here is what the combined readings tell you about where Chinese growth is coming from, why Brussels is under pressure to respond, and which sectors sit closest to the fallout.
Why the EU summit is where this surplus bites hardest
The European Council meets on 15-16 October 2026 with a bilateral gap that has just widened again. China’s goods surplus with the EU reached about US$34.8 billion in September. Exports to the bloc rose 25.3%, while imports from Europe barely moved.
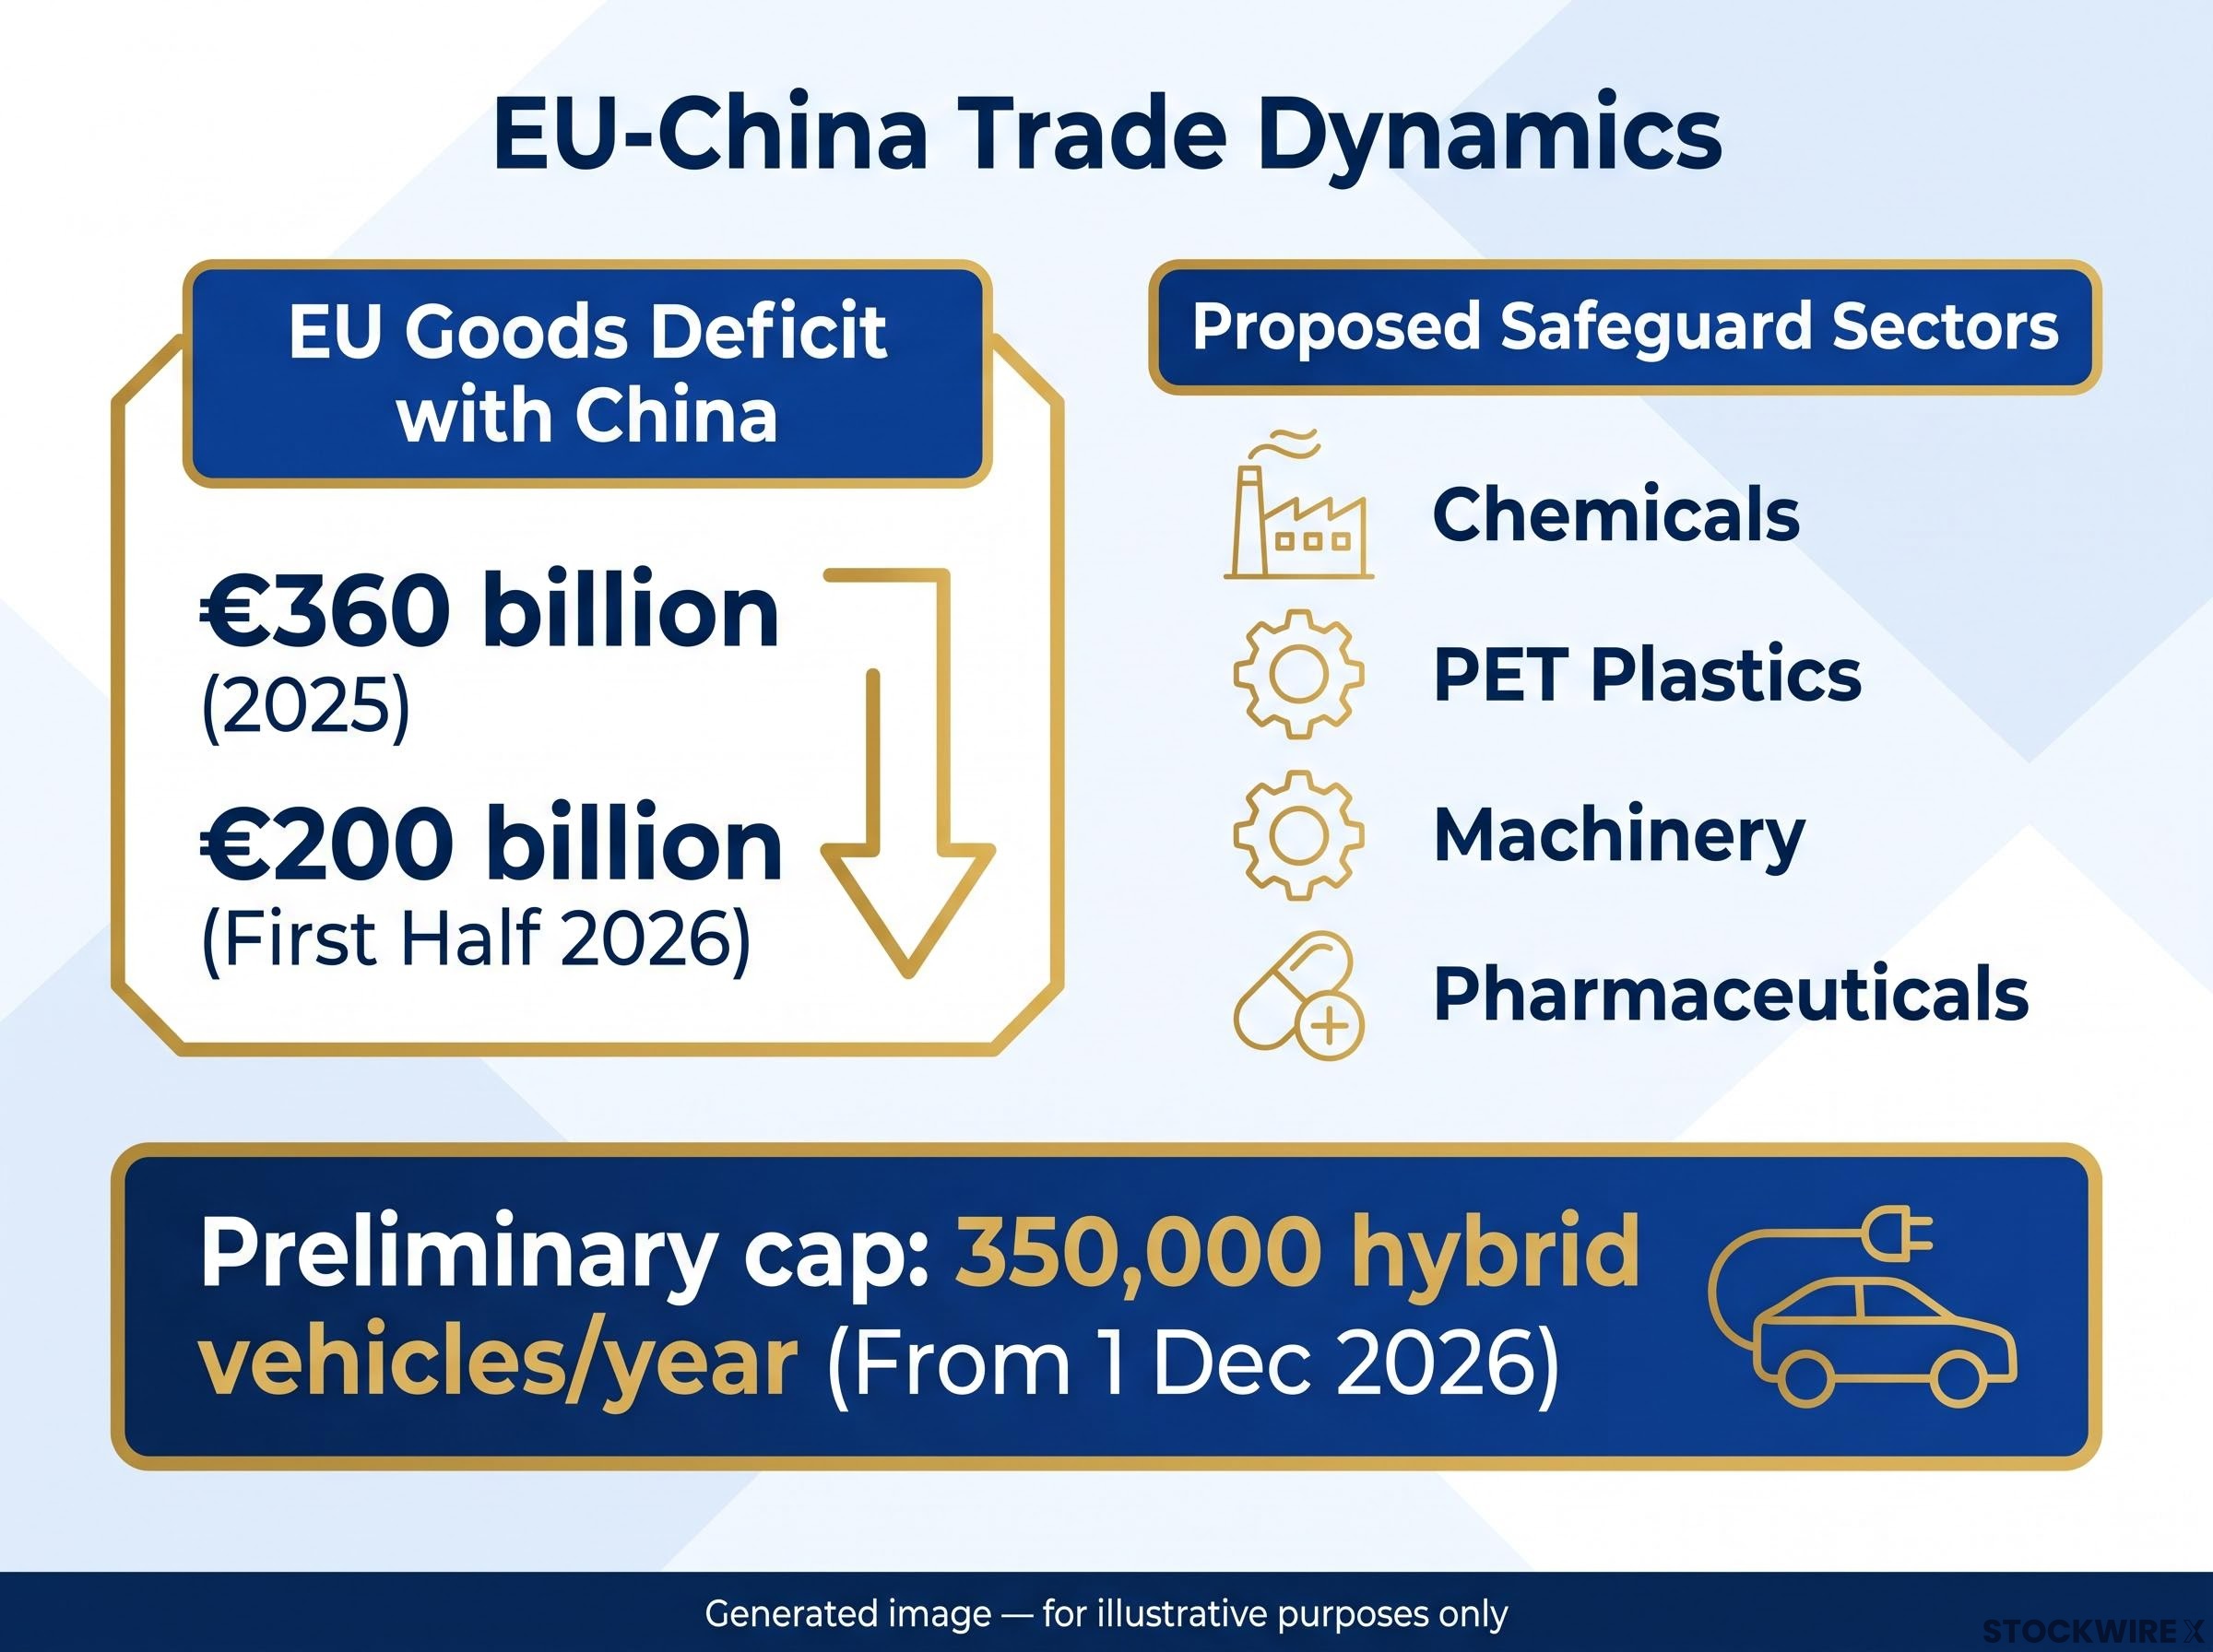
The EU’s goods deficit with China About €360 billion in 2025 and about €200 billion in the first half of 2026 (Reuters).
The US picture is similar. Wind Information data cited by CNBC put the US surplus at about US$34.01 billion, a 20-month high, while Commerzbank‘s Dr Henry Hao described the surpluses with both the US and the EU as records. The sources differ on that point.
Where Brussels and Beijing each stand
The weekend before the release, the two sides reached a preliminary arrangement capping Chinese hybrid and plug-in hybrid imports at 350,000 vehicles a year, reportedly from 1 December 2026. Chinese-brand cars assembled inside the EU are exempt. Beijing accepted the deal, but overcapacity and market access remain unresolved.
Brussels treats the cap as a first step. Draft summit conclusions call for continued talks with Beijing alongside fuller use of EU trade-defence tools, and Germany and France are pushing for safeguards in more sectors:
- Chemicals: flagged by both Berlin and Paris as exposed to low-priced Chinese supply
- PET plastics: highlighted in the Franco-German position, alongside a call for faster retaliation
- Machinery and possibly pharmaceuticals: proposed by Germany as candidates for safeguard quotas
The precedent is recent. The EU’s 2024 tariffs on Chinese electric vehicles and steel safeguards on both sides of the Atlantic show how visible import surges move from investigations to quotas, often pushing shipments into neighbouring markets.
What could go wrong with wider quotas
Wider measures carry real costs. China could retaliate, and any quota must still prove import surges and injury to EU producers. No authoritative legal ruling on the hybrid cap has been found.
Retaliation risk is already visible: China’s anti-dumping probe into European p-nitrotoluene, opened on 3 October, shows how a narrow chemical case can signal wider escalation before any new EU quotas are agreed.
Member states are also split. Germany and France want tougher tools, while other governments benefit from cheap Chinese vehicles, batteries and inputs.
For you, a record bilateral gap tied to named industries means trade defences are more likely to widen than fade. That matters if you hold European chemicals, machinery or auto exposure, or Chinese exporters selling into Europe.
What is driving the China trade surplus: AI demand, autos and a weak home market
The September beat was broad, not a single-line surprise.
| Indicator | September 2026 | Consensus | August | Change |
|---|---|---|---|---|
| Exports | US$447.18B | +25.5% | +25.0% | +36.3% y/y |
| Imports | US$313.66B | +24.5% | +28.2% | +31.0% y/y |
| Monthly surplus | US$133.53B | n/a | US$119.1B | 20-month high |
The year-to-date surplus now stands at US$938.1 billion, against about US$1.2 trillion for all of 2025. Three forces did the lifting:
- AI infrastructure demand: semiconductor exports rose more than 108% and data-processing equipment 54.6%
- Autos: vehicle exports rose 54.3%
- Front-loading: shipments to Europe moved early ahead of possible restrictions
Those product figures have not been independently confirmed, and reports use differing measurement bases.
HSBC’s Taylor Wang sees both cyclical and structural drivers. ING’s Lynn Song argues the strength helps China reach its 4.5%-5% growth target, which leaves that growth unusually export-dependent. Hao Zhou of Guotai Junan International points to an imbalance between industrial capacity and household demand.
Analysts at Citi and Bloomberg Economics now treat the K-shaped split between booming technology exports and a weak property-linked consumer as structural, which helps explain why Hao Zhou frames the imbalance as capacity outrunning household demand.
Max Zenglein of The Conference Board offers the sharpest caution. He warns a slowdown in global AI investment could hurt Chinese exports more than any trade barrier. The strong import rise shows domestic demand is not absent, but the export channel still dominates.
A surplus built on AI-linked demand rather than price undercutting alone tells you the exposure runs through the global tech spending cycle, not just tariffs. Watch AI capital expenditure and auto shipments to judge whether this pace can last.
Hot factory prices, patchy credit: reading the signals together
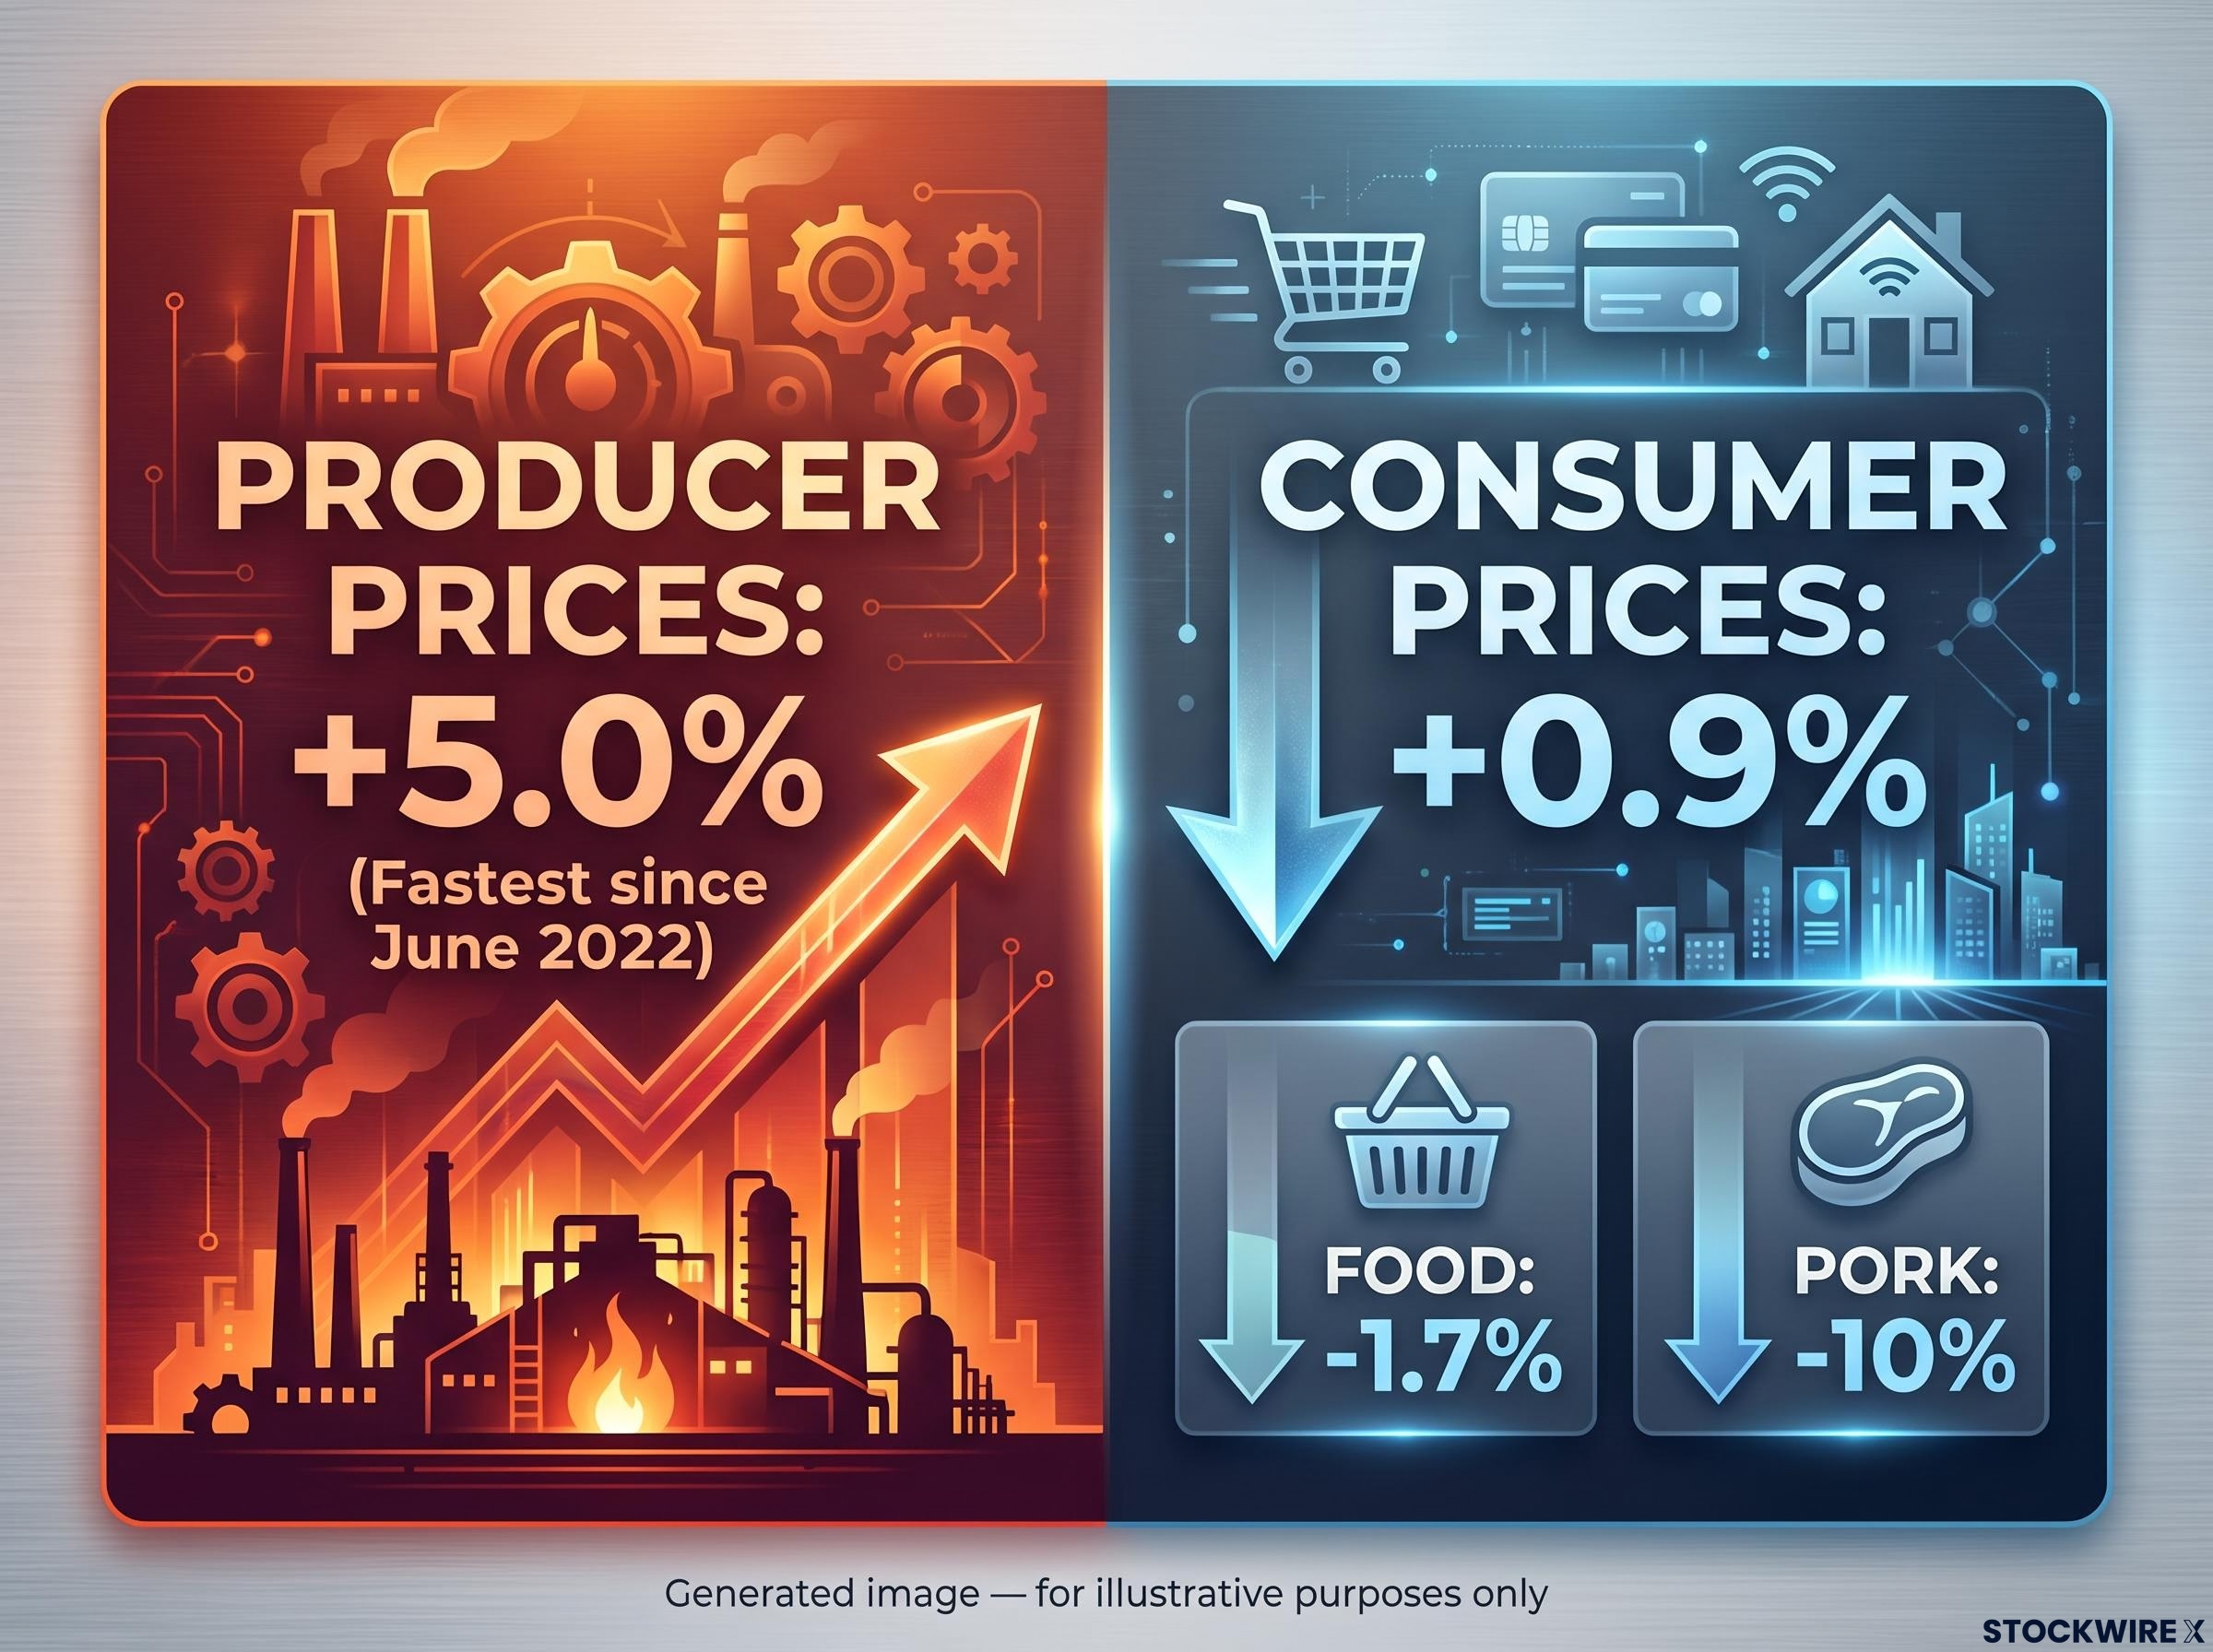
On the surface, prices looked like a recovery. The producer price index, which tracks what factories charge for goods, rose 5.0% year on year and 1.2% month on month, above the 4.4% consensus and the fastest since June 2022.
Consumers saw little of it. Consumer prices rose 0.9%, short of the 1.0% forecast, with core inflation at 1.0%. Food fell 1.7% and pork about 10%.
The gap that matters Producer prices up 5.0%; consumer prices up just 0.9%.
Credit told a similar story. Aggregate social financing, the broadest measure of new lending in the economy, reached CNY3.55 trillion against about CNY3.27 trillion expected. Roughly CNY1.5 trillion came from government bonds, while household loans were flat.
New yuan loans were CNY1.08 trillion on PBOC-based figures, though Commerzbank reported CNY1.3 trillion. Outstanding financing growth slowed to 7.1% from 7.2%.
Three ways to read the same data
Hao Zhou sees gradual, uneven reflation. Reuters frames it as cost-push, with oil prices tied to Middle East tensions and AI-related technology costs squeezing manufacturers. Caixin reads an uneven recovery, with industrial prices running ahead of incomes and housing demand.
With producer prices outrunning consumer prices, firms are absorbing upstream costs in a margin squeeze, and industrial profit growth had already slowed from 18.7% in the first half to 11.2% in July.
A simple check helps you test any China release:
- Check what is driving prices: commodities and costs, or demand.
- Check who is borrowing: the state, or households and firms.
- Check whether imports confirm genuine domestic demand.
What it means for policy and markets
Rising producer inflation makes aggressive easing harder, so the likely bias is targeted fiscal and credit support. Capital Economics expects factory-gate prices to slip back into deflation and 2027 consumer inflation to average just 0.4%.
For you, the price pickup looks like upstream cost pressure rather than proof of healthy demand. That reading supports industrial and commodity-linked names more than consumer and property exposure.
Past performance does not guarantee future results. Forecasts cited are subject to market conditions and may change.
What the data changes, and what it leaves unresolved
The surplus, prices and credit point the same way: an external-led recovery propped up by government borrowing, which Europe looks unlikely to absorb quietly.
Three markers will show which way this breaks:
- The summit’s final wording on trade-defence tools
- Any move to extend quotas beyond hybrids into chemicals or machinery
- The next export and producer price readings, set against any cooling in AI spending
If you hold European industrials or Chinese exporters, those signals will tell you whether the policy risk is building or stalling.
This article is for informational purposes only and should not be considered financial advice. Investors should conduct their own research and consult with financial professionals before making investment decisions.