
Midterm Octobers have a reputation that makes bullish positioning feel like the obvious call. Since 1950, the S&P 500 has gained an average of 3.0% in the October of a midterm election year, but the first two weeks are where traders tend to get hurt. This year, those weeks arrive with 5-year Treasury yields near 5%, WTI crude near $90 and the US Dollar Index (DXY) above 102.
The S&P 500 closed near 7,819 on 6 October 2026, on thin volume and weak breadth. Breadth measures how many stocks are participating in a move, and when it is low, a small group of names is doing the lifting.
The midterms are less than a month away. Monthly options expiration lands on 16 October. Whether the month ends higher matters less to your results than when you enter and how you structure the trade.
After this, you will have a framework for weighing the seasonal edge against the current macro pressure, and a clear view on which options structures suit the window around expiration week.
What does a century of midterm-cycle data say about early and mid-October?
The headline numbers are favourable. According to the Stock Trader’s Almanac, edited by Jeffrey Hirsch, midterm Octobers since 1950 have averaged gains of 3.2% for the Dow, 3.0% for the S&P 500 and 3.2% for the Nasdaq.
Midterm October, S&P 500 average since 1950: +3.0% October ranks as the best month of the midterm year and opens the four-year cycle “sweet spot.”
| Index | Average midterm October gain since 1950 | Current level (6 October 2026 close) |
|---|---|---|
| Dow Jones Industrial Average | +3.2% | 51,521 |
| S&P 500 | +3.0% | 7,819 |
| Nasdaq | +3.2% | Not available |
The shape inside that average is less tidy. Analysis by Anarie Band covering roughly 100 years of midterm-cycle data flags a historically weak window between about 2 October and 12 October. Hirsch’s late-September posts point the same way: his seasonal MACD buy signals (a momentum indicator tracking whether short-term trends are strengthening against longer-term ones) tend to appear in October, after early softness gives way.
So the pattern has two parts. A shaky start, then a supported finish.
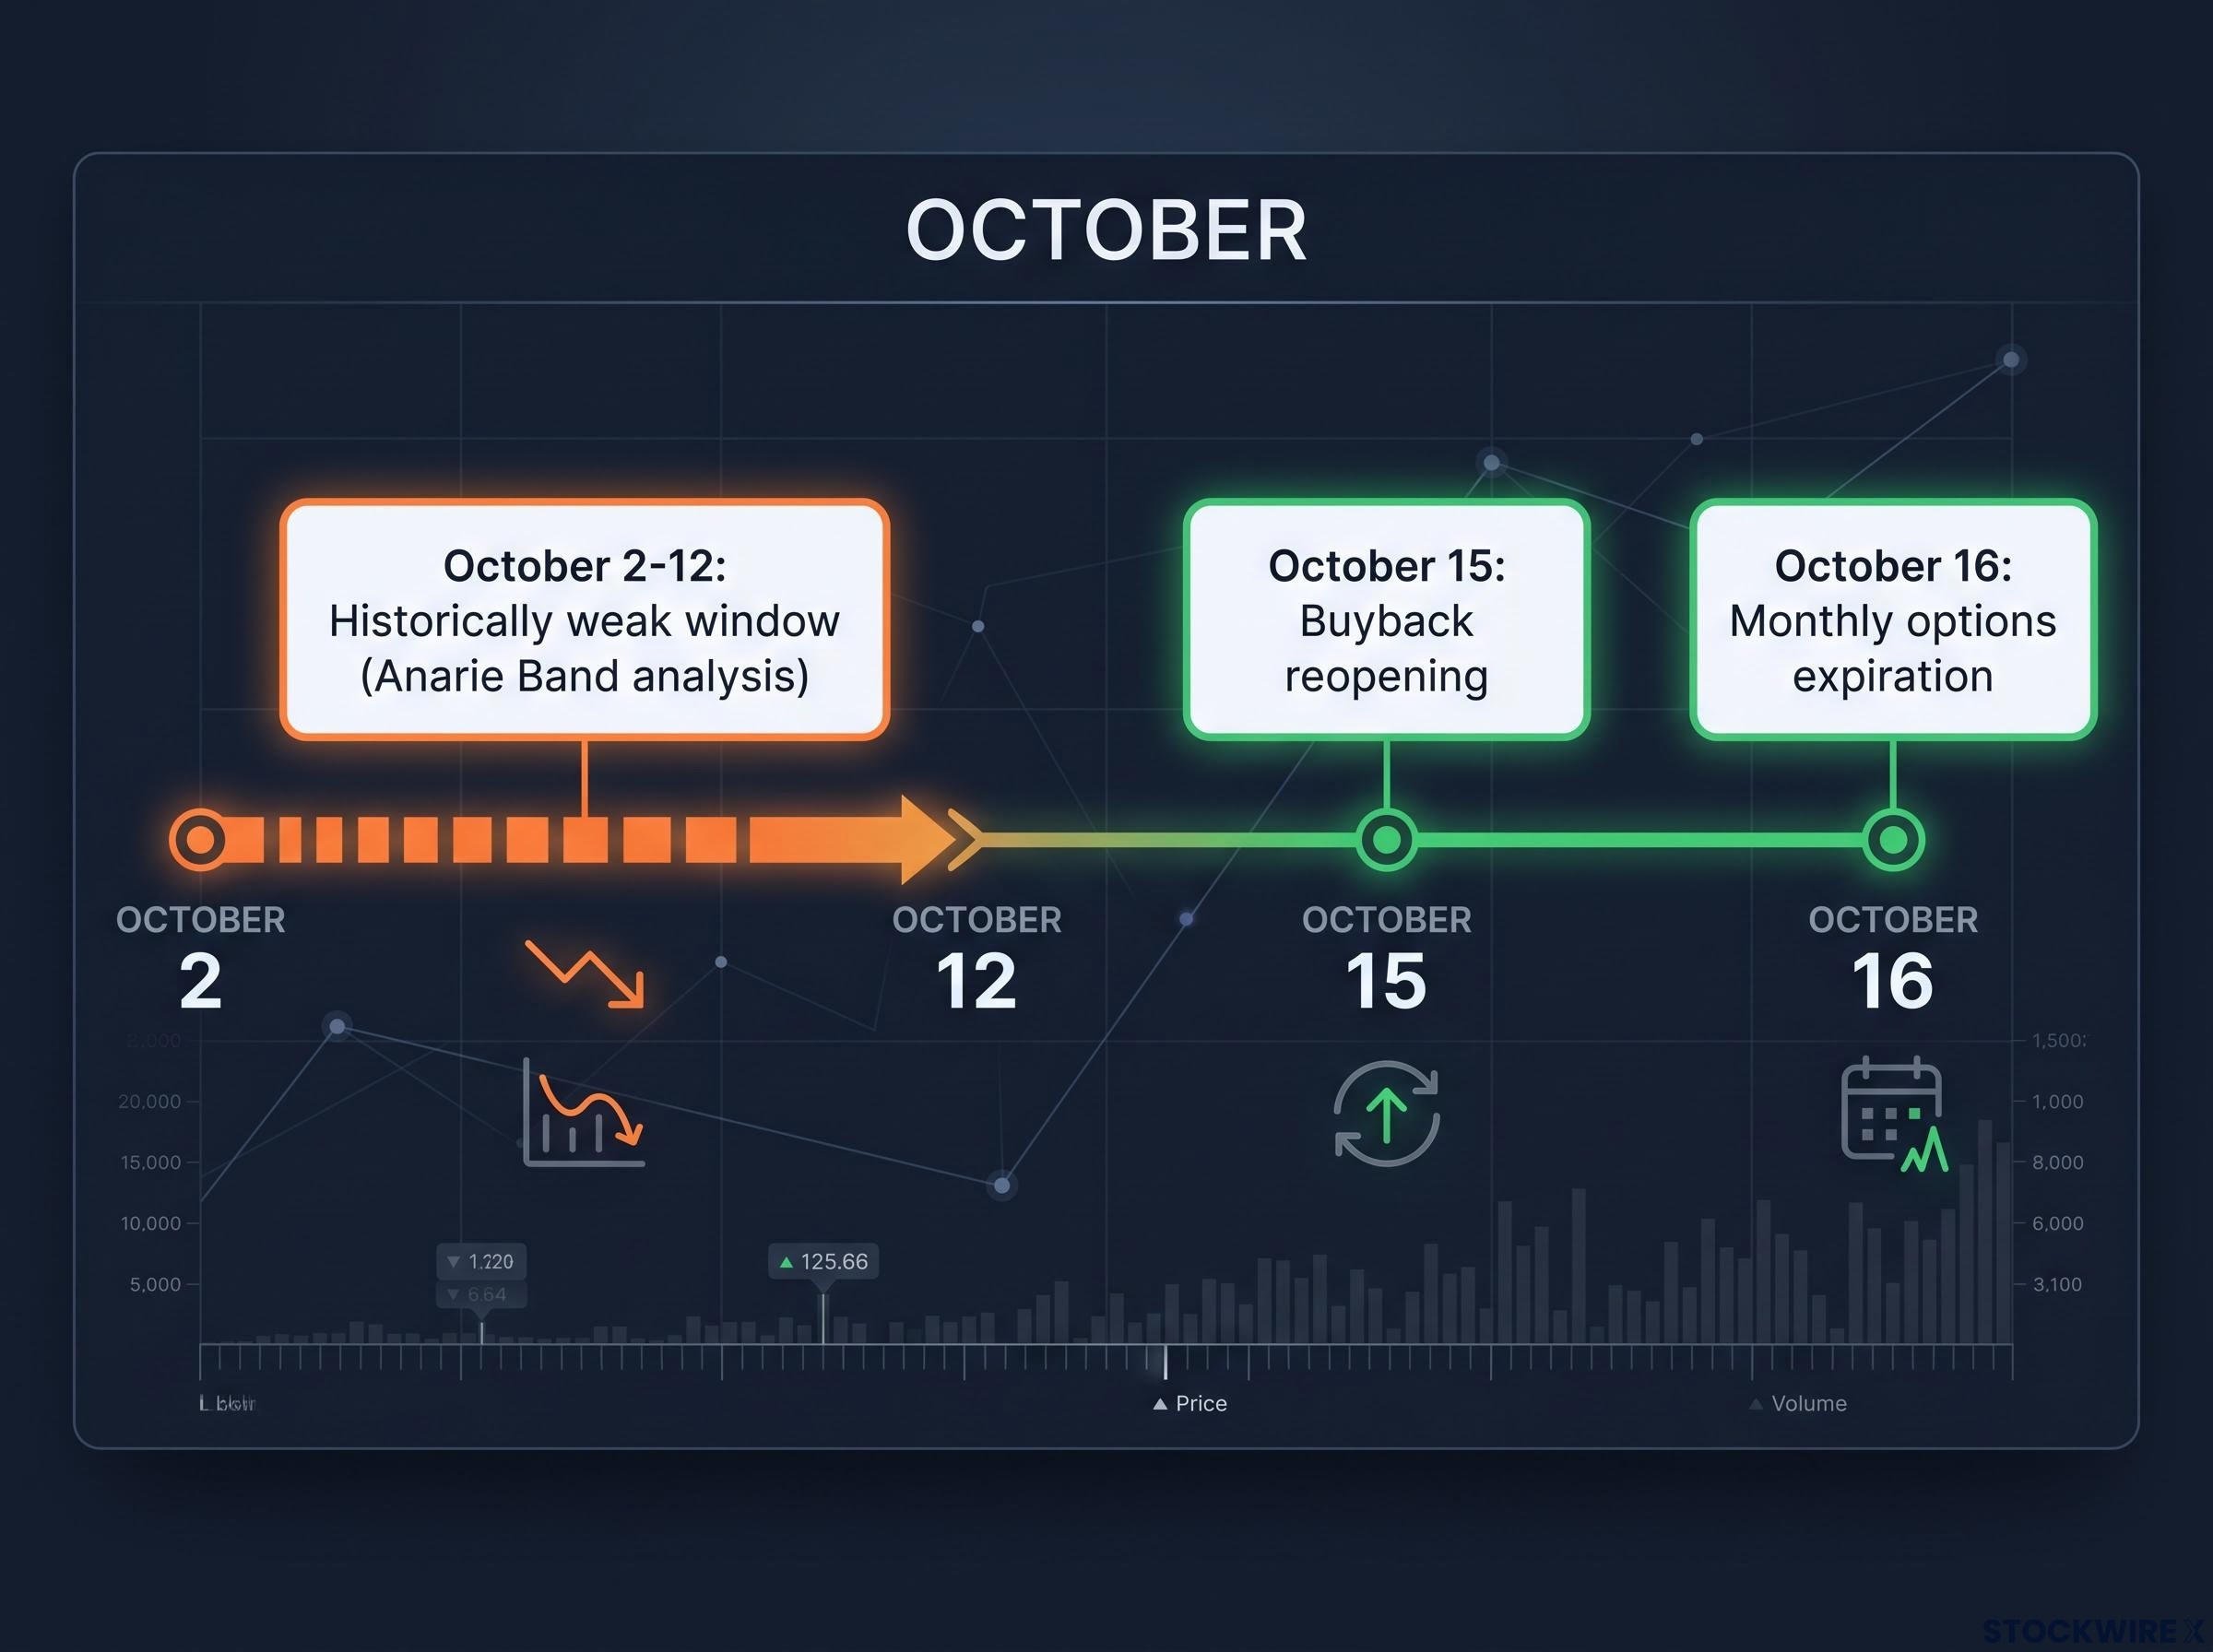
This year has not followed the script so far, with indices climbing steadily into the weak window. That should not reassure you, because the midterm sample is small and individual years scatter widely around the mean. The averages tell you the month leans in your favour, but paying up for bullish exposure between 2 and 12 October has historically been the weaker entry point.
Calendar anomalies carry a built-in problem: once a seasonal pattern is widely known, anticipatory positioning can erode the edge before the window even arrives, which is one reason a bullish October lean deserves modest sizing.
When big ASX news breaks, our subscribers know first
Why do midterm years soften and then rally? The buyback and election mechanics
A calendar cannot move markets by itself. Behaviour tied to that calendar can, and three mechanisms explain most of the midterm pattern:
- Policy uncertainty. LPL Research finds the first three quarters of midterm years tend to underperform as investors wait for clarity on tax, spending and regulation. Carson Group and Ned Davis Research both observe that pre-midterm drawdowns are common, and rallies follow once the result lets markets price gridlock or continuity.
- Buyback cadence. Companies usually stop repurchasing their own shares during blackout periods ahead of earnings. Late Q3 into early Q4 removes a major source of demand, often just as macro headlines turn negative. Band’s analysis puts the reopening at 15 October, the day before expiration, though timing varies with each company’s fiscal calendar.
- The four-year sweet spot. LPL, Carson, Bespoke and Ned Davis point to late midterm year through the pre-election year as one of the strongest stretches for returns.
The buyback date is why mid-October matters for timing. Demand returns just as options positions are being settled.
Yet buyback support is a flow effect, not a promise. It can cushion a decline, but it cannot override a bond selloff.
Where the pattern’s critics push back
Strategy teams at Goldman Sachs, Morgan Stanley and JPMorgan have argued in earlier cycles that the midterm effect is overstated. Their case is that recessions, inflation shocks and Federal Reserve policy drive returns far more than the election calendar.
Ned Davis and Bespoke take a middle position, treating seasonality as conditional. In a bear market or an inflation spike, a favourable October can simply extend a downtrend, which is the scenario worth testing against this year’s conditions.
Oil, yields, the dollar and tech: which macro risks can override the calendar?
Four pressures sit on this market at once, and each reaches equities through a different channel.
The transmission chain linking oil, yields and the dollar tends to run in sequence: crude jumps, inflation expectations shift, Treasury yields rise and the dollar firms, which leaves equities absorbing the pressure through several channels at once.
- Oil. WTI trades just under $90 (about $88.83-$89.05) and Brent near $100. Higher crude raises input costs, squeezes margins outside energy and acts like a tax on consumers. Market data show a backwardated curve, meaning near-term contracts price above later ones (about $89 near-term against roughly $81-$82.50 further out), while Band’s discussion described it as “flat and elevated.” Both readings agree prices are high.
- Yields. The 5-year yield hit 5.06% on 5 October, against a long-term average of 3.77% according to YCharts, with the 10-year near 5.30%. Higher yields raise the rate used to value future earnings and offer a competitive risk-free return.
- The dollar. DXY sits near 102.27 against a long-run average near 99, hurting the Dow through weaker exports and the shrinking value of overseas earnings once converted back.
- Tech expectations. Market leaders face a high bar. Band flagged the hype around Muse as overdone, citing reported errors during live use, and sees it as a pullback candidate.
| Factor | Current reading | Long-run reference | Equity impact |
|---|---|---|---|
| WTI crude | ~$89 | Far contracts ~$81-$82.50 | Margin squeeze, consumer drag |
| 5-year Treasury | 5.06% | 3.77% | Valuation compression |
| 10-year Treasury | ~5.30% | Not available | Pressure on long-duration growth |
| DXY | ~102.27 | ~99 | Weaker exports, FX translation losses |
Stacked together, these conditions are exactly what makes a plain bullish seasonal trade fragile. With yields above 5% paying you to wait, treat high-valuation tech as the part of your portfolio most exposed if the bounce fails.
Higher for longer: structural or cyclical?
The structural reading blames persistent deficits, reshoring, energy-transition spending and geopolitical fragmentation, all of which keep rates elevated. The cyclical reading ties today’s yields to the 2021-2023 inflation shock and expects eventual Fed normalisation.
Strategists are split, and even the cyclical case may not play out inside a single October. Any yield relief, though, would be a genuine upside catalyst.
What happened when macro beat seasonality in 2018, and when it did not in 2022?
Two recent midterm Octobers ran on the same calendar and delivered opposite outcomes.
In October 2018, the S&P 500 fell roughly 7%. The 10-year yield had moved above 3%, the Fed was tightening and US-China trade tensions were building. Tech led the decline, and short-put and short-volatility trades were hit hard as realised swings spiked.
In October 2022, the S&P 500 rebounded roughly 8% after a deep drawdown, despite high inflation and continuing rate hikes. Oil had eased from its post-Ukraine spikes, and markets had begun pricing peak hawkishness.
| Year | S&P 500 October move | Rate backdrop | Oil backdrop | Outcome for short-vol |
|---|---|---|---|---|
| 2018 | ~-7% | 10-year above 3%, Fed tightening | Not a primary driver | Punished by volatility spike |
| 2022 | ~+8% | Peak hawkishness priced | Easing from post-Ukraine spikes | Not available |
| 2026 (current readings) | Month in progress | 10-year near 5.30%, not yet easing | WTI near $90, not yet easing | Outcome not yet known |
The difference was not the calendar. It was whether the macro pressure had started to release.
That gives you the precise question for 2026: are yields or oil turning lower yet? Right now there is no evidence they are, so lean on the 2018 playbook for risk sizing even if you are hoping for a 2022 outcome.
How should options traders structure positions around expiration week?
The tempting trade is a naked short put: collect premium, bet the dip gets bought. It works until a liquidity air pocket hits, and thin volume with weak breadth makes those pockets more likely. Short-volatility positions can be punished in that scenario even if the month finishes higher.
Expiration week adds its own mechanics. Cboe and Schwab material describes pinning, where prices drift towards strikes with large open interest, and gamma effects, where dealer hedging speeds up or dampens moves as options near expiry. Cboe advises sizing short-dated premium selling conservatively when macro risk is elevated.
| Structure | Risk profile | Best suited for | Main drawback | Fit for Oct 2026 |
|---|---|---|---|---|
| Naked short put | Undefined downside | Experienced traders with strict rules | Large losses in a volatility spike | Weak |
| Put spread | Defined risk | Bullish view with capped loss | Capped premium | Strong |
| Collar | Defined on existing shares | Protecting held positions | Limits upside | Strong |
| Diagonal or calendar | Defined risk | Timing a later rally | More complex to manage | Good |
OptionsPlay and Schwab favour vertical spreads, collars and calendars when implied volatility (the market’s expected size of future price swings) is elevated. tastylive accepts short puts and strangles only with firm rules for managing losers, rolling or converting to defined risk. Band’s view is that a bullish trade now may wobble into expiration week, with upside building afterwards; one host watching the DIA Dow ETF would sell puts only if volatility rises.
Seasonality is a backdrop, not a guarantee. The edge is modest relative to the tail risk when rates and energy are both high.
A timing sequence follows from this:
- Before 12 October: keep size small, favour defined-risk entries during the soft window.
- Expiration week (12-16 October): watch pinning near big strikes and the 15 October buyback reopening.
- After 16 October: add exposure if breadth and volume confirm.
Size every position so a mid-October wobble is survivable rather than a forced exit. Past performance does not guarantee future results, and these scenarios are speculative.
For traders wanting to apply defined-risk structures, our dedicated guide to butterfly and calendar spreads shows worked examples of entry costs and capped losses.
Weighing the seasonal edge against the macro bill
The calendar still leans your way. Midterm Octobers carry a favourable average, and buyback demand may return from 15 October. But oil, yields and a firm dollar make this year’s path rougher than any average suggests.
The post-midterm rally record is stronger than the October average alone suggests, with the S&P 500 positive in the 12 months after every midterm since 1950, though a high starting base this year complicates the comparison.
Three variables will tell you which precedent 2026 is following:
- Yield direction on the 5-year and 10-year Treasuries
- Oil and DXY moves, especially any easing
- Volume and breadth confirming a rally rather than a narrow drift
The stance that fits the evidence is simple. Express bullish views with defined risk, and treat 2018 as the stress test your positions must survive.
This article is for informational purposes only and should not be considered financial advice. Investors should conduct their own research and consult with financial professionals before making investment decisions.