A single conversation in New York moved five asset classes at once. No shots were fired. No barrels left the market. The United States simply walked away from nuclear talks with Iran on the sidelines of UN meetings, and within hours crude oil, gold, the dollar, bond expectations, and equity index futures were all moving, several of them in opposite directions.
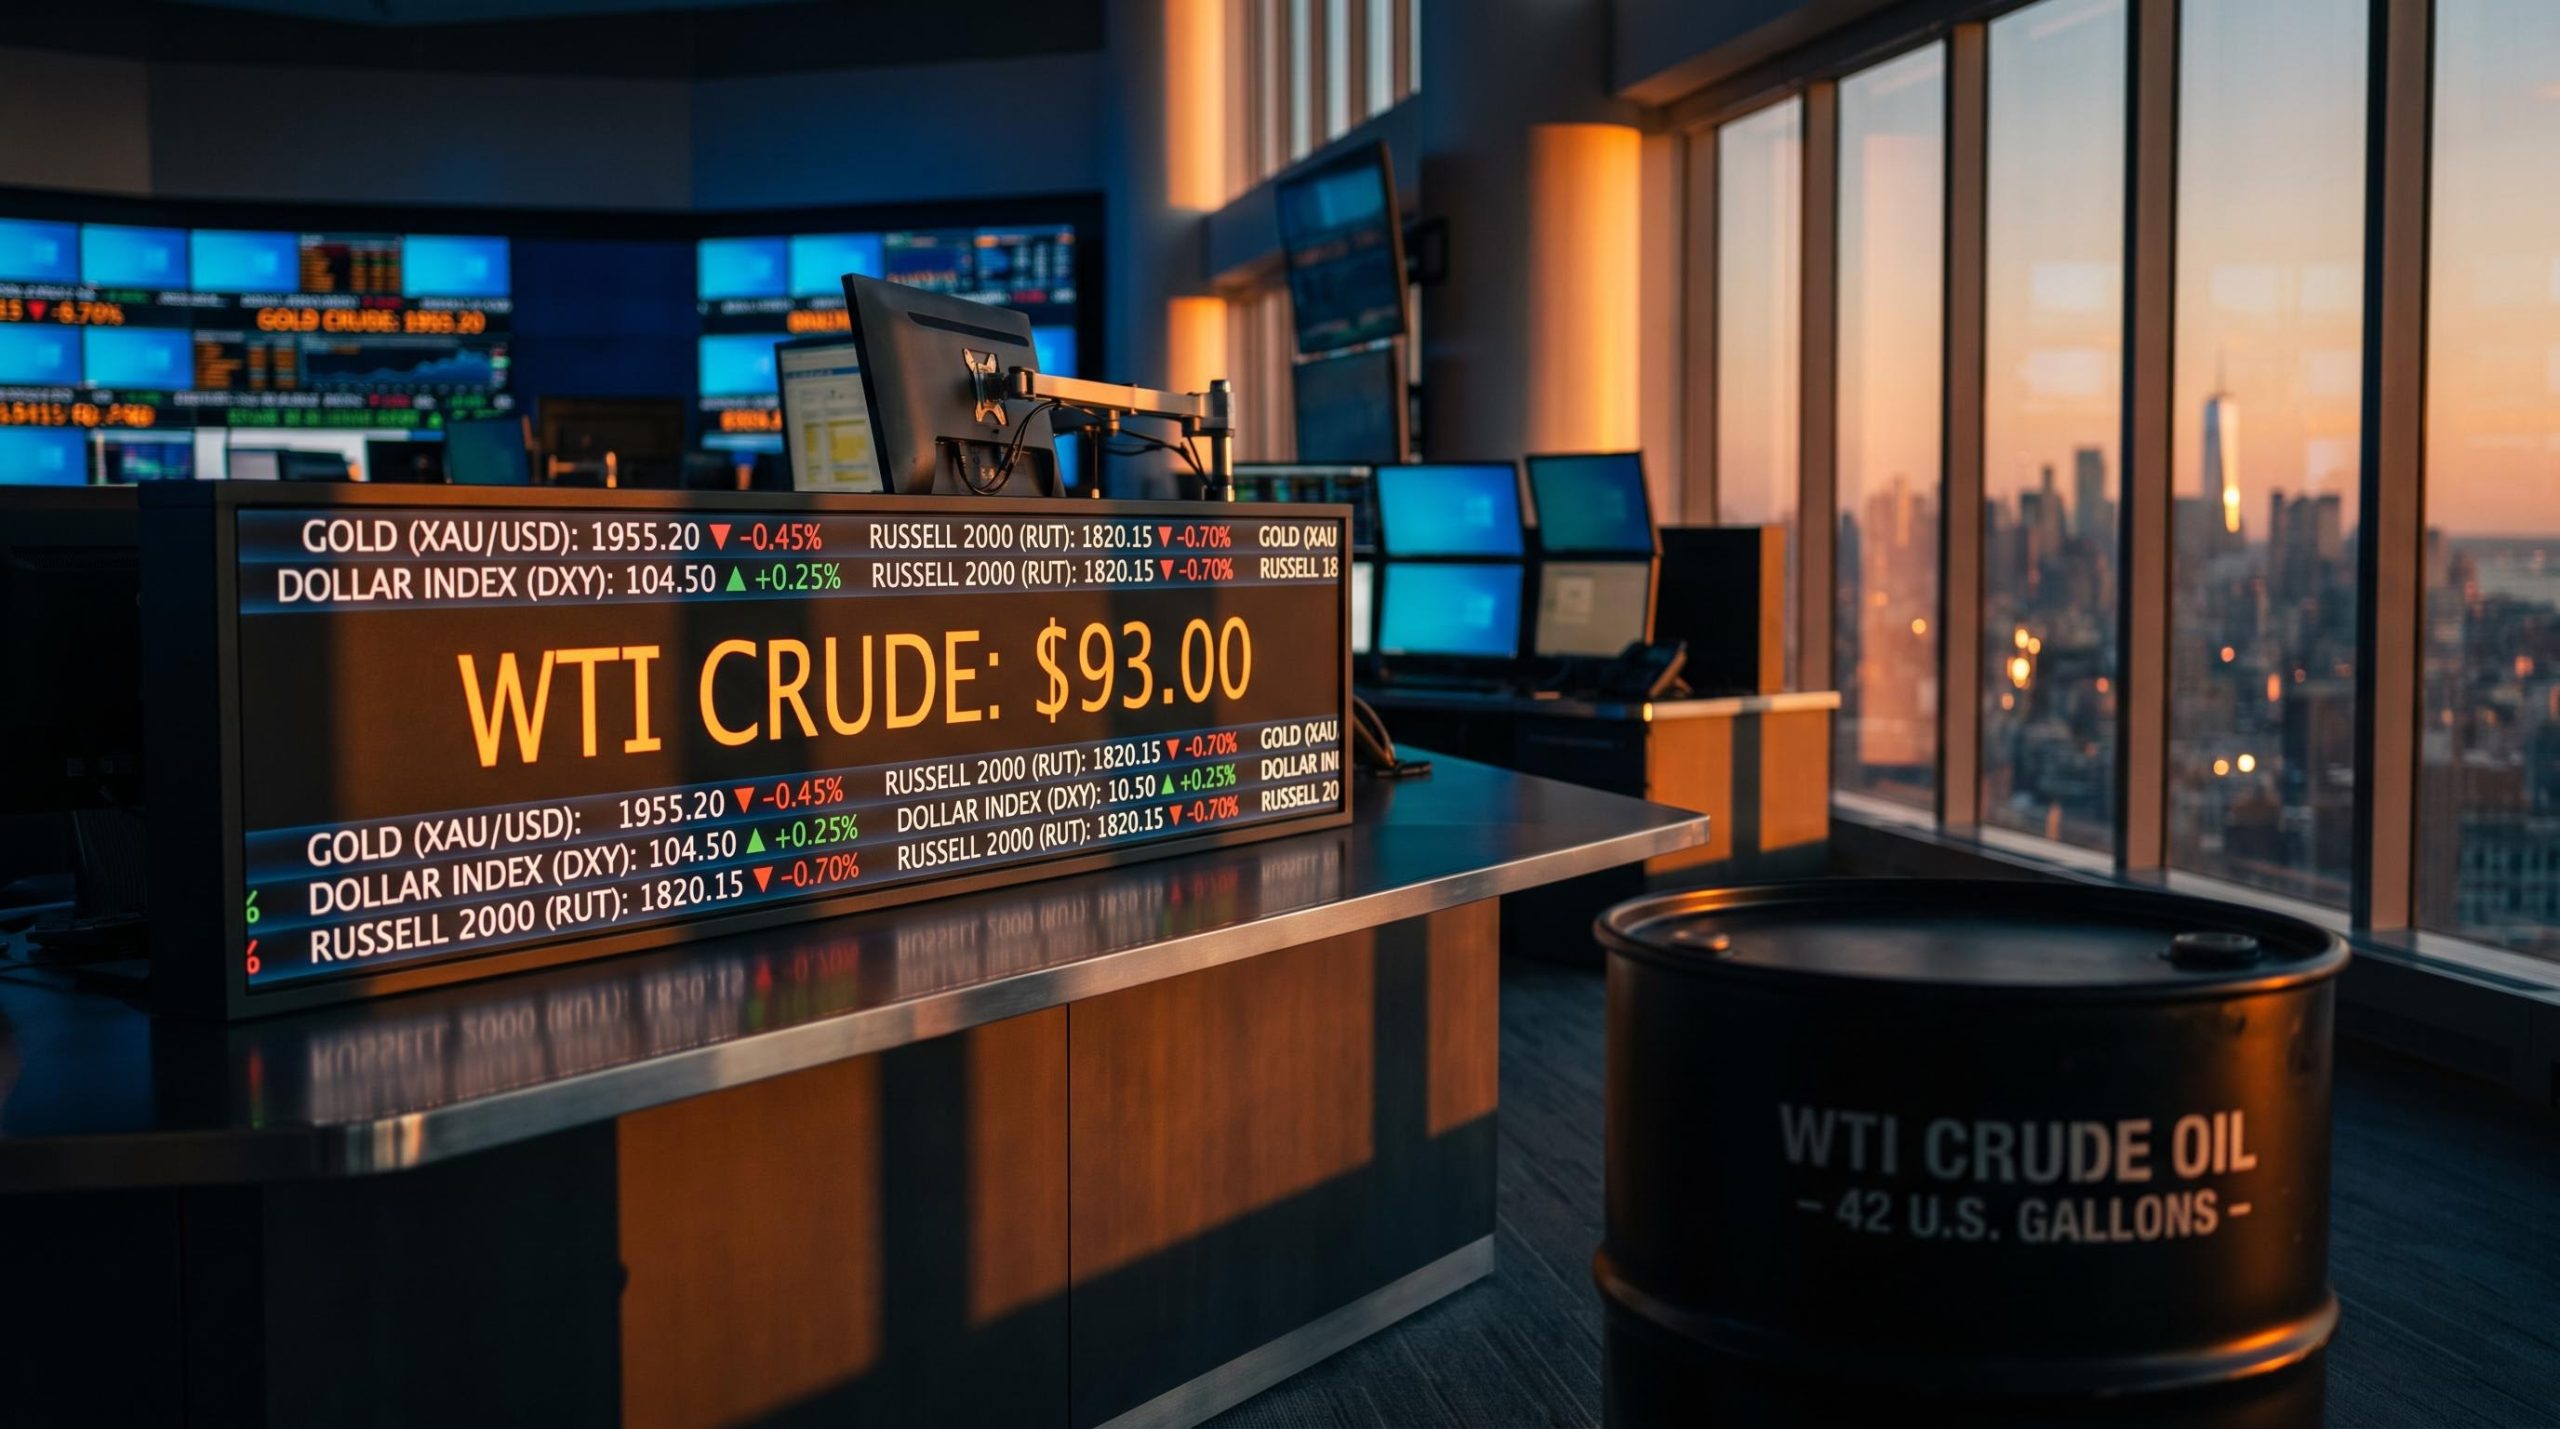
That single ripple is the entire point of macro thinking. Most portfolios are built as if oil, gold, bonds, and shares live in separate rooms with the doors shut. A geopolitical supply scare like the late-September 2026 US-Iran breakdown, with West Texas Intermediate (WTI) crude climbing toward $93 per barrel, exposes the wiring that actually connects those rooms.
A macro investing strategy is simply the discipline of reading that wiring in advance. This explainer gives you a working model for how a single geopolitical catalyst propagates through oil, the dollar, inflation expectations, bond yields, and equities in a sequence you can learn to anticipate. By the time you finish, you will be able to read the next shock the way a macro investor does: as a signal moving through a system, not an isolated headline.
What a diplomatic breakdown does to crude oil prices
Start with the event itself. Iran reportedly demanded full sanctions relief, Washington declined, and the talks collapsed. A near-identical failure had occurred roughly one to two weeks earlier at an Oman-brokered meeting where Iran was again seen as overreaching.
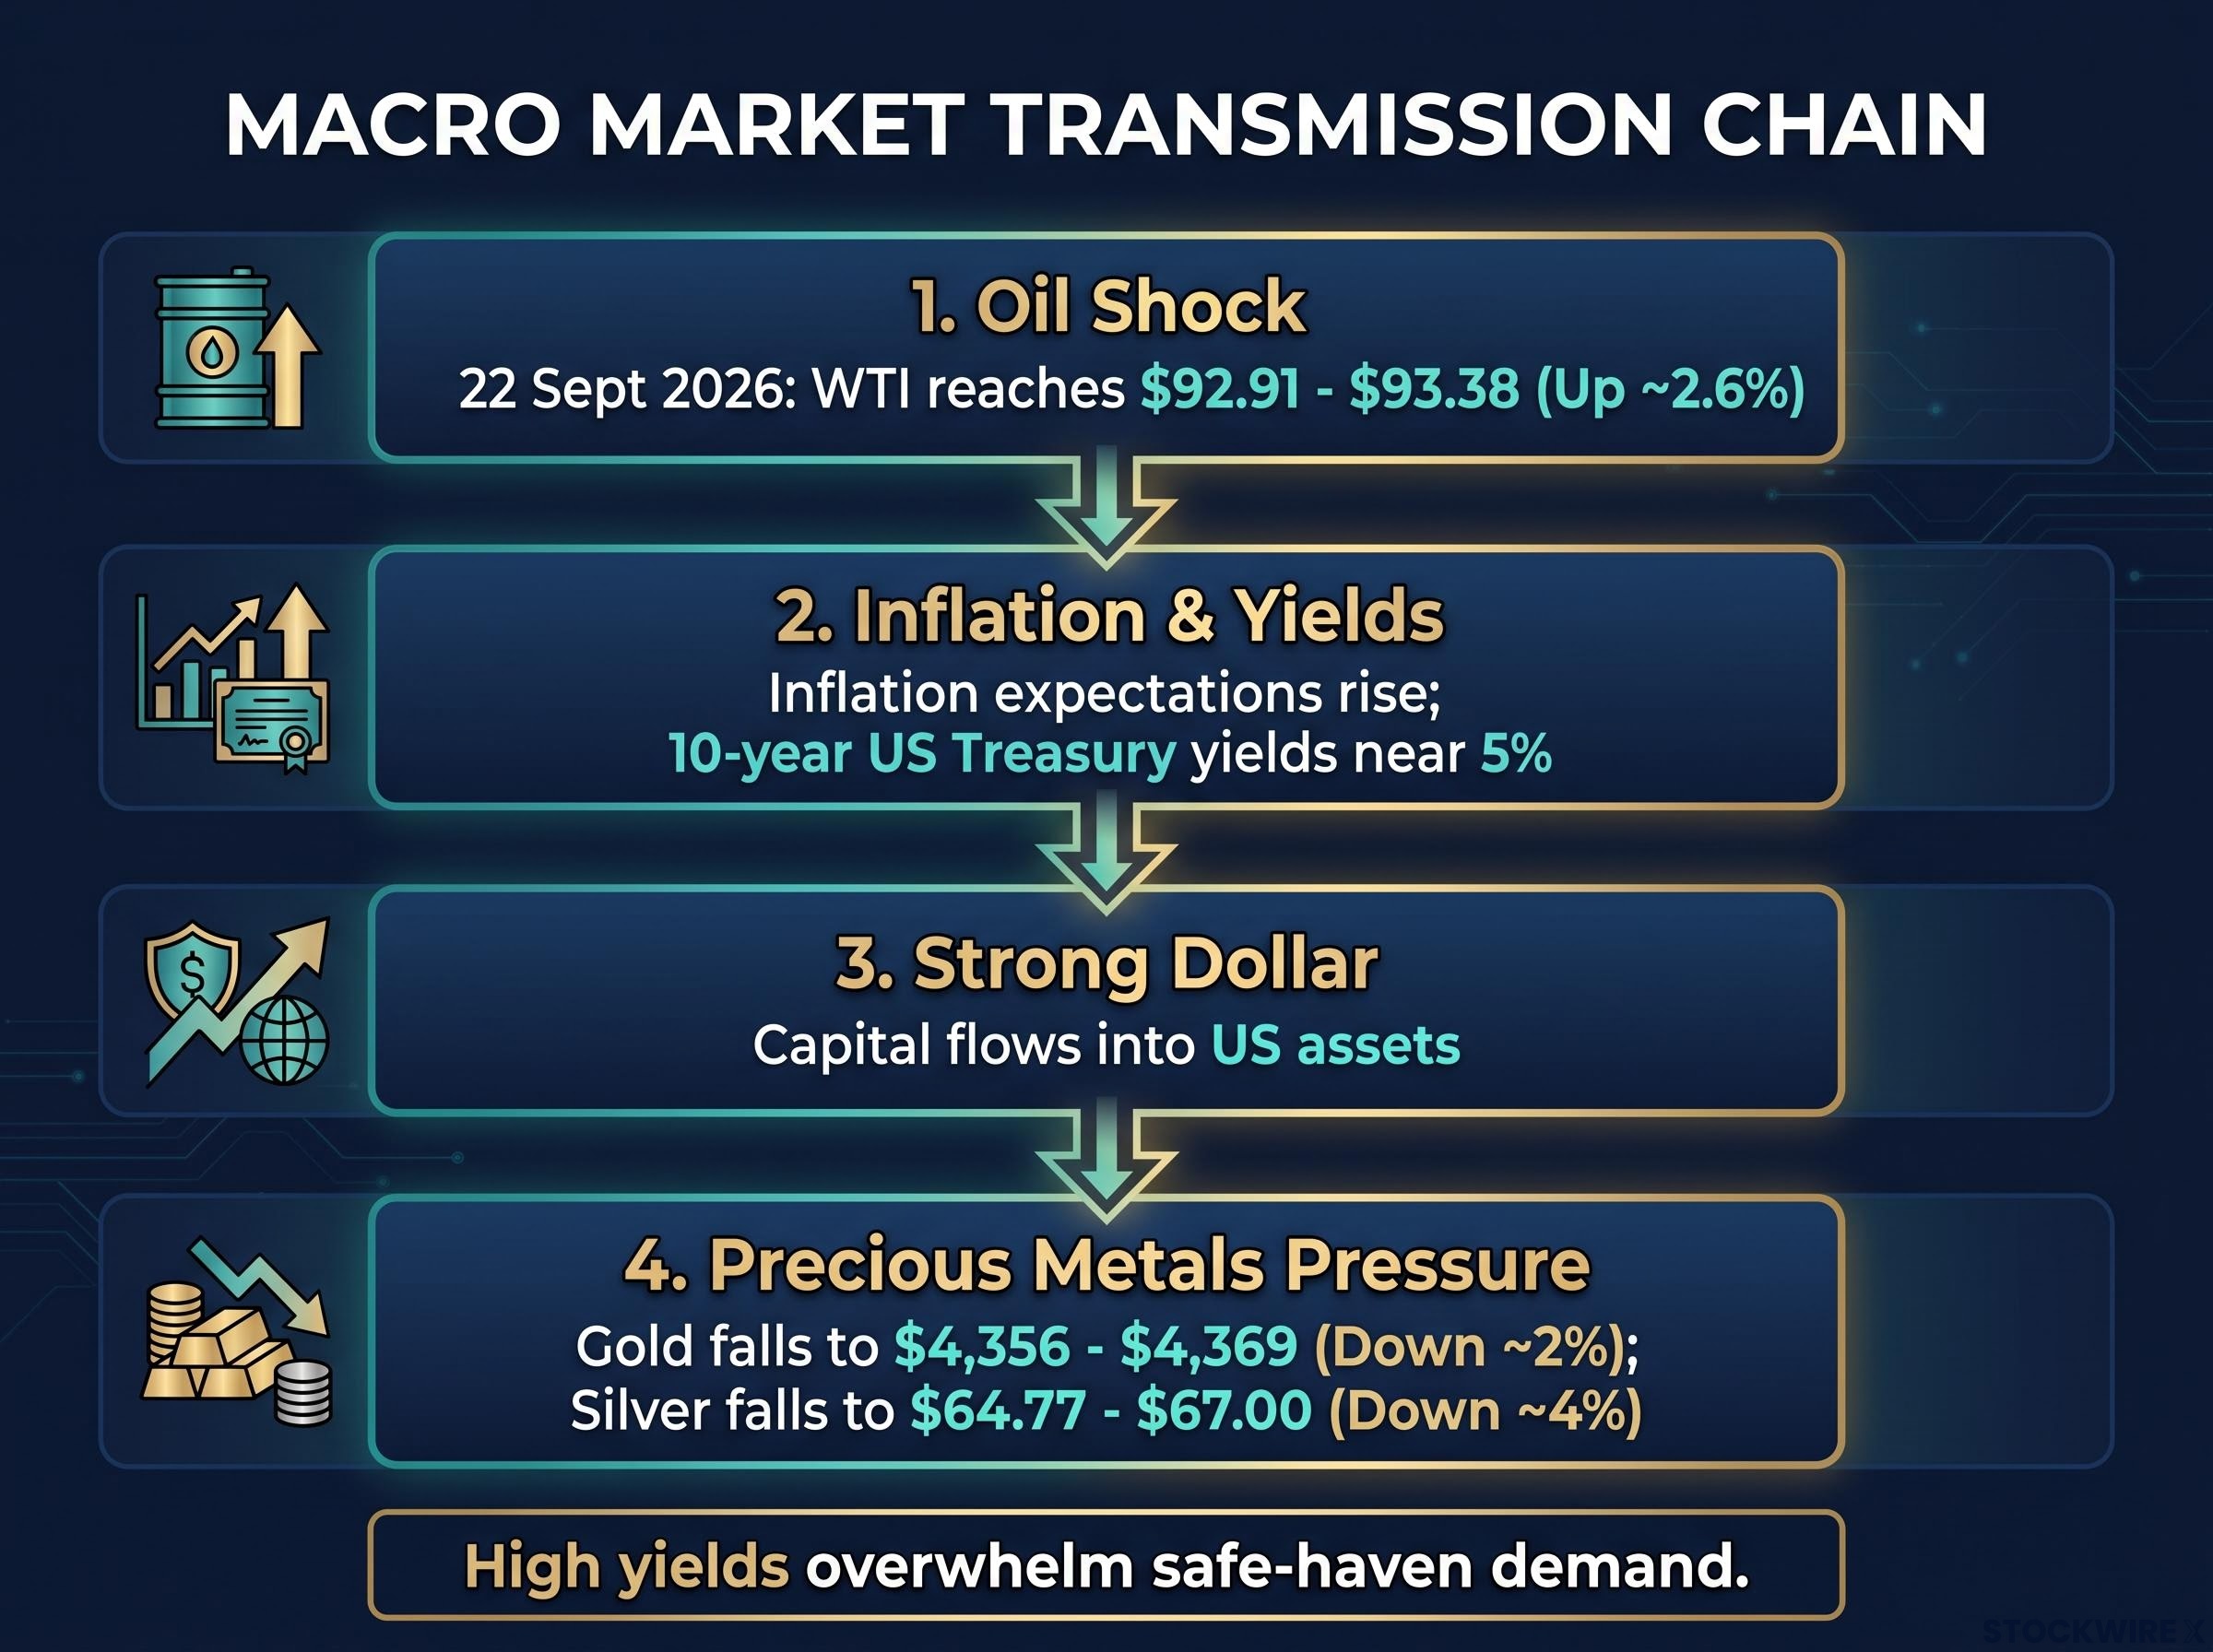
No physical supply changed hands. Yet crude, which had been trading above $88 per barrel, pushed higher immediately. On 22 September 2026, WTI traded around $92.91 to $93.38 per barrel, up roughly 2.6% on the day.
Why does a failed conversation move a physical commodity? Because oil markets do not price the disruption. They price the probability of one.
Here is the causal chain that runs underneath the headline:
- Diplomacy breaks down, and the odds of future Iranian supply constraint rise.
- Traders demand a supply-risk premium to hold barrels through that uncertainty.
- WTI moves higher on the premium alone, before any real shortage exists.
- Higher crude feeds straight into inflation expectations, which sets off everything in the next section.
The premium is real money attached to a risk that may never materialise. That is what makes the first skill of macro reading so valuable: telling a genuine supply threat apart from political theatre.
The geopolitical risk premium is rarely a fixed number: J.P. Morgan assessed the global oil market in September 2026 as oversupplied, with professional traders pricing only around $2 per barrel of risk premium despite active US-Iran tensions, which is precisely why headline spikes that lack a credible supply floor tend to reverse within the same session.
Credible disruption versus headline noise: how to tell the difference
The market itself gives you a clean lesson from 2026. On 7 July 2026, Iran attacked commercial vessels in the Strait of Hormuz and the US revoked a general licence for Iranian crude sales. Both Brent and WTI surged more than 5% intraday.
The July Hormuz episode was a credible supply threat. A chokepoint that carries a large share of seaborne crude was directly targeted, and the licence revocation raised the odds of actual volume leaving the market. Prices held because the risk was logistical, not rhetorical.
Contrast that with late August 2026. New US sanctions on Iran were judged to pose “limited near-term supply risk,” and WTI futures fell roughly 2.5% to 3.1%, sliding into the $82 to $85 range. Same adversary, same broad tension, opposite price reaction.
The determining factor is simple. Does the event threaten to actually remove volume from the market, or does it only signal diplomatic friction with no logistical consequence? That distinction is a tradeable skill in itself, and it tells you headline risk in oil is never binary.
When big ASX news breaks, our subscribers know first
How oil shocks transmit into inflation, bond yields, and the US dollar
An oil surge is an inflation shock the moment it happens. Institutional commodity strategists frame chokepoint disruptions exactly this way, because the effects arrive fast.
Higher crude compresses household real incomes, raises input costs for energy-intensive businesses, and steepens breakeven inflation curves in bond markets. That last effect pushes nominal yields higher, because investors demand more compensation for the inflation they now expect.
Then the chain reaches the dollar. Higher yields make US assets more attractive to hold, capital flows in, and the dollar strengthens. Each link emerges from the one before it: oil to inflation expectations, inflation to yields, yields to the dollar.
This is where most investors’ intuition breaks. The reflex is that a geopolitical shock automatically lifts gold and silver as safe havens. The September 2026 session showed the opposite.
Gold fell roughly 2% and silver dropped around 4% during the session described in the source, prompting a defensive reduction in precious metals exposure. As of 21-22 September 2026, spot gold sat near $4,356 to $4,369 per ounce and silver near $64.77 to $67.00 per ounce, both pressured despite the geopolitical anxiety.
The dominant structural headwind was benchmark 10-year US Treasury yields sitting near 5%. When risk-free yields are that high, the cost of holding assets that pay no yield rises sharply, and the rate channel can overwhelm the safe-haven channel entirely.
| Asset | Intuitive Expectation | Actual Direction | Dominant Driver |
|---|---|---|---|
| Gold | Rises on safe-haven demand | Fell approximately 2% | Strong dollar and ~5% 10-year yields |
| Silver | Rises alongside gold | Fell approximately 4% | Rate opportunity cost plus industrial demand fears |
Because global bullion trades in dollars, a stronger dollar squeezes demand through three separate channels:
- Pricing effect: a stronger dollar raises the effective price for every buyer outside the US.
- Opportunity cost: firmer real yields make non-yielding metals more expensive to hold relative to bonds.
- Reduced non-US appetite: overseas buyers pull back as the currency conversion works against them.
The takeaway upgrades your mental model considerably. “Geopolitical risk equals buy gold” is incomplete. The rate environment at the moment of the shock decides whether safe-haven flows actually appear or get buried under yield dynamics.
The gold and silver divergence that played out through September 2026 has deeper structural roots than a single session: the Bitcoin-to-gold correlation swung from 0.289 in October 2025 to -0.88 by spring 2026, a level of instability that signals a genuine regime shift in how non-yielding assets respond to rate environments rather than temporary repositioning.
Why the same macro environment hits small-cap and large-cap equities so differently
Equities did not move as one bloc either. In late September 2026 the S&P 500 retreated from key chart resistance after a failed early-week rally, the Nasdaq held up comparatively well, and the Russell 2000 took the steepest selling.
That split looks strange if you assume a hawkish, strong-dollar shock should punish shares indiscriminately. It does not, and the reasons are structural rather than sentimental.
Financial commentators point to five reasons small-cap indices chronically lag large-cap technology in high-inflation, strong-dollar, hawkish regimes:
- Balance-sheet structure: small-caps lean on bank lending and floating-rate debt, so restrictive policy spikes their interest costs immediately. Mega-cap tech often holds net cash and long-dated fixed-rate debt.
- Margin and pricing power: dominant platforms raise prices without losing share; small-caps run thinner margins and struggle to pass on rising input costs.
- Sector composition: the Russell 2000 is heavily weighted to domestic cyclicals, financials, and industrials, all directly exposed to credit conditions.
- Dollar-strength dynamics: the usual benefit of a strong dollar for domestic firms is offset when that strength comes from tight US credit and higher funding costs.
- Duration effects: large-cap tech is a long-duration asset, yet structural demand for AI and digital services has let it rally on quality-growth merits even as macro conditions worsen.
| Structural Factor | Russell 2000 Exposure | Nasdaq 100 Exposure | Net Disadvantage for Small-Cap |
|---|---|---|---|
| Debt structure | Floating-rate, bank-dependent | Net cash, long-dated fixed | High |
| Pricing power | Thin margins, weak pass-through | Strong platform pricing | High |
| Sector mix | Cyclicals, financials, industrials | Global subscription tech | High |
| Dollar strength | Offset by funding costs | Cushioned by cash and scale | Moderate |
| Duration | No quality-growth floor | AI-driven growth floor | Moderate |
The Nasdaq’s resilience is not immunity. It is a quality-growth floor that structural AI demand keeps propped up while conditions deteriorate around it.
Multiple contraction from rising yields is a separate mechanism from any deterioration in underlying business performance: high-multiple growth stocks priced at 20-25 times earnings face valuation compression purely from a higher discount rate, which is why the Nasdaq’s resilience in a yield-spike environment depends on whether structural AI demand can offset the mechanical downward pressure on multiples.
The September 2026 equity split in practice
Apply the five factors to the live session and the pattern resolves cleanly. The Nasdaq held partly on enthusiasm around Meta’s expanded AI infrastructure and compute investments, a textbook example of the quality-growth floor doing its job.
The S&P 500, more balanced across sectors, failed at resistance and slipped back. The Russell 2000, carrying floating-rate debt into a strong-dollar, high-yield environment, sold off hardest of all.
For you, that means index selection is a macro positioning decision, not just a style preference. Choosing between the Russell 2000 and the Nasdaq in this environment carries real return consequences, and it is one of the most underappreciated levers you control in equity allocation.
How a macro investor translates all of this into a live portfolio
Here is how the layers you have absorbed map onto real allocation. Treat the following as a worked example, not a model to copy.
The source detailed a defensive, inflation-hedging, multi-asset structure. On the long side sat crude oil (anticipating a rebound), Bitcoin, gold (pending a definitive break of key support), silver (with exposure cut by one-third after session losses), and the US dollar. On the short side sat the Russell 2000 and the S&P 500, the latter via a long-dated vertical put spread. A TLT vertical spread on long-dated Treasuries was held to watch bond behaviour at key technical levels.
Every line item traces back to the transmission chain: long the supply-premium beneficiaries, long the currency that strengthens with yields, short the equities most exposed to the rate and dollar squeeze.
This kind of geopolitical, multi-asset trade carries specific risks:
- Short-lived supply disruptions: if output is quickly rerouted, the initial crude spike reverses and long-oil positions go underwater.
- Rapid inflation reversal: if oil falls back while central banks stay hawkish, commodities and risk assets can drop together.
- Rates dominating the metals thesis: long-metals positions may fail as hedges if yields and the dollar dictate pricing.
- Equity short squeezes: index shorts are vulnerable if markets look past the shock and large-cap tech keeps rallying.
- Dovish policy pivot: a policymaker turn toward growth fears can spark a bond rally and equity rebound that unwinds the whole structure.
History shows why duration is everything. The outcomes span from a weeks-long reversal to years of dislocation.
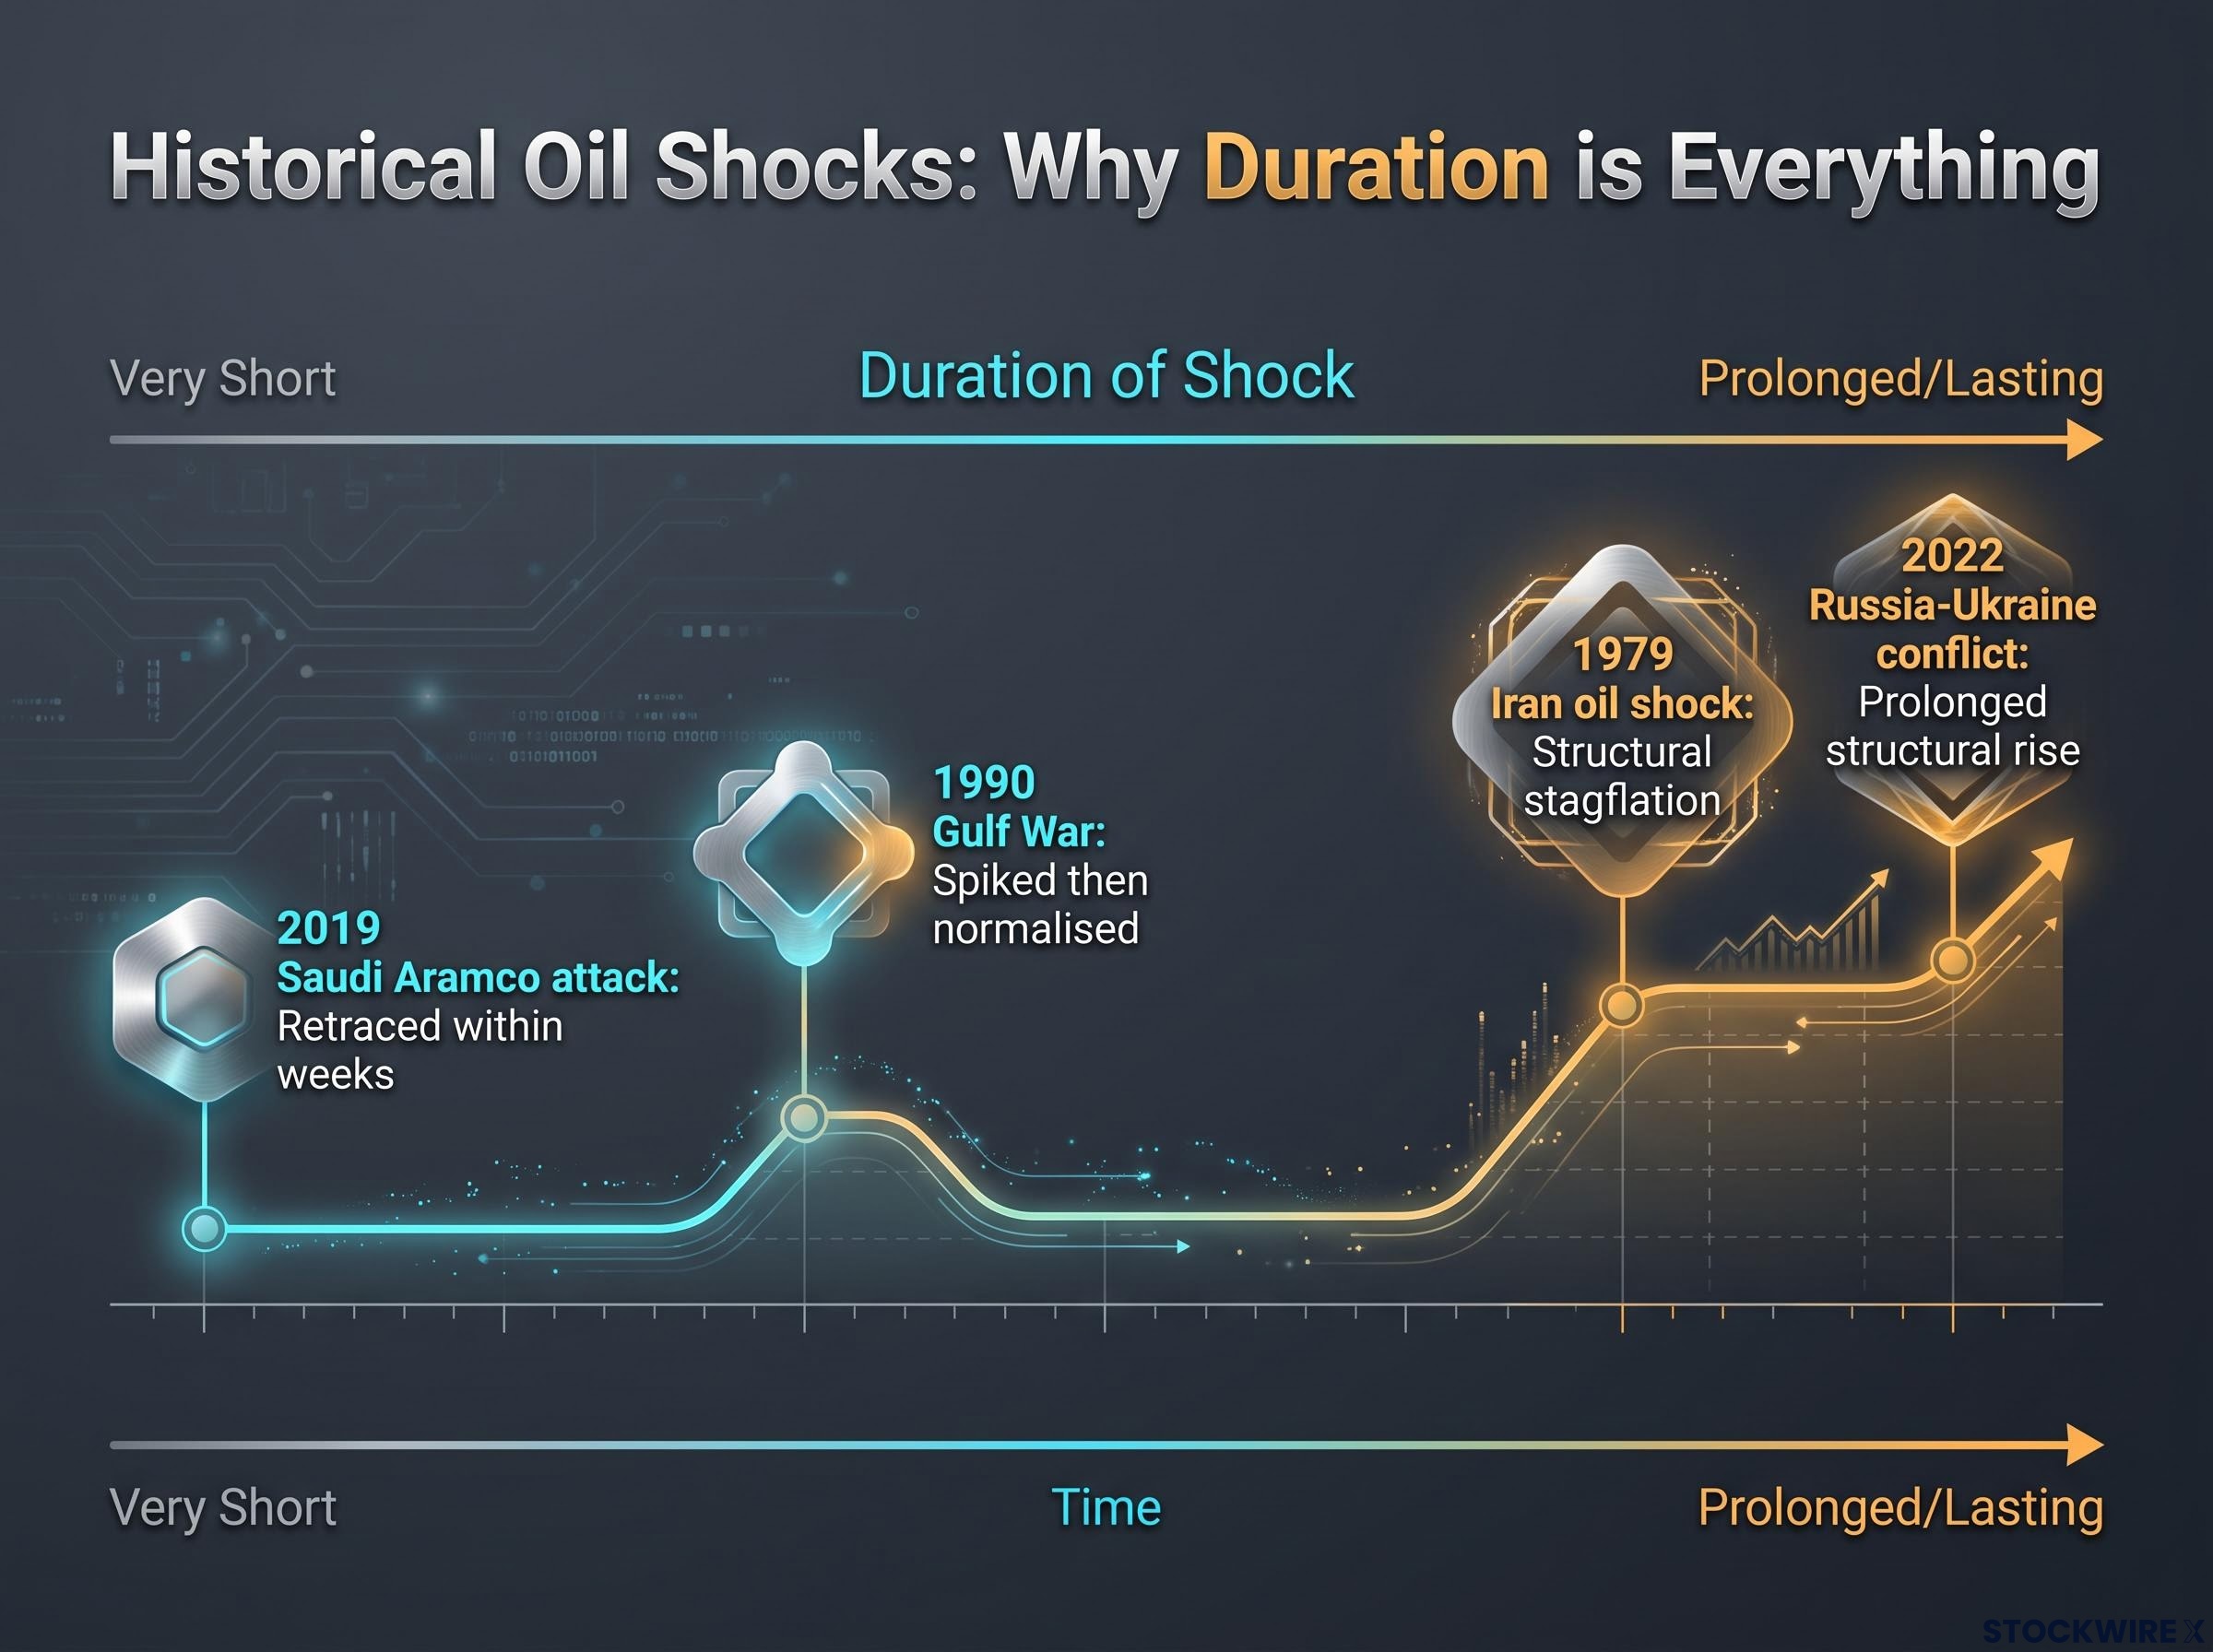
| Event | Year | Oil Price Outcome | Duration of Shock | Key Portfolio Lesson |
|---|---|---|---|---|
| Iran oil shock | 1979 | Structural stagflation | Prolonged | Large supply loss can reset the inflation regime |
| Gulf War | 1990 | Spiked then normalised | Short | Conflict alone does not guarantee scarcity |
| Saudi Aramco attack | 2019 | Retraced within weeks | Very short | Spare capacity restores output faster than feared |
| Russia-Ukraine conflict | 2022 | Prolonged structural rise | Lasting | Trade-flow rewiring drives durable inflation |
The defining question for any geopolitical oil trade is deceptively simple: how much supply is actually leaving the market, and for how long? The answer decides whether you are trading a 1990-style spike-and-reverse or a 2022-style structural break.
Reading the next geopolitical shock before the market does
The framework you now hold is not about Iran. It applies the next time an oil producer faces sanctions, a chokepoint is threatened, or any commodity shock meets a tight monetary environment.
Reduce the whole article to a reusable checklist you can run against any future catalyst:
- Geopolitical catalyst hits.
- Assess supply credibility: real volume risk or political theatre?
- Map the inflation expectation shift.
- Trace the yield and dollar response.
- Identify the asset-class divergence, especially small-cap versus large-cap.
- Translate into positioning that responds to confirmation, not speculation.
With WTI near $93 per barrel and 10-year yields near 5%, three variables will decide whether the current US-Iran situation becomes a structural shock or a tradeable spike:
- Whether physical Iranian supply is genuinely constrained, or simply rerouted.
- Whether the Federal Reserve treats the oil shock as reason to hold rates higher for longer.
- Whether large-cap tech keeps providing a growth floor for equity indices.
Read that as a decision tree. Contained and short, like 1990 or 2019, argues for fading the spike. Structural and prolonged, like 2022, argues for holding the hedges.
The point of a macro approach is not predicting the geopolitics. It is mapping the transmission pathways ahead of time so your allocation reacts to what is confirmed rather than what is merely feared.
For investors wanting to translate the macro transmission framework into a structured allocation approach, our comprehensive walkthrough of building portfolio resilience covers the three-tier adaptive framework that Bridgewater Co-CIO Bob Prince advocates, including how to calibrate a tactical band around a strategic core when inflation and growth regimes shift simultaneously.
This article is for informational purposes only and should not be considered financial advice. Investors should conduct their own research and consult with financial professionals before making investment decisions. Past performance does not guarantee future results, and these forward-looking scenarios are speculative and subject to change based on market developments.