
The S&P 500 closed at a record 7,818.93 on 6 October 2026. By this morning, Dow futures were down 532 points, and the market was flashing the kind of bearish reversal signals that tempt investors to either over-read them or ignore them.
The setup is not one thing. It is a small bearish engulfing candle, a failed breakout in S&P futures, a Dow still well short of its summer peak, a VIX (the CBOE Volatility Index, a measure of expected S&P 500 swings over the next 30 days) near 15, and 10-year Treasury yields above 5%. They all arrived together.
Today is 7 October, so this is a live read, not hindsight. Nobody yet knows whether this session marks a turn or a pause.
Here is how to judge whether this reversal deserves action or just attention. It also covers how to weigh a slow, data-driven bond warning against the fast-moving AI story that carried stocks to records.
What does a one-session reversal after record highs actually tell you?
What the candle and failed breakout show
The record itself was real. The S&P 500 gained 0.58% for its first record close since mid-August, and the Nasdaq Composite added 0.45% to a record 27,599.79.
Then the futures turned. E-mini S&P futures slid back beneath a horizontal breakout line they had already failed to clear once before a later push got through. Nasdaq futures erased the prior day’s gain and a little more, though they held above their own breakout level. The Russell led the declines, and the Dow sat among the weakest.
A bearish engulfing candle is a one-day price bar whose body fully covers the previous day’s gain and closes lower. It tells technicians that buyers were absorbed and sellers took control for the session. A failed breakout is a move above resistance that quickly falls back below it, which suggests overhead supply reasserting itself and weak sponsorship behind the rally.
Why reliability is only moderate
On its own, the evidence is thin. Technical literature associated with John Murphy and StockCharts gives these patterns only moderate standalone reliability, which improves when the pattern:
The NYU Stern technical analysis review of empirical testing reaches a similarly cautious view, finding that charting patterns carry limited standalone predictive power and are hard to validate statistically.
- follows an extended rally or overbought momentum readings
- coincides with weakening breadth and stretched valuations
- lines up with macro stress, such as rising yields or widening credit spreads
In strong uptrends, many of these candles resolve into shallow consolidations. That is why institutions tend to treat them as risk-management triggers, prompting tighter stops and lower leverage, rather than as timing tools.
The bull’s dilemma Tim, speaking on Tasty Live, framed the setup as one where bulls could only lose, while cautioning that a single session cannot confirm a change in trend.
That balance is the right one. The candle tells you risk has risen at the margin, not that the trend has ended, so the sensible response is to check your stops and exposure rather than reposition wholesale.
When big ASX news breaks, our subscribers know first
Why is the Dow lagging while the VIX sits near 15?
The candle carries more weight once you notice what sits beside it. Two indices are at records. The third is not.
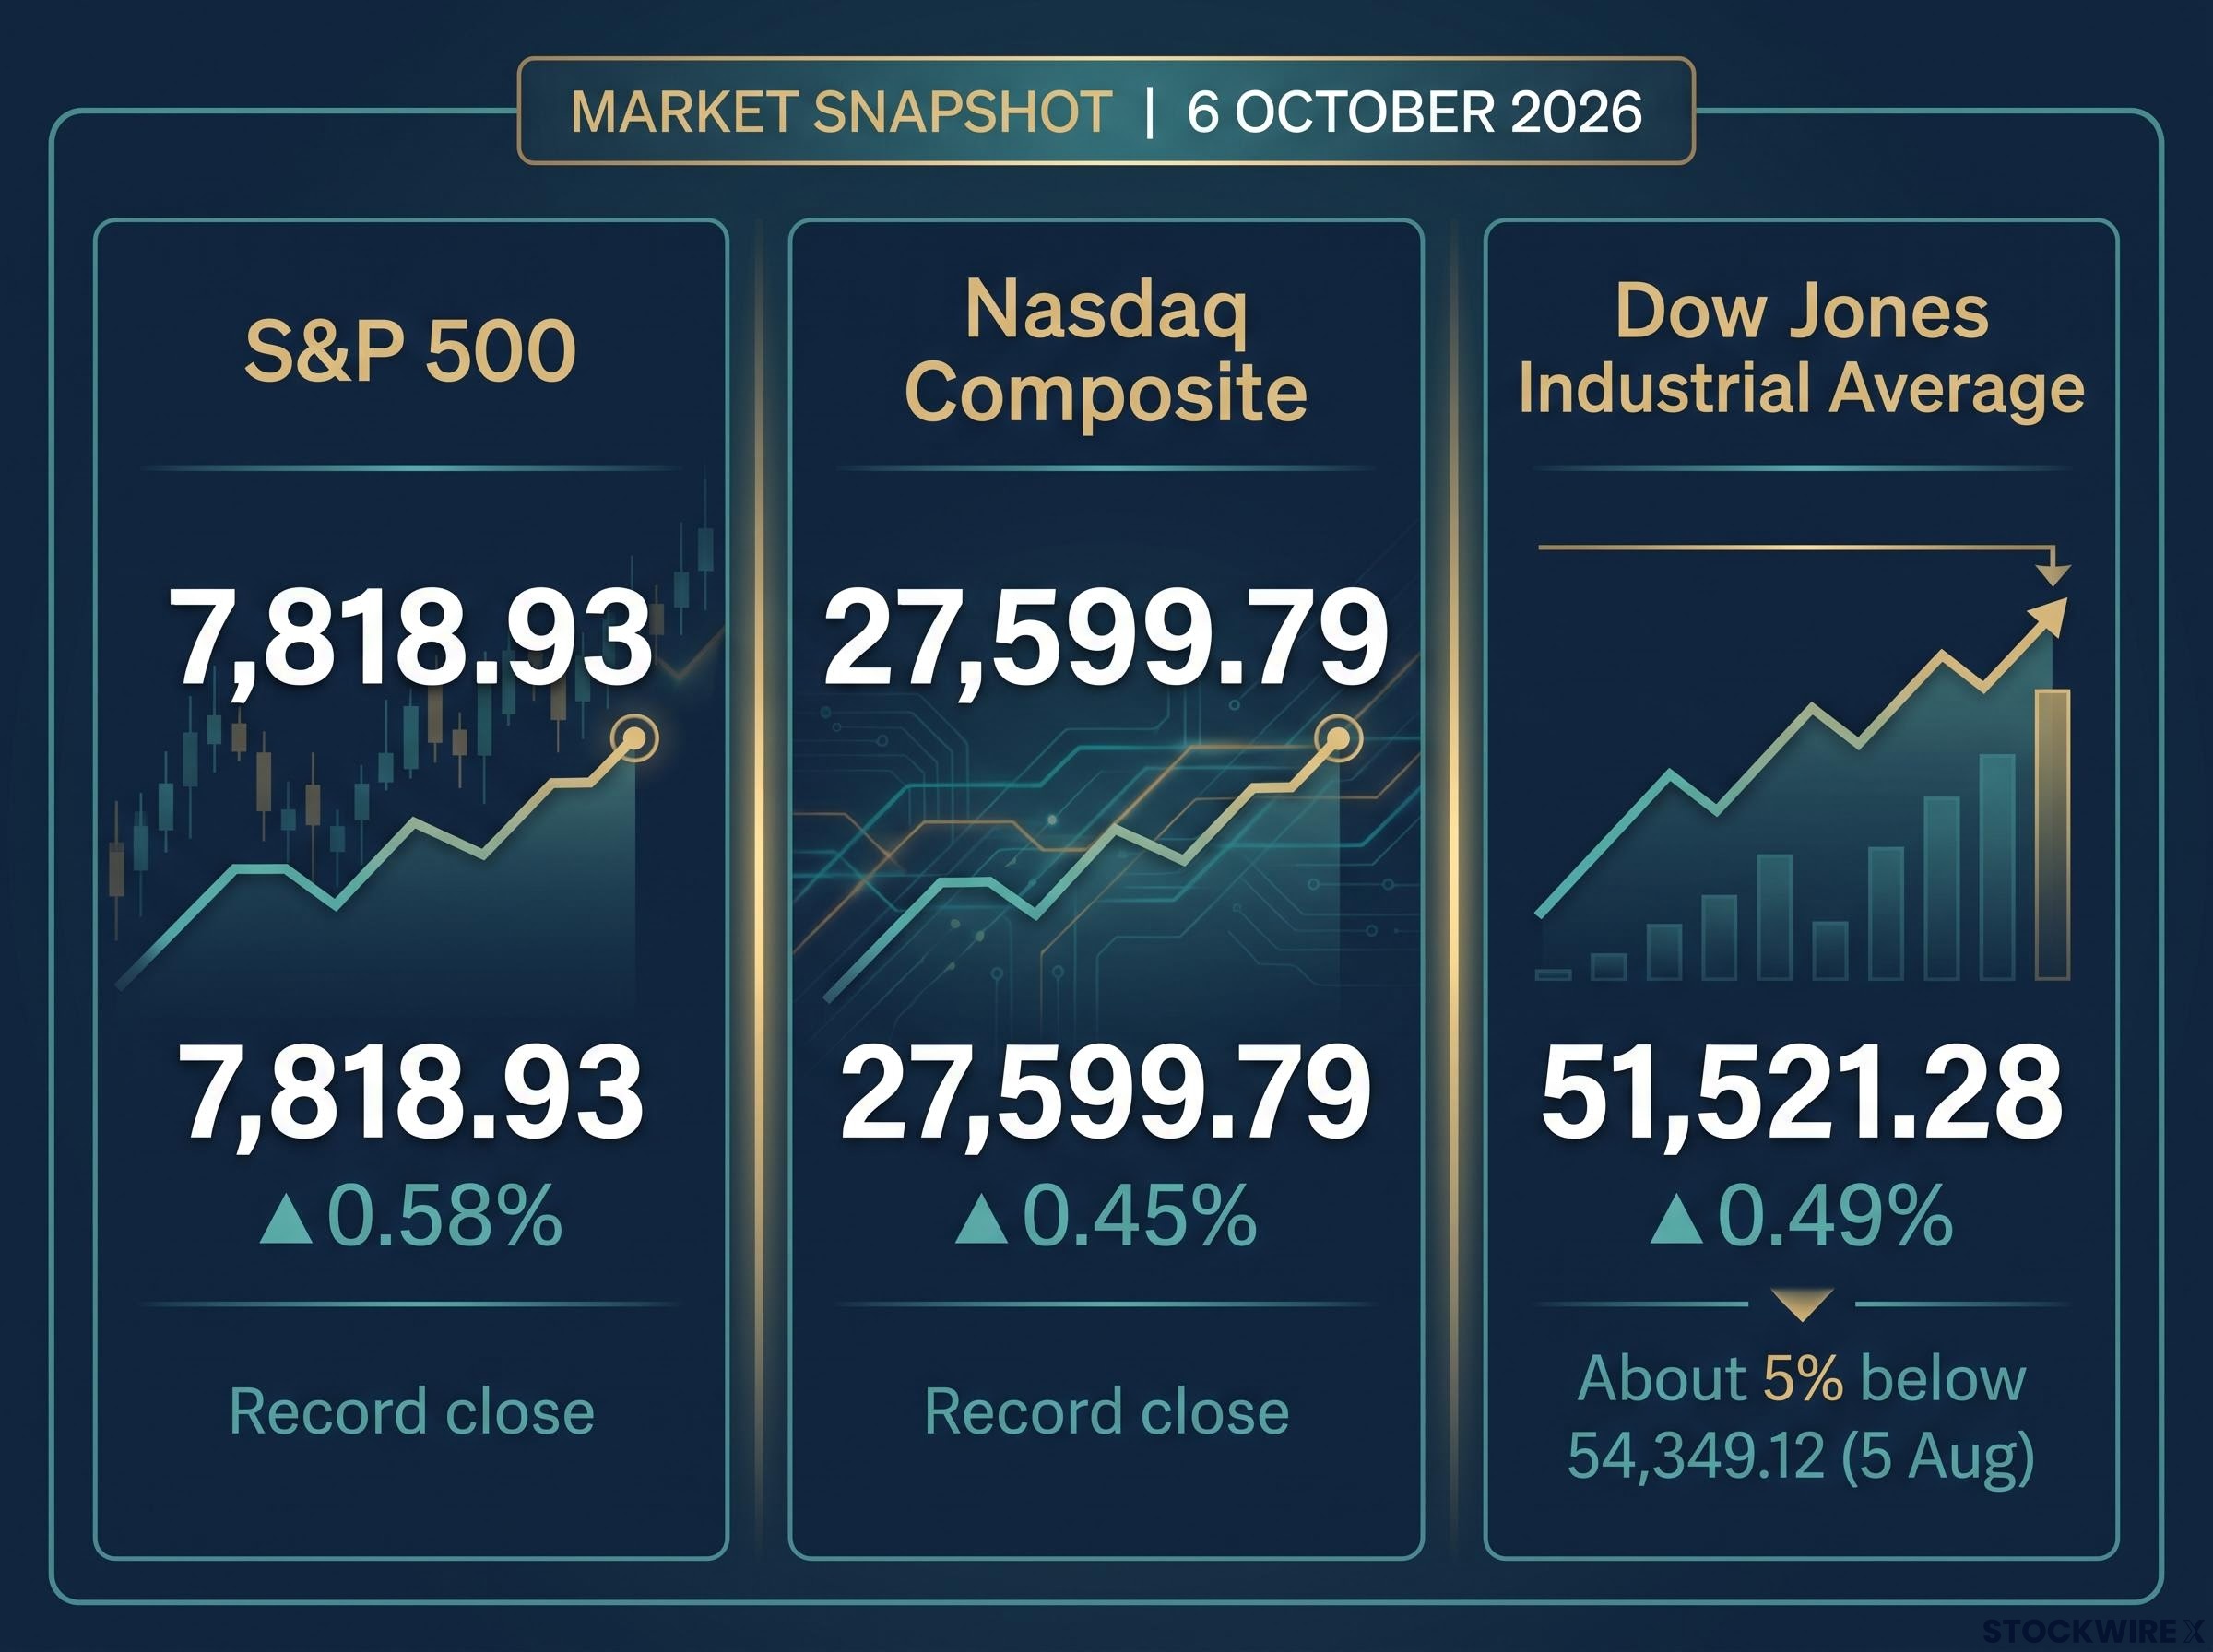
| Index | Close (6 Oct 2026) | Daily move | Position vs record |
|---|---|---|---|
| S&P 500 | 7,818.93 | +0.58% | Record close |
| Nasdaq Composite | 27,599.79 | +0.45% | Record close |
| Dow Jones Industrial Average | 51,521.28 | +0.49% (+253 points) | About 5% below 54,349.12 (5 Aug) |
Dow futures have tracked a down channel since a shooting-star candle on 5 August, the day of the Dow’s record. A shooting star is a candle with a long upper wick and small body, showing a rally that was rejected intraday. Leadership has narrowed to the large-cap growth names that dominate the S&P and Nasdaq.
That narrowing explains the calm VIX. The VIX is derived from S&P 500 options, not Dow components, so strong mega-cap tech with small daily swings can hold it near 15.01, where it closed on 6 October, even as cyclical stocks struggle. It was 15.67 on 24 September, the same day long-dated yields hit multi-decade highs, a mismatch Gate News flagged as options markets underpricing bond stress.
Structural flows add to the suppression. Systematic option selling, volatility-targeting funds and corporate buybacks all dampen implied volatility. Some argue the calm is genuine, pointing to low realised volatility and healthy balance sheets. Bears point to early 2018, when a low VIX alongside stretched positioning preceded a sharp correction.
Reading a VIX near 15 correctly depends on which of the recent VIX regimes applies, because the same level has carried different forward implications for equity returns across different periods since 2017.
Volatility manager Chris Cole has warned that low implied volatility is not the same thing as low risk, because volatility can reprice abruptly once stress breaks through. For you, the read is direct: the VIX is pricing the mega-cap story, not the whole economy, so it is no evidence that breadth is healthy.
How do bonds, yields and interest costs challenge the AI-earnings story?
Gate News reported the 10-year yield near 5.20% on 24 September, its highest since 2007, with the 30-year near 5.48%, highest since 2004. Federal Reserve H.15 data for late September show a firmer picture: roughly 5.24-5.31% on the 10-year and 5.59-5.66% on the 30-year. One unverified report puts the 10-year peak at 5.34%; the official range tops out near 5.31%.
Tim argued that bonds have led equities lower several times, sometimes with a lag of months, because bonds respond to data while stocks run on a story. The transmission works through three channels:
- Higher discount rates: rising long-term yields reduce the present value of future earnings and compress valuations, as in 2018 (10-year above 3%) and 2022 (rapid Fed hiking).
- Deficits and issuance: heavy Treasury supply can push yields up if demand lags, a risk strategists at BlackRock and Morgan Stanley have said can spill into equity risk premia.
- Interest-expense feedback: if investors fear interest is eating a growing share of the budget, they demand higher yields. Tim put interest payments at 14% of the federal budget, a figure not verified against CBO or Treasury data.
The counter-case is credible. In 2023, AI-exposed mega-caps rallied through rising rates, and the 1999-2000 period showed equities ignoring tightening until growth or liquidity faltered.
| Factor | Bear case | Bull case |
|---|---|---|
| Valuation | Yields above 5% cap multiples | Growth justifies premium multiples |
| Earnings | Higher hurdle for any disappointment | AI productivity and margin expansion |
| Financing | AI spending increasingly funded by credit | Deep investor appetite for AI debt |
| Liquidity | Fiscal strain tightens conditions | Risk appetite stays intact |
The SpaceX financing test case
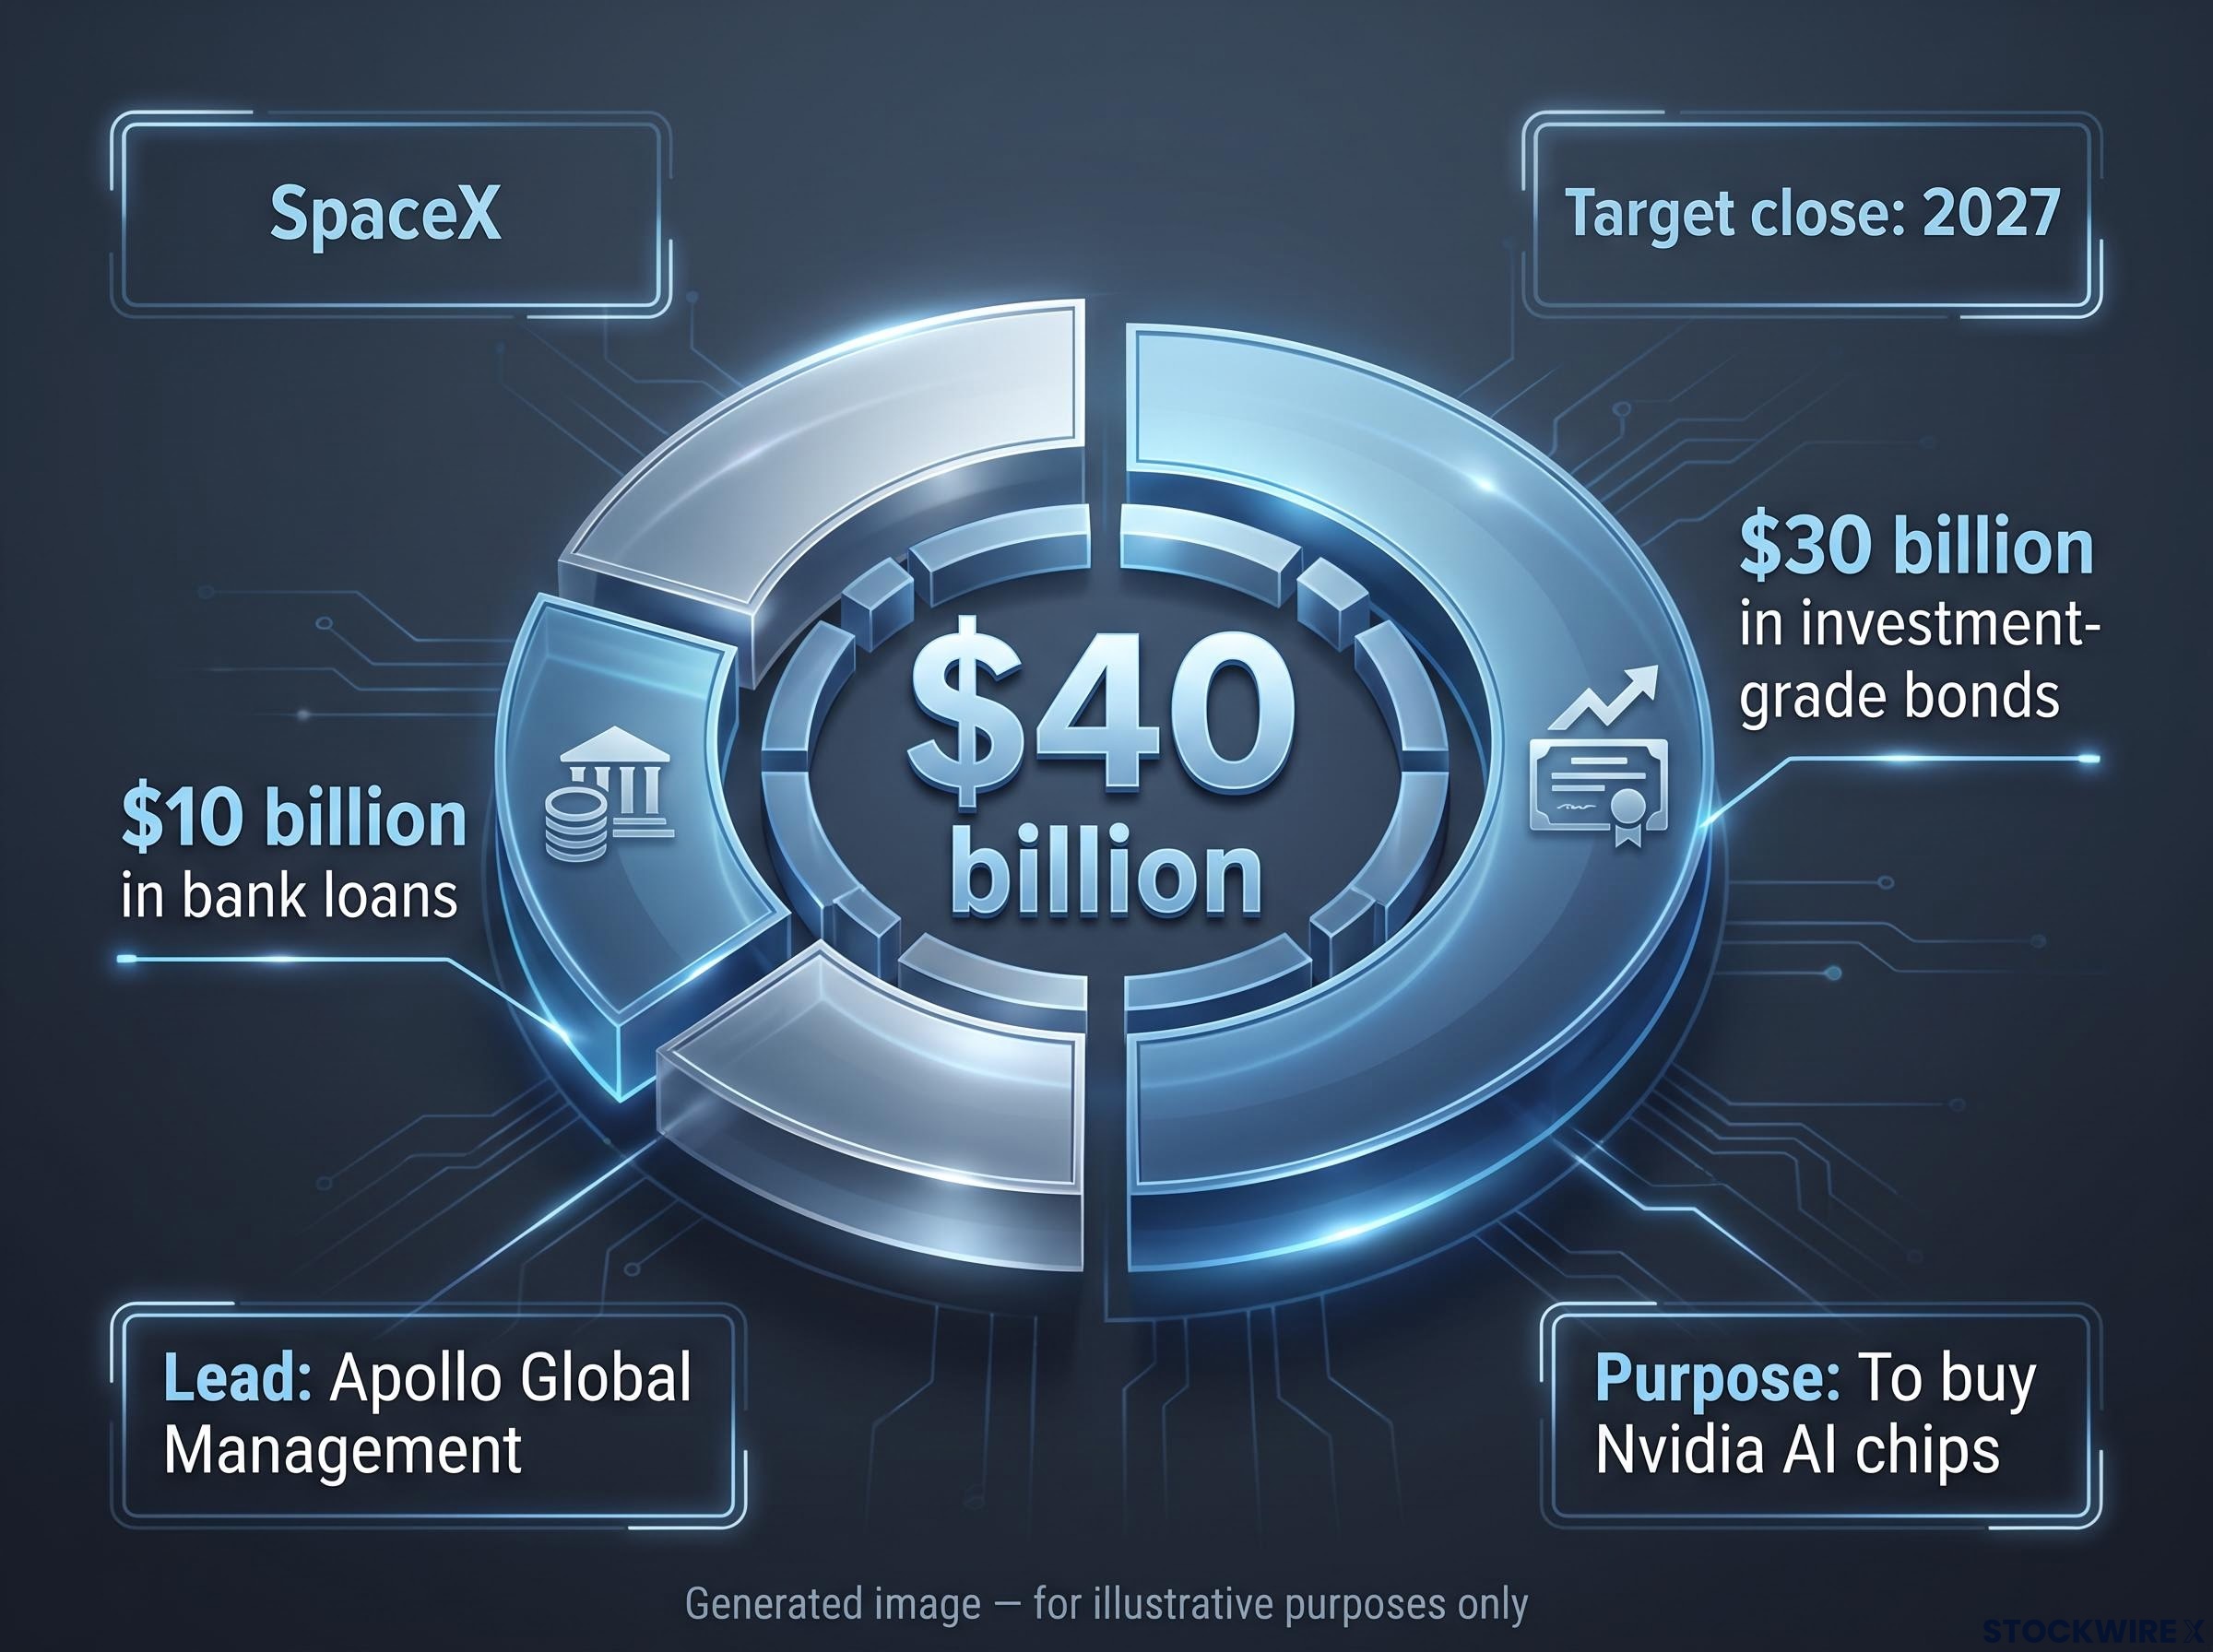
SpaceX is reported by Bloomberg, the Financial Times and Reuters to be in preliminary talks to raise about $40 billion, roughly $10 billion in bank loans and $30 billion in investment-grade bonds, to buy Nvidia AI chips. Apollo Global Management is reportedly leading, with a target close in 2027, and the talks are early-stage and non-binding.
IFA Magazine commentary described the structure as a “dangerous money loop”, an opinion rather than an established fact. The market shrugged: Nvidia dipped only slightly. With yields above 5%, your test for AI earnings is whether they clear a far higher risk-free hurdle, not whether they grow at all.
Why did gold, silver and Bitcoin fall alongside stocks?
If you hold metals or crypto as a hedge, this session was uncomfortable. Instead of offsetting the equity reversal, they fell with it.
What moved
According to the session discussion on Tasty Live:
- Silver dropped about 2.5%, with its intraday low touching a supporting trendline
- Gold fell with stocks before recovering slightly off its lows
- Bitcoin lost almost $3,000 after a run-up that had stalled for a couple of weeks
- MicroStrategy fell about 5.5%
- Crude oil was the exception, driven by its own geopolitical news
Why they moved together
Three forces explain the lockstep. When global liquidity is abundant, equities, metals and crypto rise together as pro-cyclical risk assets. Rising real yields and a firm dollar weigh on non-yielding assets like gold and silver regardless of what stocks do.
The third force is deleveraging. In acute stress, leveraged holders sell whatever they can to meet margin calls, pushing short-term correlations toward 1.
Firms such as Bridgewater have long stressed that gold and Bitcoin are not guaranteed short-term diversifiers. This is a liquidity pattern, not proof that safe havens have failed, and such correlations tend to be short-lived. The useful question is how much of your portfolio shares a single liquidity risk without you realising it.
Rising gold and copper correlations with the S&P 500 show how metals have drifted toward behaving like equity proxies, which helps explain why they offered little protection during the reversal.
What the reversal changes, and what it does not
The reversal is a meaningful but unconfirmed warning. A lagging Dow, a VIX near 15 against yields above 5%, and correlated cross-asset selling strengthen it. The long record of rewarded dip-buying since the GFC weakens it.
History cuts both ways. Early February 2018 and late February 2020 began as reversals from highs and grew into sharp declines. Many pullbacks across 2013-2017 and 2021-2023 faded into renewed rallies.
Confirmation would look like:
- follow-through down days on expanding volume
- worsening breadth, with more new lows and fewer new highs
- widening credit spreads
- rising cross-asset volatility
- long-dated Treasury yields pushing higher
Until those appear, size your risk to the evidence, not the headline.
This article is for informational purposes only and should not be considered financial advice. Investors should conduct their own research and consult with financial professionals before making investment decisions. Past performance does not guarantee future results, and forward-looking views are speculative and subject to change.