The moment a trade gets called contrarian in a public forum, a Discord server, or a financial newsletter, the most important thing about it has already changed. The label is not describing the trade. The label is describing what the crowd now believes about the trade.
That distinction matters more than ever right now. The bond market has spent years generating “long bonds is the contrarian trade” commentary from retail investors, institutional fixed-income desks, and hedge fund commentators at the same time, which is a logical impossibility if the word means what people think it means. Meanwhile, crowded calendar patterns like the September effect and sell-in-May have delivered flat or positive returns precisely when the seasonal pessimism would have suggested a clean contrarian entry.
The pattern keeps repeating because the mechanism behind it is poorly understood. After reading this, you will be able to apply a four-condition test to any trade wearing the contrarian label and work out whether it is genuinely positioned against the crowd or whether it is consensus exposure in disguise.
When the label “contrarian” becomes self-defeating
Your instinct probably tells you that being contrarian means going against the crowd. That instinct is close, but it is dangerously incomplete, because the crowd can hold a contrarian label just as comfortably as it holds any other consensus position.
A genuine contrarian trade requires opposition to prevailing positioning and the prevailing narrative, not merely opposition to price momentum or surface-level sentiment. It is a structural relationship, not a mood.
This is where the label becomes self-defeating. When retail investors, institutional desks, and online communities are all pursuing the same “contrarian” trade at once, the positioning condition is already broken. Everyone chasing the mispricing means the mispricing is being funded by the very people who think they are opposing it.
For a trade to stay genuinely contrarian, four conditions all have to hold at the same time:
- It must run against prevailing positioning and narrative, not just against recent price action.
- Structural impediments, such as regulation, mandate constraints, career risk, or leverage limits, must prevent most capital from exploiting the mispricing.
- The thesis must be anchored in fundamentals or structural flows, not in a statistical pattern that anyone can replicate.
- You must be prepared for extended adversity and mark-to-market losses before any mean-reversion arrives.
The academic foundation for this sits in behavioural finance. Werner De Bondt and Richard Thaler’s 1985 work on stock market overreaction, and the 1998 investor sentiment models of Barberis, Shleifer, and Vishny, imply that a contrarian edge only exists while price moves are driven by behavioural errors and while arbitrage capital stays constrained. Remove either condition and mean-reversion stops being reliable.
Behavioural biases deepen market inefficiency rather than correct it, causing investors to sell precisely when the gap between price and value is widest, which is the same dynamic that makes genuinely contrarian entries so rare and so uncomfortable in practice.
Andrew Lo’s Adaptive Markets Hypothesis explains what happens next. Profitable anomalies are temporary because participants learn, adapt, and compete the excess return away.
As a strategy becomes popular, its excess returns shrink. The edge does not disappear because the idea was wrong. It disappears because too many people learned it, deployed capital, and left only normal risk-adjusted returns or worse.
Here is the number that should reframe your thinking. Roughly 70% of contrarian trades based on Commitments of Traders crowding signals end in losses. The edge, where it exists at all, lives in payout asymmetry rather than in a superior win rate.
That 70% loss rate is not an argument against contrarian thinking altogether. It is a direct challenge to anyone who believes that spotting a crowded trade is enough to justify taking the other side of it. Identifying the crowd is the easy part. Being genuinely positioned against it is the part almost everyone gets wrong.
When big ASX news breaks, our subscribers know first
How a trade loses its edge once it becomes widely known
A contrarian trade does not lose its edge in a single moment. It bleeds it out in stages, and if you can see the stages, you can spot the point where you stop holding an edge and start holding a liability.
The mechanism is direct. Once a contrarian trade is widely recognised, capital floods in, compresses the original mispricing, and converts the position into consensus exposure. The risk premium that made the trade attractive gets arbitraged away.
What you are left holding at the end of that process is the worst of both worlds: consensus exposure that carries contrarian-level risk.
This is where the win-rate distinction becomes essential. Crowded positioning increases the potential magnitude of a decline if one occurs. It does not increase the probability that one will occur. You are not improving your odds by piling into a crowded contrarian trade, you are only changing the size of the payout on the occasions the odds happen to break your way.
That is why the 70% loss rate persists even for signals that look statistically compelling. The coin is not more likely to land your way. The payout on the rare win is simply larger.
Anomalies decay for structural reasons that have accelerated over the past two decades:
- Arbitrage and quantitative trading systematically trade against known patterns, compressing the excess return.
- Lower transaction costs and the globalisation of capital flows make it far easier for large institutions to close the gap.
- Regulatory and tax changes alter the timing of portfolio rebalancing and tax-loss selling, undermining the behavioural foundations of older effects.
- Rising data-snooping awareness means practitioners now treat patterns that fail out-of-sample with scepticism, so less dedicated capital chases them.
What calendar patterns teach us about anticipatory discounting
Calendar anomalies are the cleanest demonstration of decay, because their history is public and their logic is simple enough for anyone to trade.
As a seasonal pattern gains visibility, accelerated enormously by social media, the market discounts it in advance. If everyone expects September weakness and sells in August, the weakness gets priced early and the edge evaporates.
The academic evidence backs this up. The January effect is largely absent in recent out-of-sample data. A 2025 analysis of the sell-in-May effect found that once September’s negative returns are controlled for, the difference between summer and winter returns loses statistical significance, meaning the famous seasonal pattern was always narrower than its reputation suggested.
CFA Institute analysis of the sell-in-May effect reviewed the academic evidence and found the pattern’s statistical foundation narrower than its popular reputation, consistent with the broader observation that calendar anomalies circulate widely enough to be anticipated and priced before the relevant period even arrives.
September 2023, historically considered the worst calendar month for equities, produced positive market performance during a period of widespread seasonal pessimism. The pattern everyone knew about did the opposite of what the pattern predicted.
The read you should take is uncomfortable. Knowing about a seasonal pattern is not merely unhelpful once the knowledge is widely shared, it can actively work against you by triggering the anticipatory discounting that erases the edge. This is exactly why experienced practitioners such as Jason Shapiro of Crowded Market Report exclude seasonality from their methodology entirely.
Once you understand crowding as a process, you stop asking whether a trade is contrarian and start asking a better question: has this trade already stopped being contrarian, and what am I actually holding now?
The bond market as a case study in the crowded contrarian paradox
Nowhere is the “who is the crowd?” problem more visible than in US Treasury positioning, where the same trade can be honestly described as both contrarian and consensus depending on which cohort you point at.
The positioning structure is bifurcated. Traditional asset managers are persistently net long duration, while leveraged funds, meaning hedge funds, are substantially net short via futures. Both sides are crowded, just in opposite directions.
CFTC Commitments of Traders data shows this split concentrated in shorter-duration contracts: TU (2-year), FV (5-year), and TY (10-year). Asset managers hold heavy longs, leveraged funds hold heavy offsetting shorts, and neither side has mean-reverted quickly.
The same configuration produces two opposite “contrarian” stories, depending purely on where you stand.
| Cohort | Positioning | What “contrarian” looks like from this vantage point |
|---|---|---|
| Traditional asset managers | Net long duration | Long bonds is consensus; shorting duration looks contrarian |
| Leveraged funds (hedge funds) | Net short via futures | Long bonds looks contrarian against the hedge-fund short |
| Retail and online communities | Net long bonds | Frames the long as a contrarian bet against hedge funds |
The same COT configuration can support opposing contrarian narratives depending on how the categories are interpreted. “Long bonds is contrarian” is true versus hedge funds and false versus asset managers, at the exact same moment.
The timing history makes the danger concrete. A COT-based long bond positioning signal appeared roughly three to four weeks before 22 September 2023, and it was avoided on qualitative crowd-assessment grounds after retail investors, Discord communities, and institutional desks were all found to be pursuing it simultaneously. The signal was real. The crowd behind it disqualified it.
Bear in mind the data itself lags. COT positions are recorded as of Tuesday and released Friday at 3:30 p.m. ET, giving you roughly three days of lag at weekly frequency.
Reading the bond market through cross-asset signals, such as gold direction, dollar momentum, and Treasury buyback operations, provides a more granular view of which cohort is actually driving positioning at any given moment, which is the layer of precision the four-condition test requires.
By September 2026, the overall basis trade had contracted significantly from earlier peaks, with hedge funds unwinding hundreds of billions in leveraged positions. Yet the fundamental bifurcation between the two cohorts persists, which tells you that positioning configurations evolve without ever resolving the underlying ambiguity.
There is a further trap. An apparent “crowded long” by asset managers may reflect benchmark duration requirements or liability hedging, not a discretionary speculative bet. Betting against it would mean betting against structural portfolio needs, not against genuine consensus conviction.
The lesson for your own decisions is precise. Before acting on any contrarian thesis, identify exactly which cohort you are trading against and whether that cohort actually drives price discovery and liquidity, not just whether your position happens to point the opposite way from some category of participant.
A practical test for whether a trade is still genuinely contrarian
You now have the mechanism. Here is the diagnostic that turns it into something you can run in real time. Work through these four conditions in order, and each one eliminates a category of false contrarian trades before you reach a position.
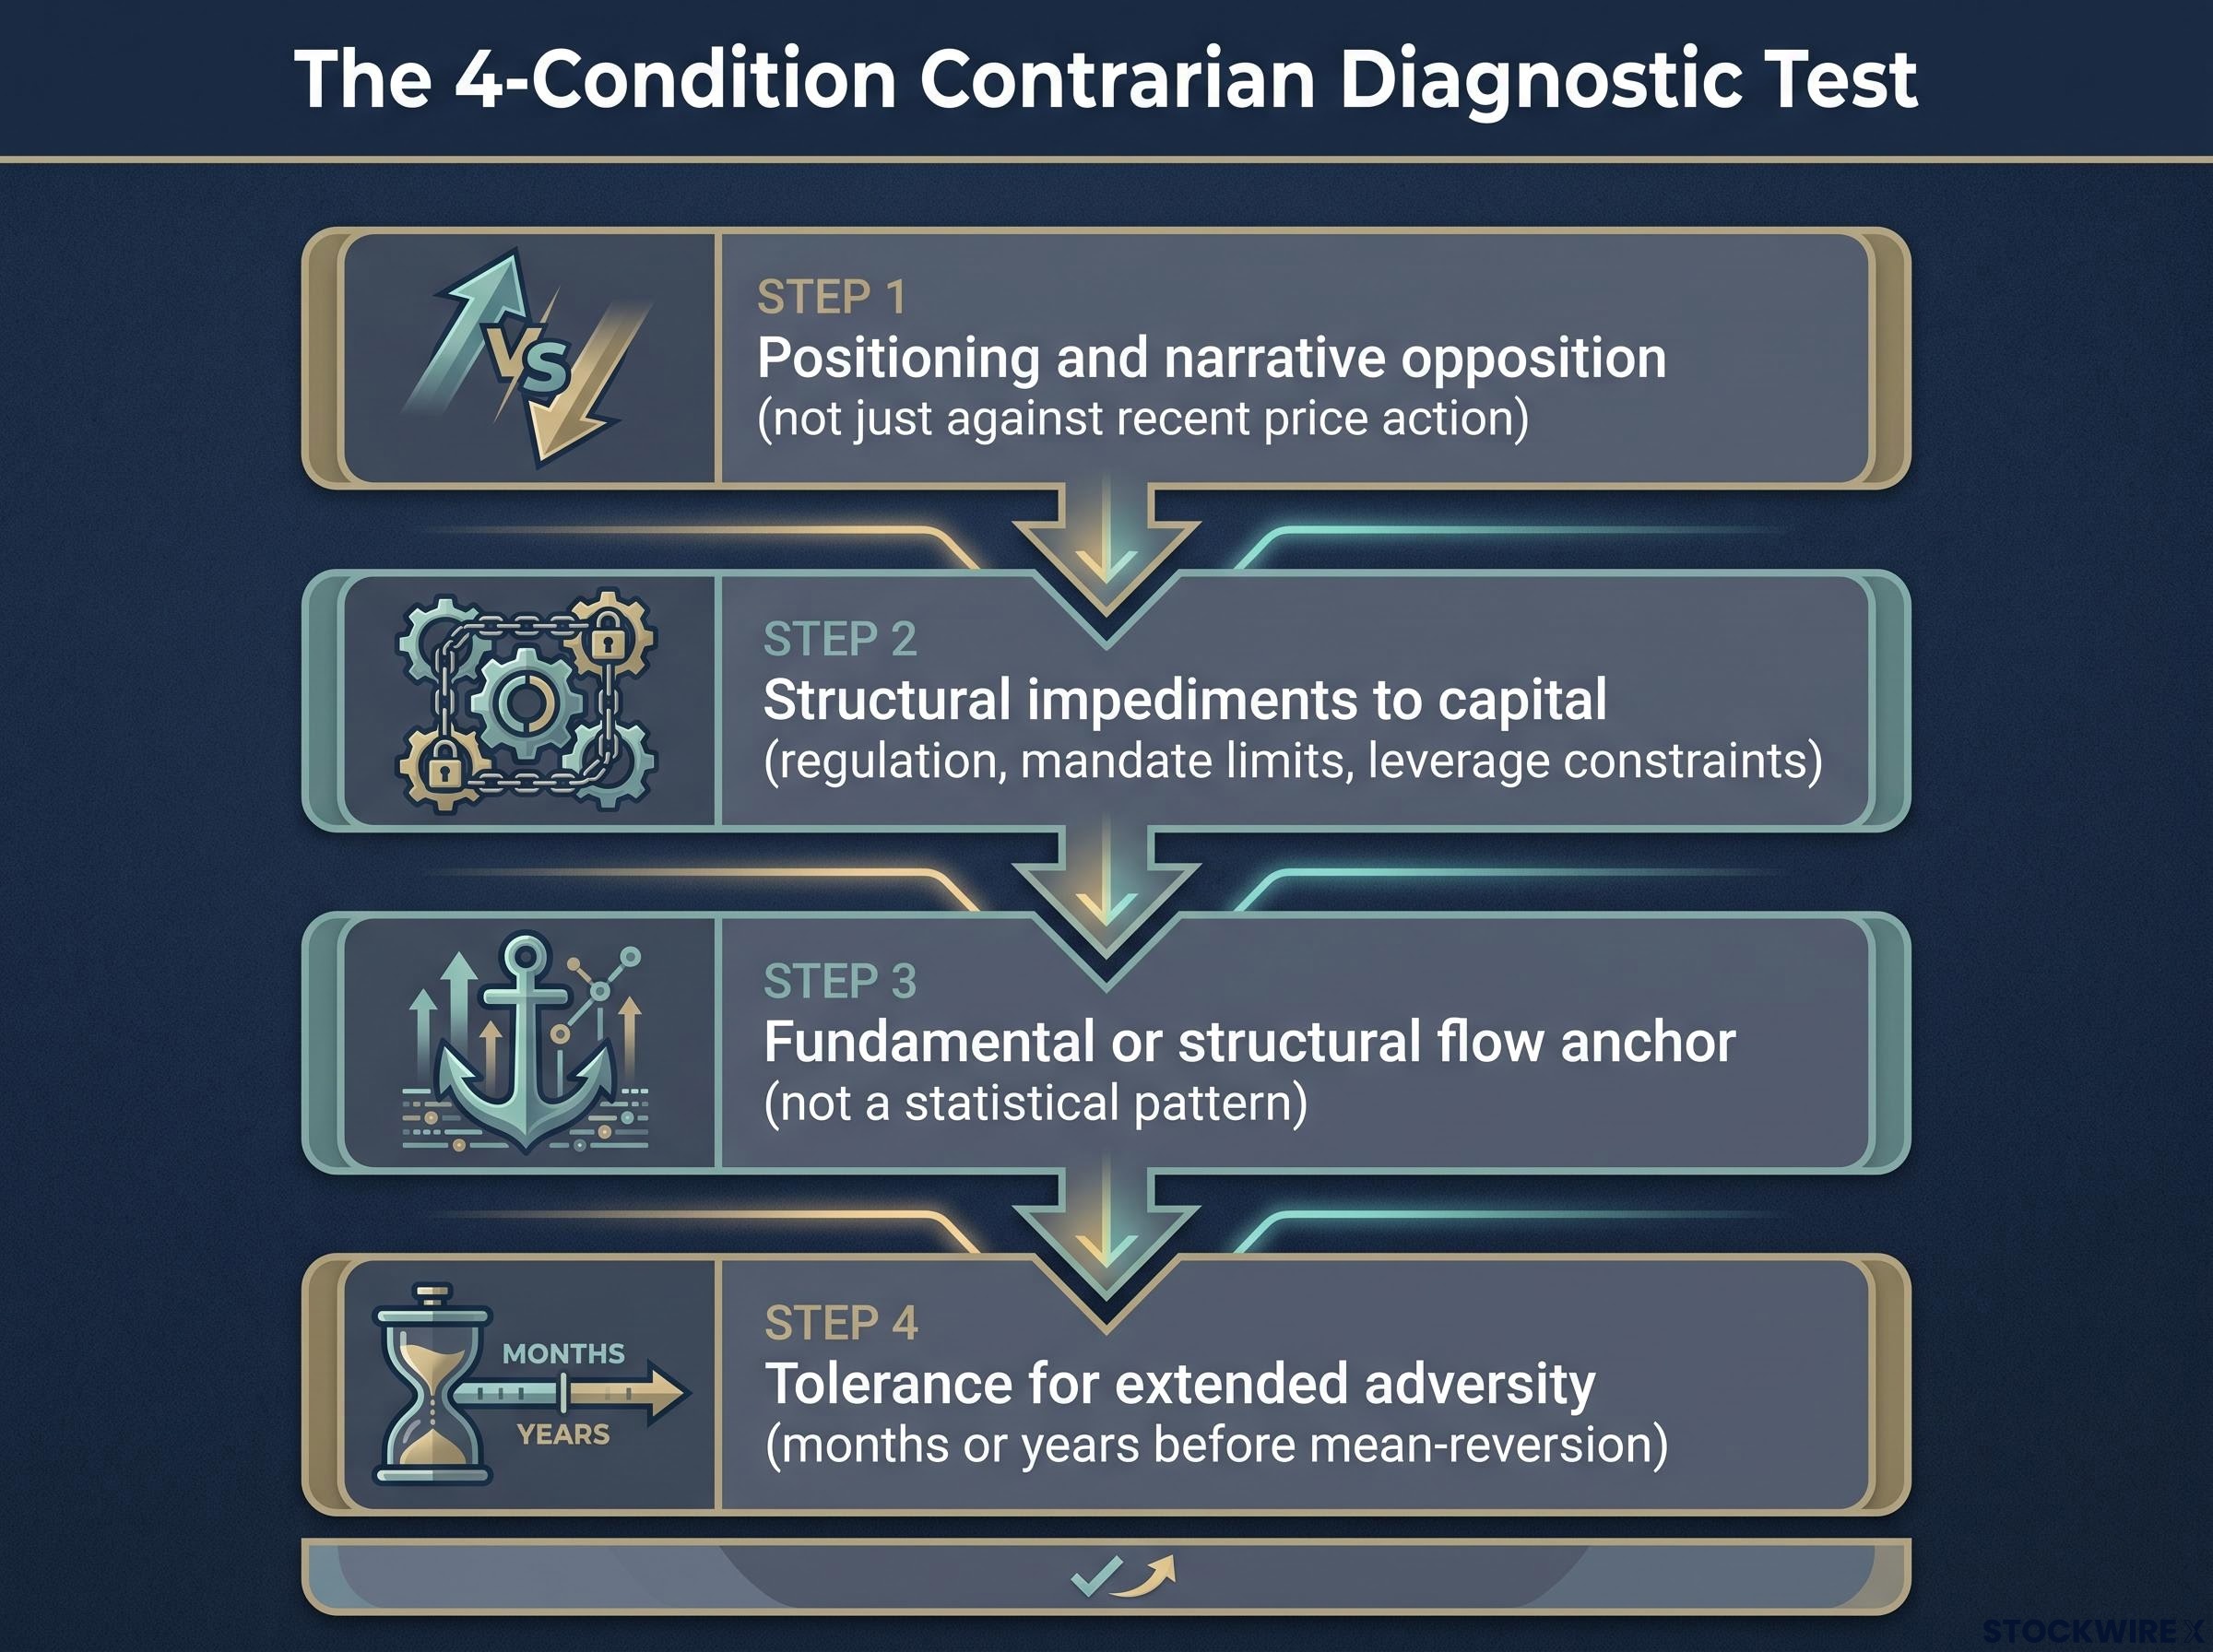
- Positioning and narrative opposition. Does the trade genuinely run against where capital and the prevailing story sit, or only against recent price action? If everyone is already calling it contrarian, it fails here.
- Structural impediments to capital. Is there a real barrier, such as regulation, mandate limits, or leverage constraints, stopping most capital from exploiting the mispricing? If the trade is easily replicable, it fails here.
- Fundamental or structural flow anchor. Is the thesis grounded in fundamentals or structural flows, or in a statistical pattern anyone can copy? A pattern-only trade fails here.
- Tolerance for extended adversity. Can you sit through months, possibly years, of the position moving against you before any mean-reversion arrives? If not, you fail here regardless of the thesis.
Notice what COT data is good for within this framework. It is a risk-management and optionality tool, not a mechanical entry signal.
Experienced traders use it to:
- Locate where forced liquidations might cluster if a crowded position unwinds.
- Identify asymmetric payoff opportunities rather than generate buy or sell triggers.
- Map the funding and liquidity vulnerabilities that make a crowded trade fragile.
Crowded positioning in AI-linked equities through mid-2026 illustrated the same paradox in a different market: the structural narrative, genuine AI capex growth, remained intact even as the positioning configuration created fragility that was independent of whether the thesis was correct.
Set your expectations against the maths. The baseline is losses in roughly 70% of cases, crowded trades can stay crowded for months or years, and when a correction does arrive it typically clears excess positioning over three to four weeks before the underlying trend resumes.
What genuine crowding actually looks like in practice
Agricultural commodities as of September 2023 show what real, fundamentally justified crowding looks like. Sugar, corn, soybeans, and soy meal drew heavy speculator accumulation, supported by a pronounced El Niño event and supply disruption from the conflict in Ukraine, a major grain exporter.
That accumulation created a genuinely asymmetric setup. Hypothetical correction scenarios pointed to declines of roughly 15-20% on an unwind, without the probability of reversal being elevated. The reward got bigger; the odds did not improve.
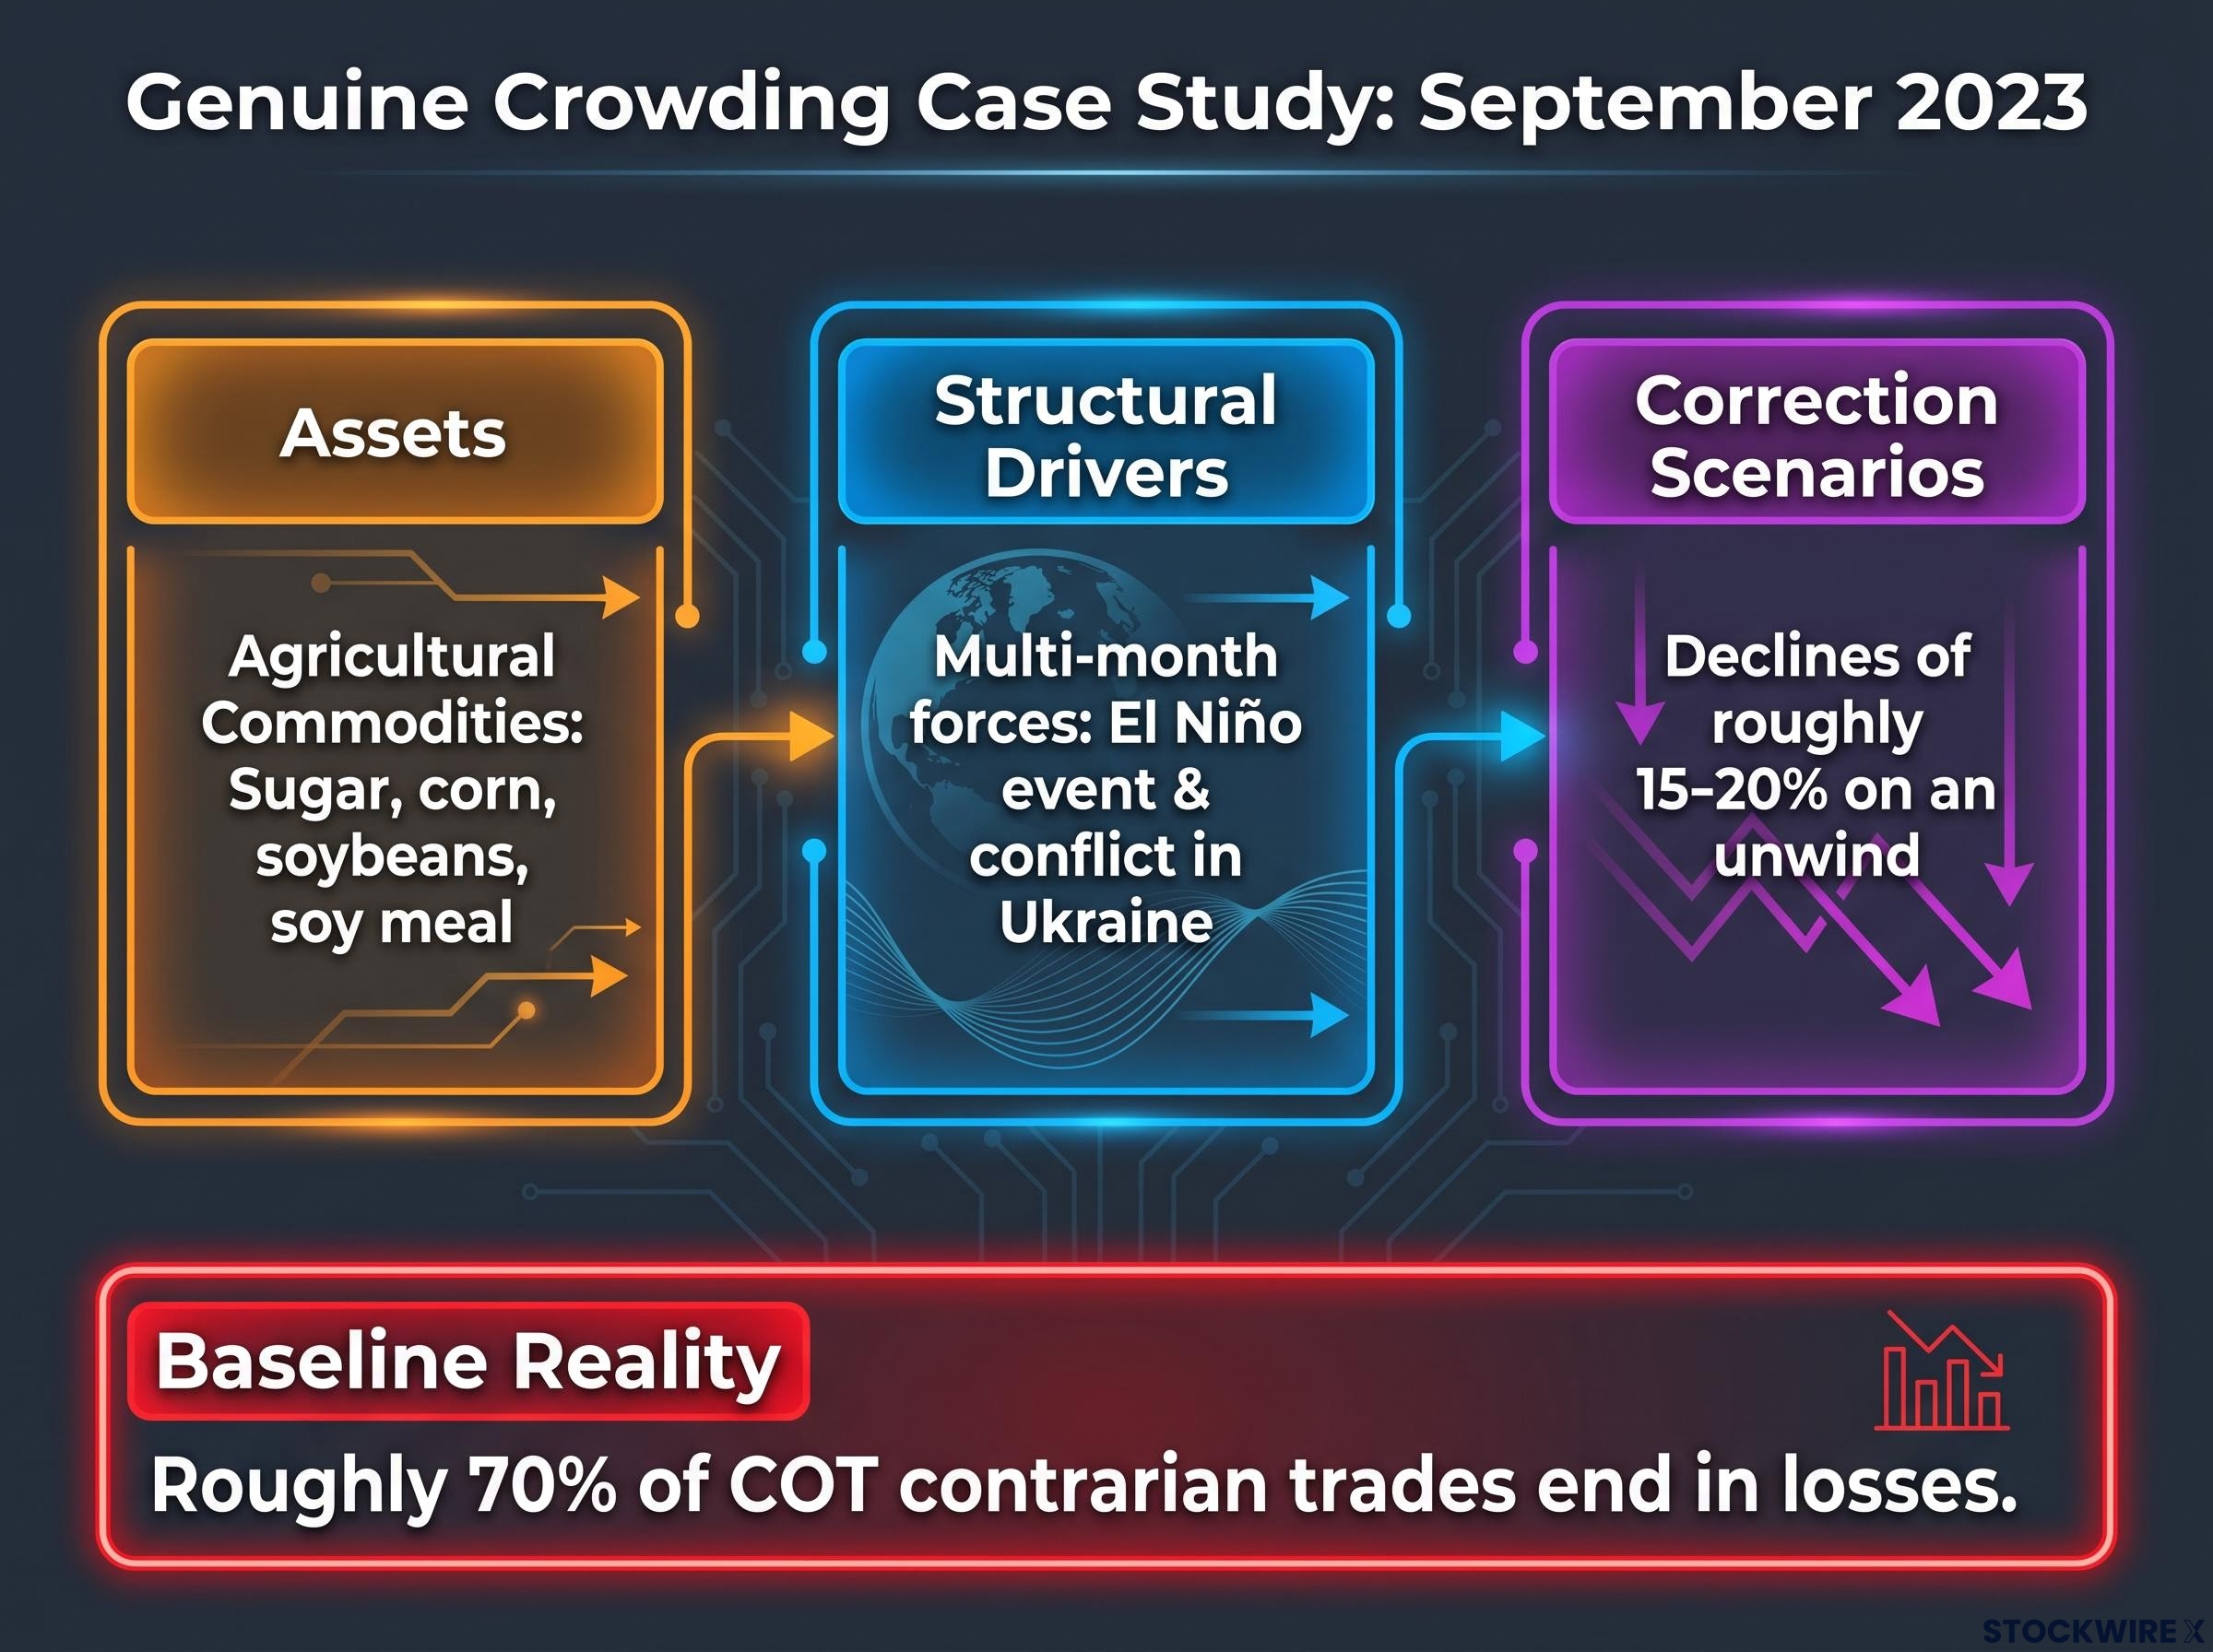
Even a correction would not have reversed the trend, because the structural drivers, El Niño and the Ukraine disruption, were multi-month forces. A pullback would clear positioning, then the trend could resume.
Contrast that with what a genuine contrarian bond entry would require: something close to widespread belief that government insolvency is inevitable, with yields likely spiking further during the capitulation event that creates the entry point. Taken together, the agricultural and bond illustrations tell you that real contrarian opportunities are rare, uncomfortable, and usually look obviously terrible at the moment of entry. That discomfort is the point, not a bug.
This article is for informational purposes only and should not be considered financial advice. Investors should conduct their own research and consult with financial professionals before making investment decisions. Past performance does not guarantee future results, and these scenarios are speculative and subject to change based on market developments.
What this framework means for every trade you call contrarian
Pull the three evidence streams together and a single idea emerges. Treasury positioning shows the same trade can be contrarian and consensus at once, calendar anomalies show that widely known patterns get discounted before you can trade them, and the COT win-rate baseline shows the edge lives in payout size, not probability.
The word “contrarian” describes a structural relationship to positioning and information. It is not a narrative frame you can apply after the fact to make a trade sound smarter.
For readers wanting to quantify the return cost of the behavioural errors that sustain false contrarian trades, our dedicated guide to investing psychology documents how loss aversion and overtrading erode returns by up to 6.5 percentage points annually, with specific research on how the mechanisms operate across different market conditions.
That leads to a disqualifying condition worth carrying with you permanently.
A trade cannot be contrarian when the majority of participants are openly calling it contrarian. The widespread naming of a position as contrarian is itself evidence that the crowding has already eliminated the edge.
So the most useful question is not “is this trade contrarian?” It is “when did it stop being contrarian, and what am I actually holding now?” Check the label first. If everyone around you is calling a trade contrarian, the positioning condition has already failed, and you are holding consensus risk with a contrarian’s expectations.