Most investors file the oil spike and the bond rout under separate headlines. They are the same story, and the US dollar is the third chapter. According to the original market report, the 10-year Treasury yield reached 5.35%, and the dollar is climbing on the same move.
The connection runs from tanker attacks in the Strait of Hormuz to the price of the euro. If you are holding long-dated bonds, paying for imported goods or carrying unhedged dollar exposure, that chain affects your money.
Brent crude is back above $100 a barrel. Long-dated yields sit at multi-decade highs, and the US Dollar Index (DXY), which measures the dollar against six major currencies, trades near 102.35, close to its highest since April 2025.
This analysis follows the chain from oil to yields to the euro. That lets you judge how durable the dollar’s move is and which signals would tell you it is fading.
Why did oil and Treasury supply push the 10-year yield to 5.35%?
The yield spike did not come from a single shock. Three forces built on each other: war-driven oil, inflation fears and a heavy calendar of government borrowing.
The oil shock
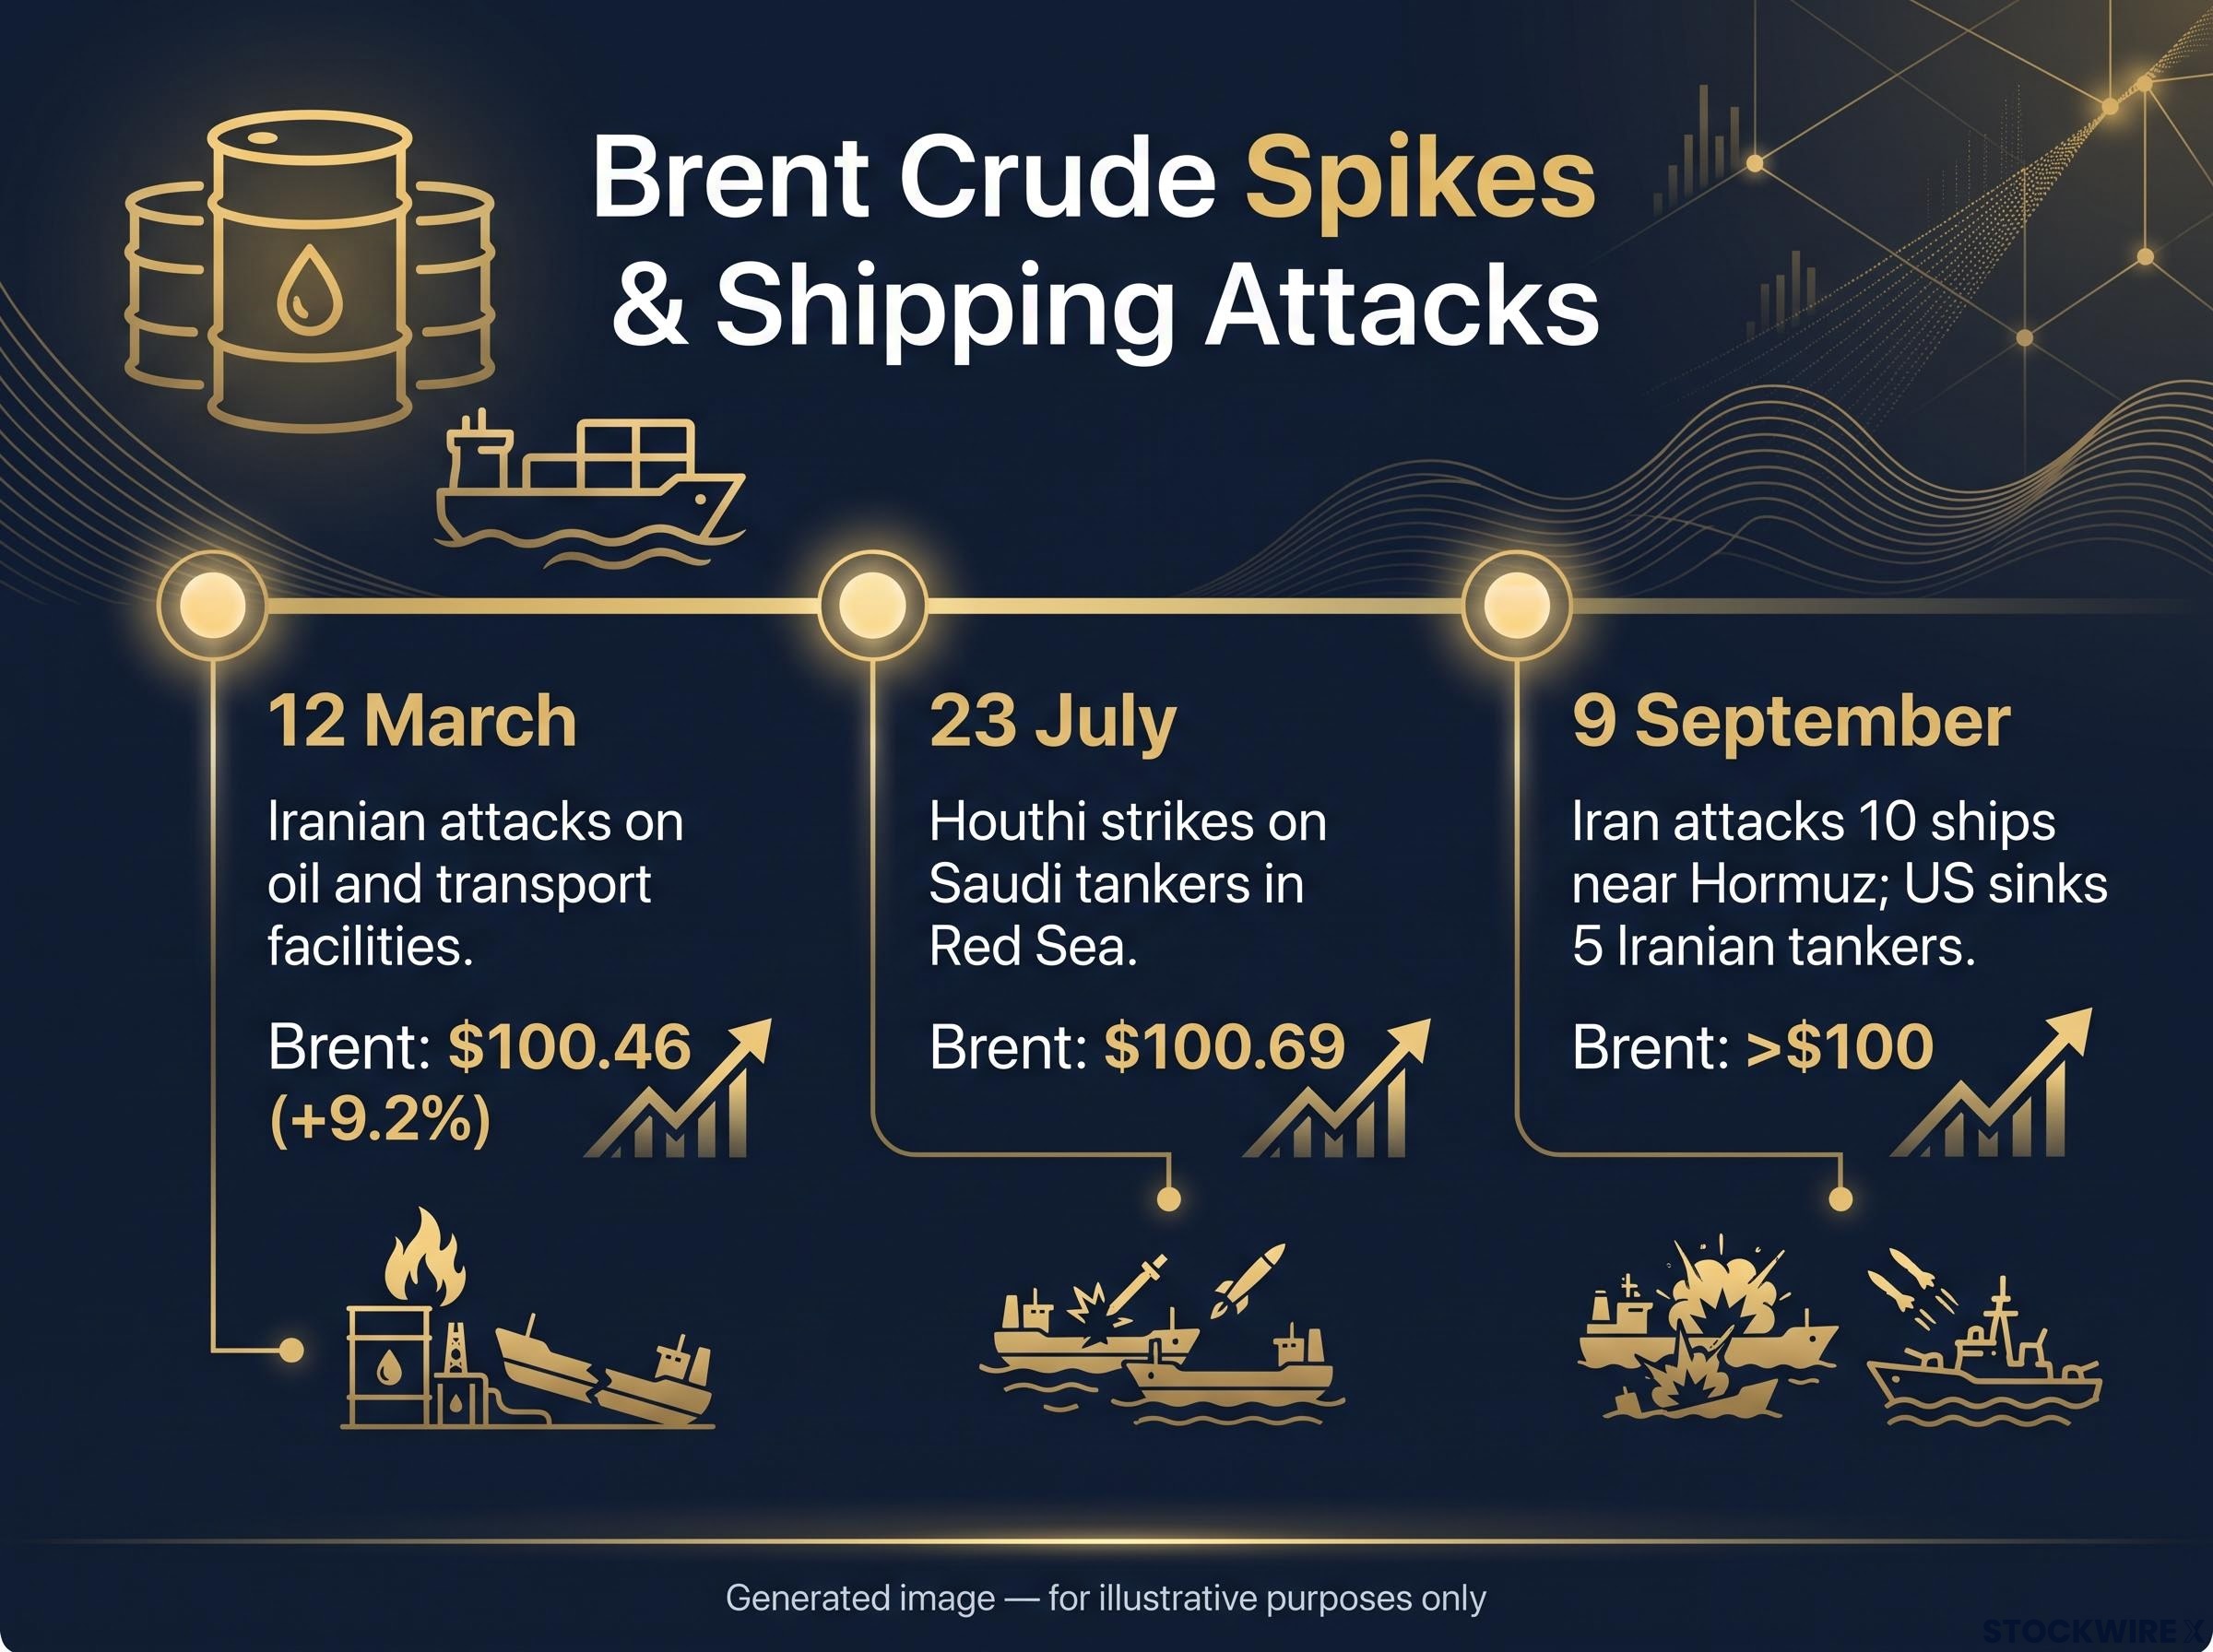
The first force came from the Gulf. Brent settled at $100.46 on 12 March, up 9.2% in a session, as Iranian attacks on oil and transport facilities intensified. It returned to $100.69 on 23 July after Houthi strikes on Saudi tankers in the Red Sea.
On 9 September, Brent closed above $100 again. Iran said it had attacked 10 ships near Hormuz, and the US sank five Iranian tankers. It was the largest exchange of shipping attacks since the war began six months earlier.
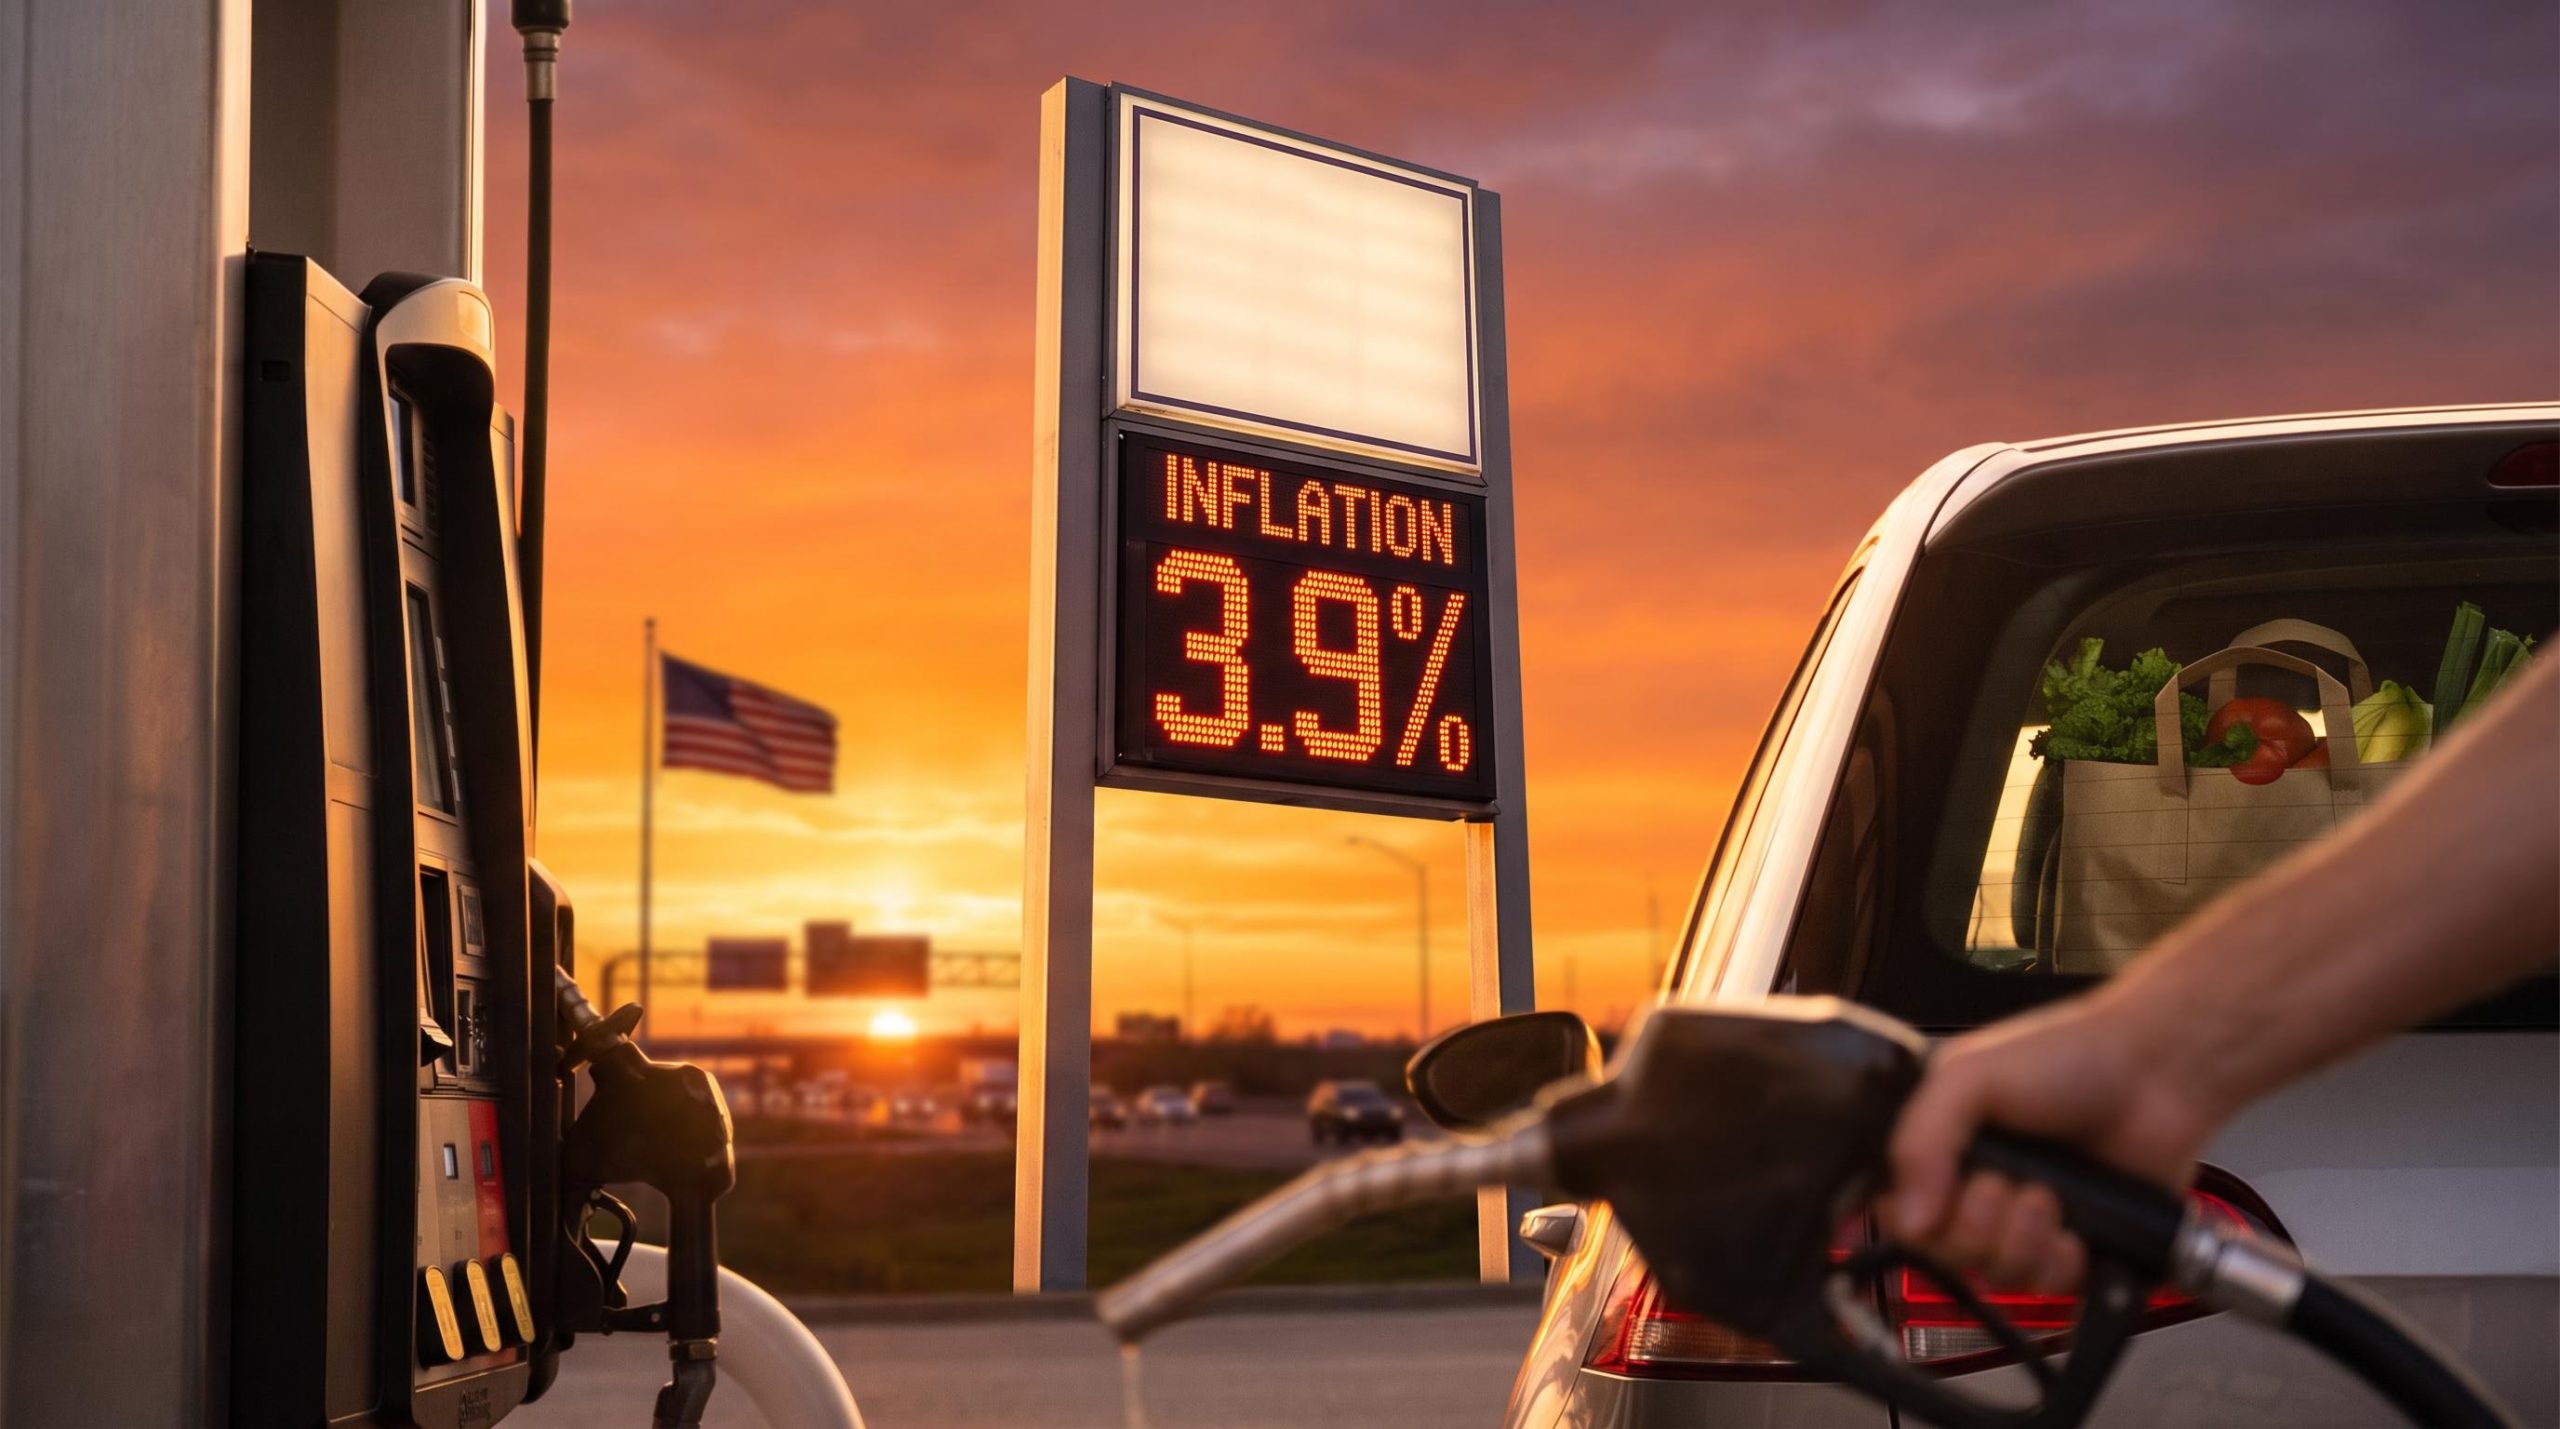
Costlier oil feeds through to inflation. Inflation erodes the fixed payments a bond makes, so investors demand a higher yield to hold one.
Because a bond’s coupon is fixed, any drop in its price lifts the yield, which is why inflation fears from costlier oil push bond yields higher almost mechanically as investors demand more compensation.
The supply squeeze
The second force was supply. Investors sold Treasuries ahead of a $39 billion 10-year note auction, with new 30-year bonds and a buyback of older debt scheduled for the following day. No auction results, such as the bid-to-cover ratio, were available at the time of writing.
The Treasury has used buybacks before. After it announced expanded buybacks on 19 August, long-dated yields fell by up to 10 basis points (a basis point is one-hundredth of a percentage point).
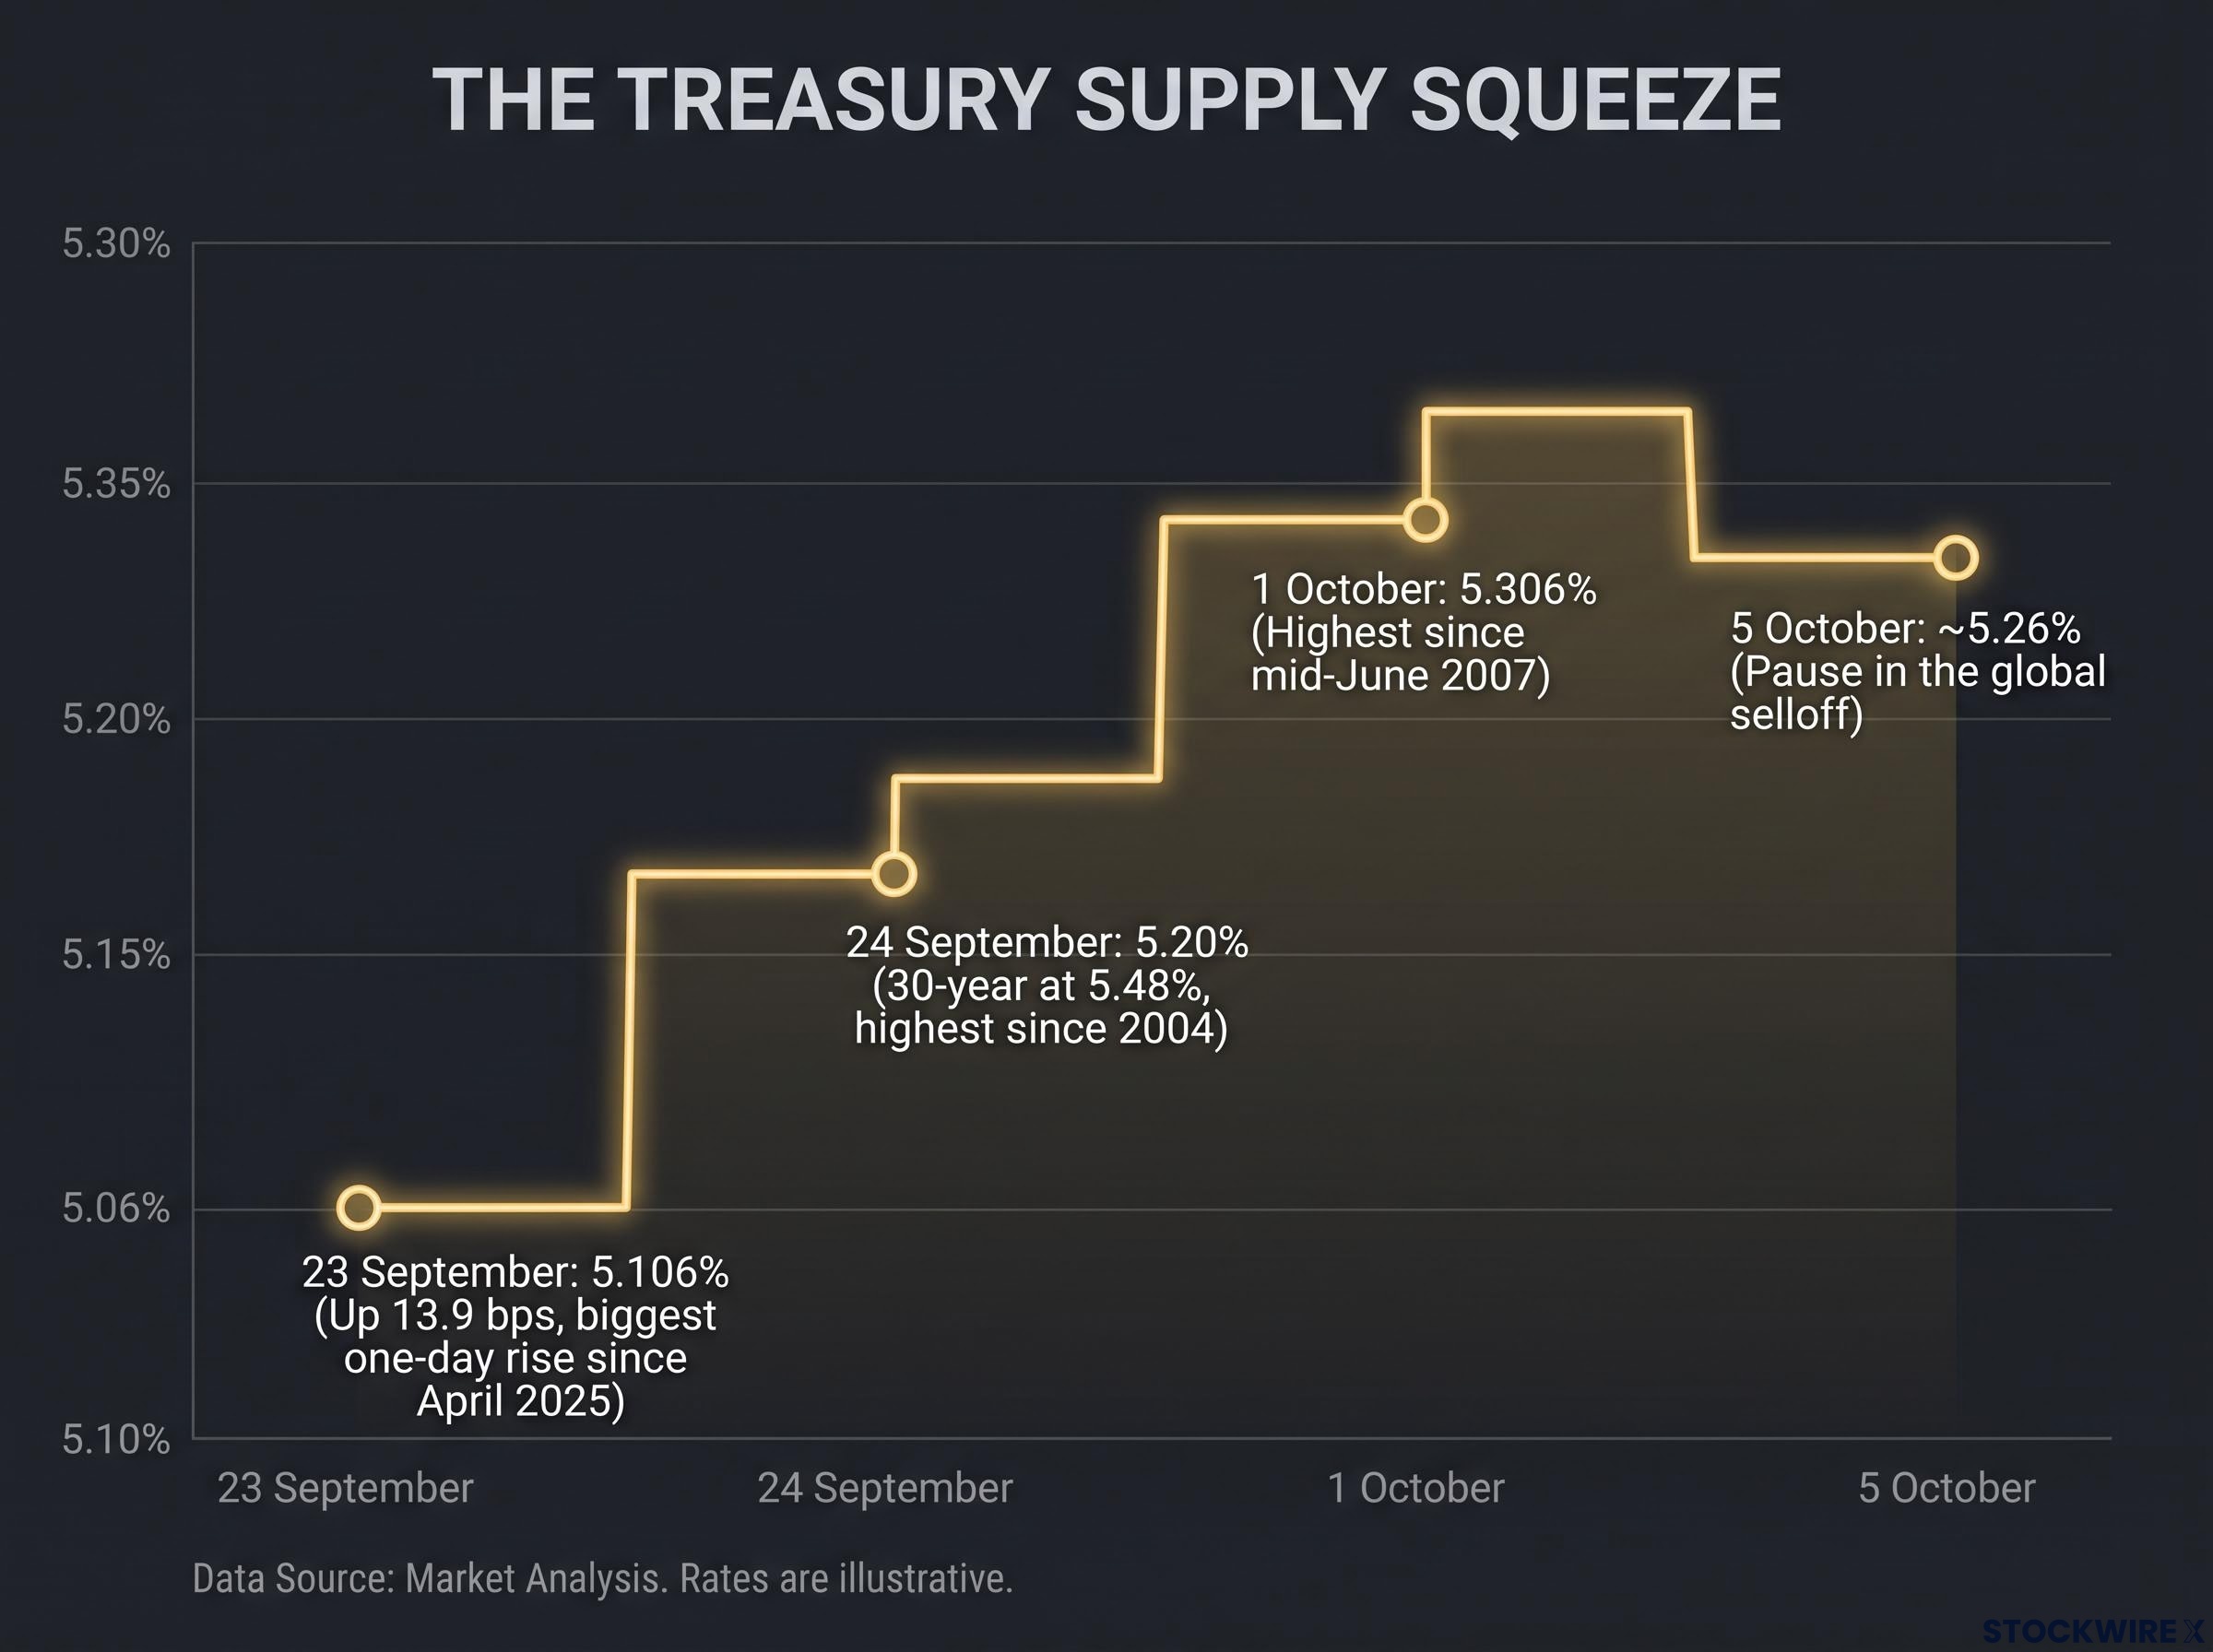
| Date | 10-year yield | Context |
|---|---|---|
| 23 September | 5.106% | Up 13.9 bps, the biggest one-day rise since April 2025 |
| 24 September | 5.20% | 30-year at 5.48%, its highest since 2004 |
| 1 October | 5.306% | Highest since mid-June 2007 (Reuters) |
| 5 October | About 5.26% | Pause in the global selloff |
The exact peak is disputed, and the gap matters.
A peak in dispute The original source puts the 10-year at 5.35%, the highest since April 2002. Wire reporting puts the high nearer 5.306%, the highest since mid-June 2007.
Whichever figure holds, oil and debt supply are pushing yields in the same direction. When two forces line up like that, the move is harder to reverse, and your borrowing costs, from mortgages to corporate debt, may stay elevated.
When big ASX news breaks, our subscribers know first
How do high US yields translate into a stronger dollar index?
The link between yields and the dollar is mechanical. To earn a US yield, a foreign investor first has to buy dollars, and every one of those purchases supports the currency.
The yield gap and the euro
The US 10-year now pays more than 1.8 percentage points above Germany’s 10-year, which sits near 3.5%. That gap is the incentive driving the trade.
Europe has helped widen it. According to the original source, investors sold French government debt and bought German bonds as a safer option, which held German yields steady while US yields kept rising. No quantified French-German spread was available to measure the scale of that rotation.
This is where the index’s design matters.
The euro’s weight The euro makes up about 57.6% of the DXY and accounts for roughly three-quarters of its recent advance.
The euro fell to $1.1384 on 23 September and held at $1.1321 on 1 October, after a 2.5% drop the previous month. The DXY is largely a euro trade in disguise. European bond flows therefore matter as much to your dollar exposure as any US jobs report.
The technical setup near 102.35
The index has posted three straight weekly gains from a 9 September low near 98.60. The levels traders are watching:
- Resistance at 102.50: touched twice, the point where Monday’s rally stalled
- Recent support near 101.75: Tuesday’s dip, erased on Wednesday
- 50-day EMA near 100.50 and rising: an average of recent closing prices that gives more weight to recent days
Technical levels give you context, not a prediction. A clean break above 102.50 would show buyers still in control. A slide back toward the moving average would suggest the yield story is losing its grip.
How does Fed policy drive the dollar, and where do rates, QE and QT fit?
Yields and spreads explain the current move. The Federal Reserve decides how long it can last, and you only need to understand three levers to follow its role.
The Fed has two goals: price stability, defined as 2% inflation, and full employment. Its main tool is the interest rate. When the Fed raises rates, holding dollars pays more, which usually supports the currency. When it cuts rates, the opposite tends to happen.
The other two levers work through the Fed’s balance sheet. Quantitative easing (QE) means the Fed creates dollars to buy bonds, and it was used in crises such as 2008. Quantitative tightening (QT) means the Fed stops those purchases and lets maturing bonds roll off without reinvesting the money.
| Policy lever | What it does | Typical USD effect |
|---|---|---|
| Rate hike | Raises the return on holding dollars | Supportive |
| Rate cut | Lowers the return on holding dollars | Weighs on the dollar |
| QE | Creates dollars to buy bonds | Usually negative |
| QT | Ends purchases and stops reinvestment | Usually positive |
These levers carry global weight because the dollar sits at the centre of currency markets. It accounts for more than 88% of global FX turnover, about $6.6 trillion a day according to 2022 data. It replaced sterling as the main reserve currency after the Second World War and was backed by gold until the Bretton Woods system ended in 1971.
Now apply the framework. On 16 September, the Fed raised its target range by 25 basis points to 3.75-4.00% and set interest on reserve balances at 3.90%, effective 17 September. It announced no change to the pace of QT, and detailed QT parameters were not available.
The Fed policy tools of rates, QE and QT now point the same way, with a hike in September and a balance sheet still shrinking, which is why the central bank’s response matters more than oil itself.
The dollar barely reacted. It had already reached a seven-week high, then paused as Treasury yields eased. The lesson for you is that oil does not set the dollar’s level by itself. The Fed’s response to oil-driven inflation determines how much support the currency gets.
What could reverse the dollar’s rise, and what does history suggest?
The case for further dollar strength is straightforward. Reuters noted on 24 September that higher Treasury returns tend to make dollar assets more attractive, and on 1 October the dollar held firm even as yields slipped from their peak.
The sceptical view focuses on debt. When high yields come with anxiety about the US fiscal path, they can erode the dollar’s safe-haven status instead of reinforcing it.
Some analysts read rising Treasury yields as a fiscal risk premium rather than an opportunity, which helps explain why the dollar failed to rally in early September despite a wide yield advantage over the euro area.
The 19 August session showed how quickly that can happen.
When the link broke On 19 August, the DXY fell 0.84% to 98.80 as long-dated yields dropped. The euro rose 0.88% to $1.1676, and gold and cryptocurrencies jumped on unease over the US debt trajectory.
Three triggers could produce another session like that:
- Easing tensions around Hormuz, with attacks abating and shipping returning to normal
- A Fed signal of slower hikes or an earlier end to QT
- Further Treasury buybacks that ease long-dated supply
A strong dollar also has costs. It squeezes European exporters, tightens financing conditions for emerging markets and compresses equity valuations. Stocks fell on 23 September, although the Nasdaq had climbed back to records by early October.
History offers a pattern, not a forecast:
- 2013 taper tantrum: yields and the dollar spiked before clearer Fed communication calmed markets
- 2018 tightening and QT: the dollar rose, stressing Turkey and Argentina ahead of a late-year equity selloff
- 2022-2023 energy shock: rapid Fed hikes pushed the dollar to multi-decade highs as European and emerging-market currencies weakened
In each episode, the dollar strengthened first and then turned quickly. A rally resting on oil and yields is only as stable as those two inputs, so track both before you adjust your exposure.
Past performance does not guarantee future results. Any forward-looking views are speculative and subject to change based on market developments.
What the dollar’s yield support does, and does not, guarantee
The chain is now clear. Oil, inflation fears and heavy Treasury supply have pushed yields higher. The US-German yield gap and the euro’s dominant weight carry that move into the DXY, and the Fed’s response will decide how long it lasts.
Three variables deserve your attention:
- Brent holding above $100
- The US-German 10-year spread, currently above 1.8 percentage points
- The DXY’s 102.50 resistance level
The situation is still developing, and some figures, especially the 5.35% peak, may be revised as more reporting emerges. The trend has support for now. Your decision rests on whether its two pillars, oil and yields, keep holding.
This article is for informational purposes only and should not be considered financial advice. Investors should conduct their own research and consult with financial professionals before making investment decisions.