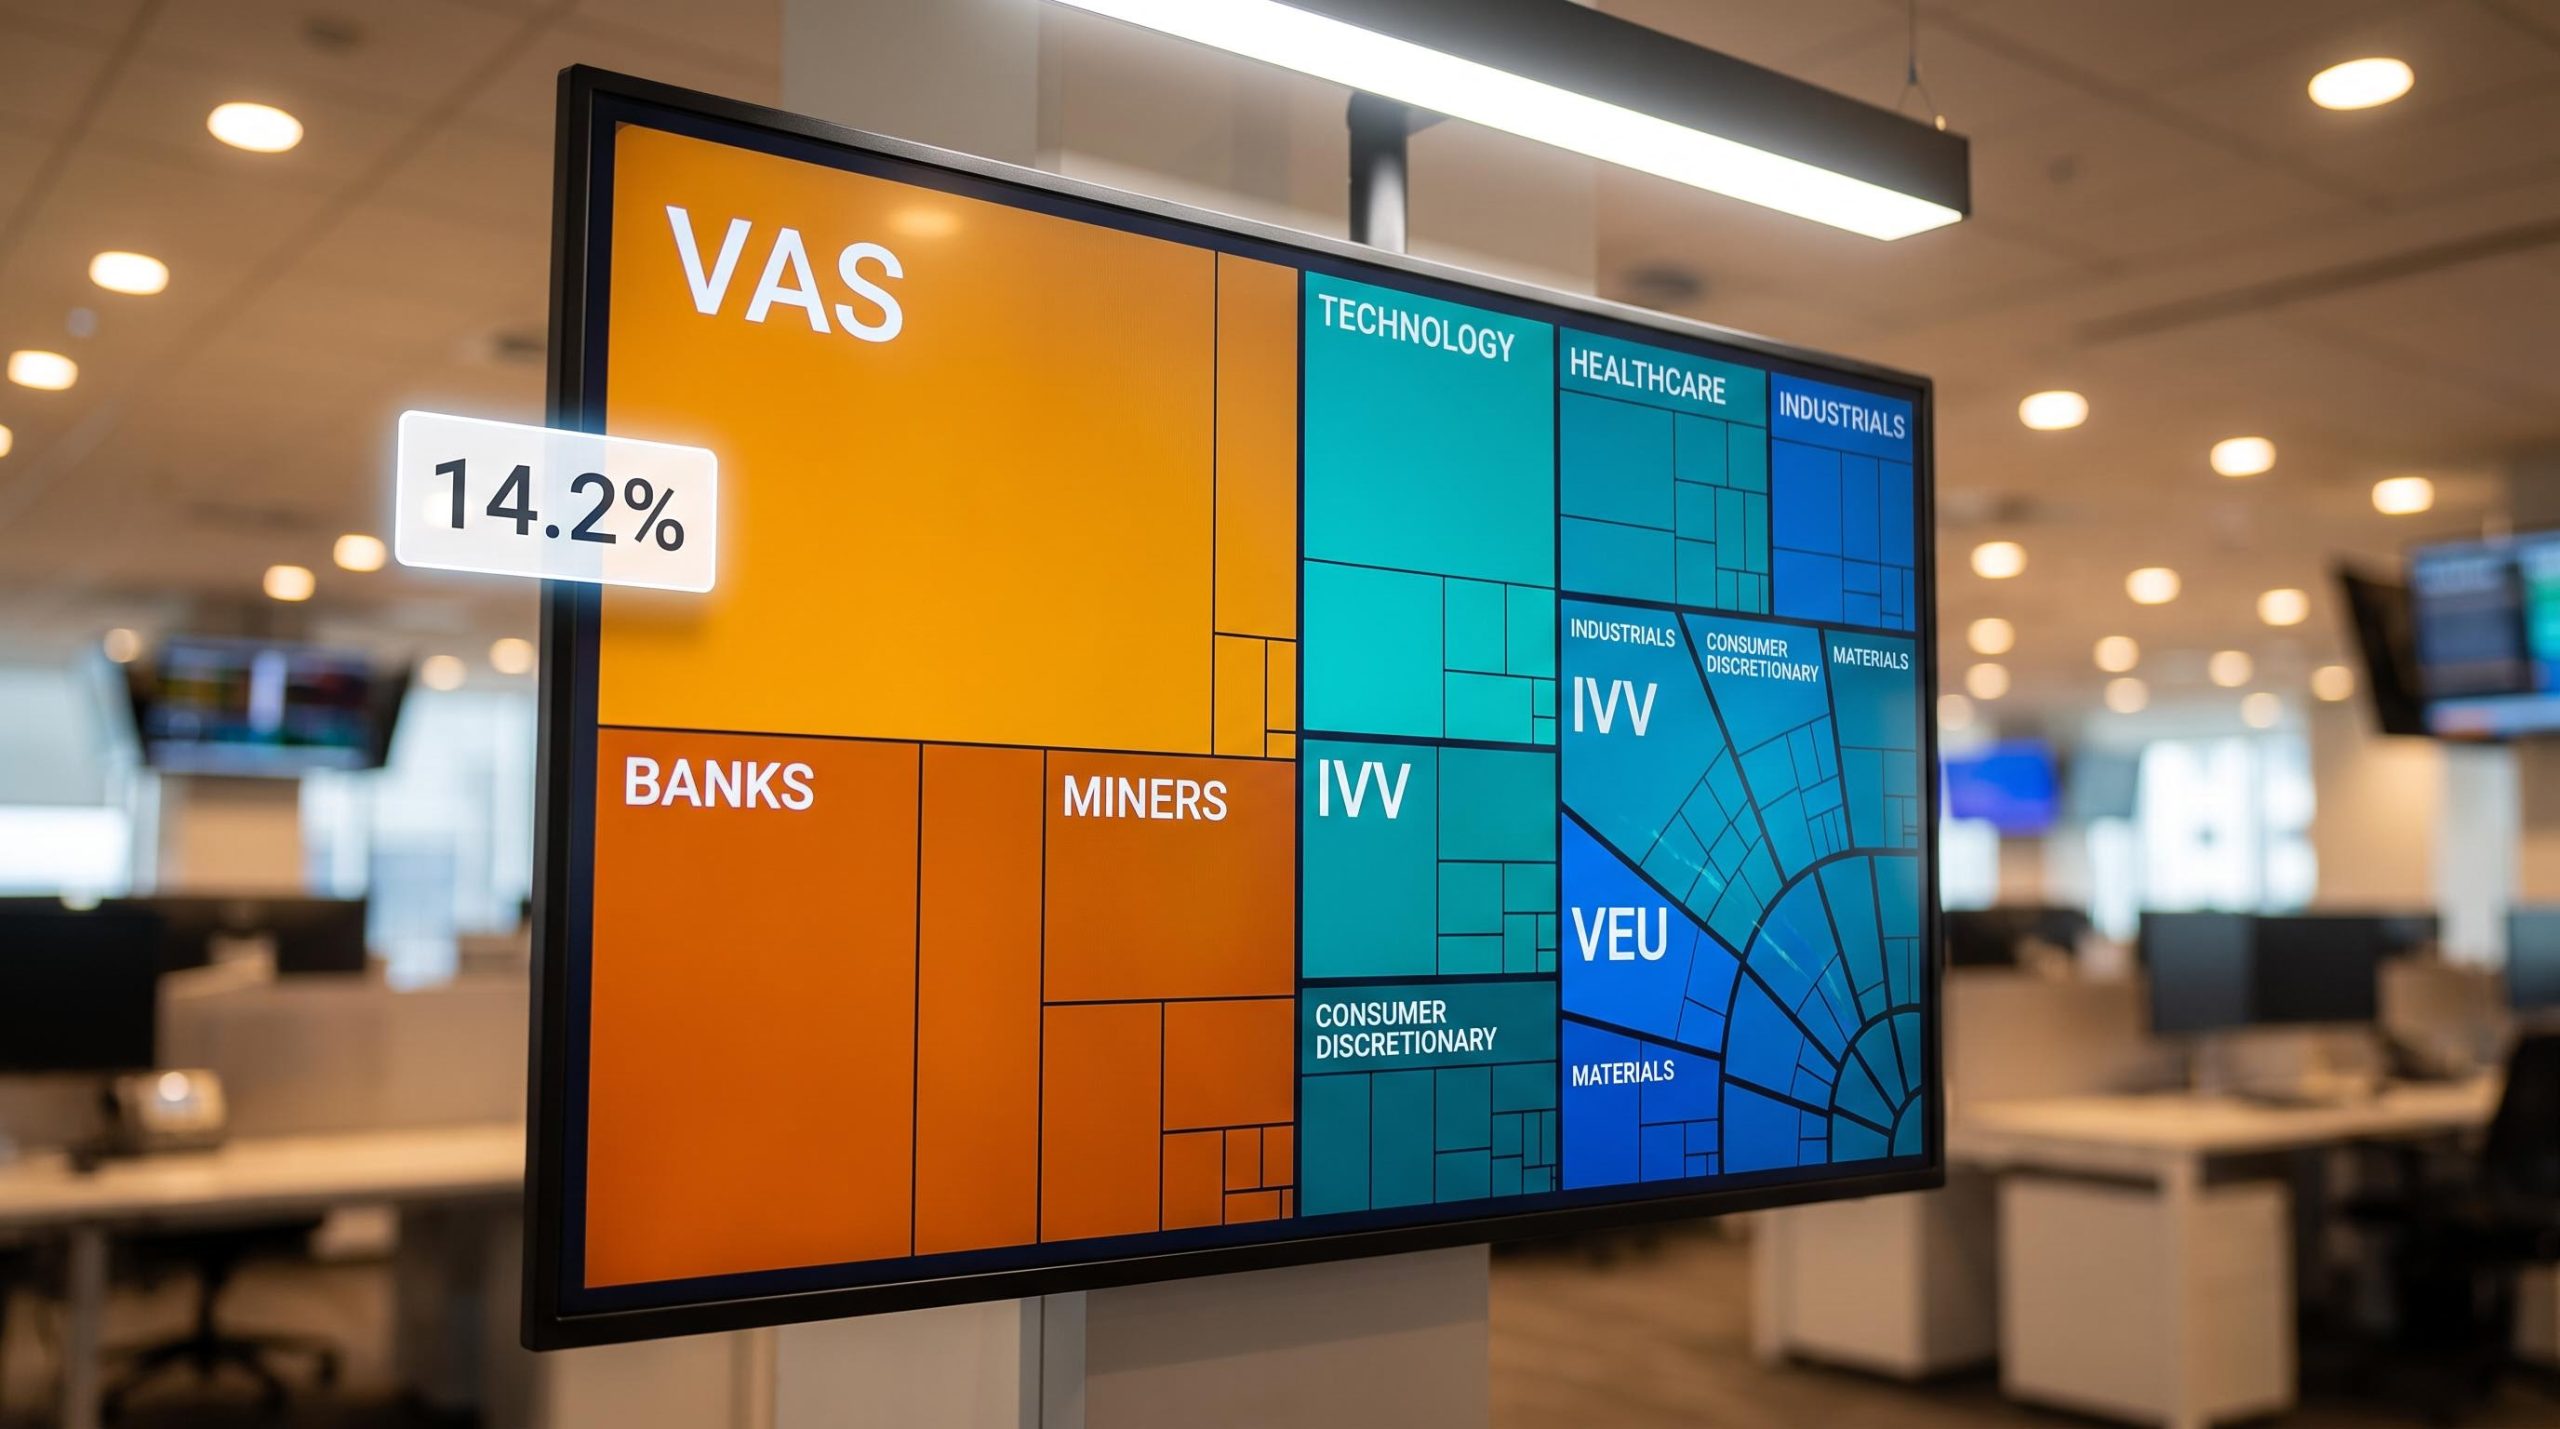
Most Australian investors who believe they hold a diversified portfolio are, in fact, heavily concentrated in two things: banks and miners. If your holdings are built around VAS, the Vanguard Australian Shares Index ETF, you own a slice of roughly 300 companies, and the largest slices belong to a handful of financials and resource giants.
Heading into 2027, that concentration matters more than it did a few years ago. Elevated uncertainty around US technology valuations, an uncertain direction for the Australian dollar, and interest rate plateaus mean the geographic balance of your portfolio now carries real consequences for your returns and your risk.
Here is what each of six widely held ASX ETFs actually does for your portfolio, and how to decide what mix suits your situation. This is a practical framework for combining VAS, IVV, and VEU as a low-cost core with quality-oriented satellites like QUAL, MOAT, and CFLO, and for weighing the cost trade-offs that come with each decision.
Why your “diversified” ASX portfolio may be less diversified than you think
Buying a broad Australian index ETF feels like diversification. You are, after all, holding hundreds of companies in a single trade. The problem is what those companies do.
VAS tracks the S&P/ASX 300 Index, and that index is structurally lopsided. It leans heavily into financials and resources, which means a portfolio anchored to it inherits that same tilt whether you intended it or not.
This is not a passing phase you can wait out. It is a permanent feature of the Australian market, which is dominated by a small number of very large banks and mining companies. No amount of clever ASX stock picking changes the underlying shape of the index.
Here is how the ASX 300 compares to a broad global index in terms of sector exposure:
- Overweight: financials (the major banks) and resources (iron ore, lithium, and energy miners)
- Underweight: global technology, where most of the past decade’s equity growth has originated
- Underweight: healthcare, particularly the large pharmaceutical and medical-device names listed overseas
- Thin: exposure to consumer technology, semiconductors, and global industrials
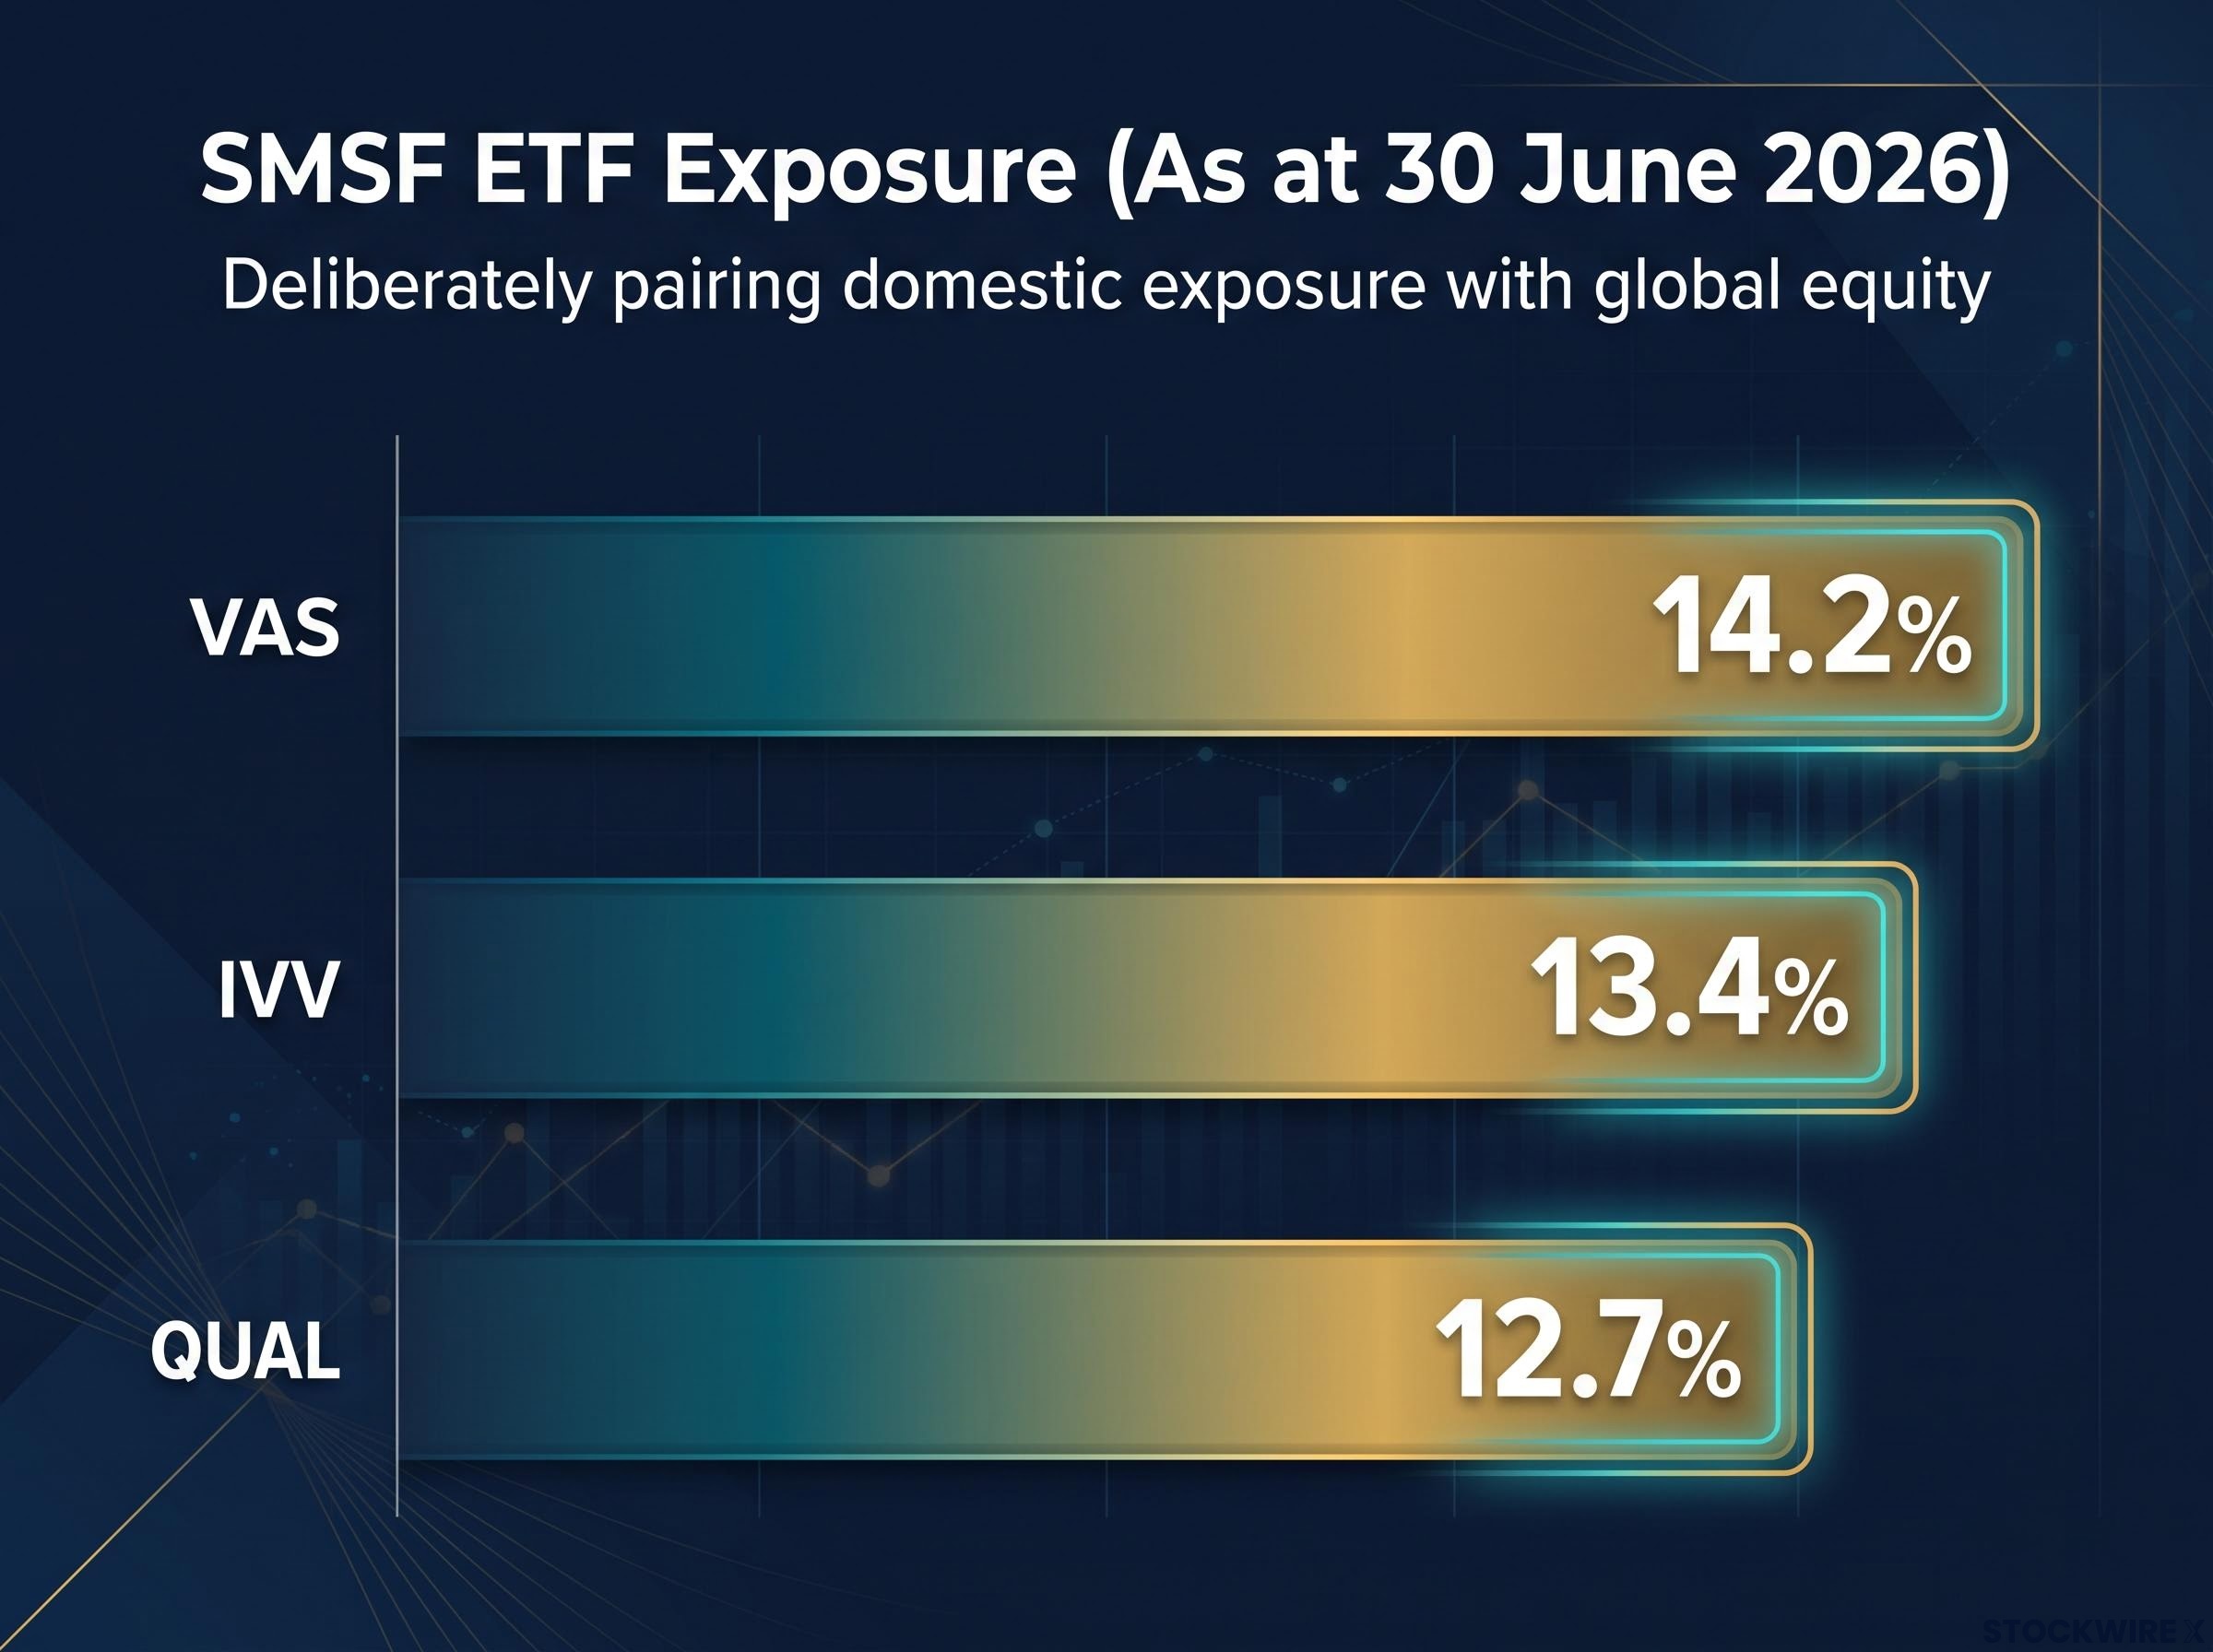
The evidence that experienced investors already treat this as a problem sits in the self-managed super fund (SMSF) data. As at 30 June 2026, VAS was held by 14.2% of SMSFs with ETF exposure, but IVV followed at 13.4% and QUAL at 12.7%. Sophisticated self-directed investors are not holding domestic exposure alone. They are deliberately pairing it with global equity.
The ATO’s SMSF quarterly statistical report for June 2026 confirms the broader shift underway, with listed shares representing 26% of total estimated SMSF assets, underscoring how strongly self-directed investors are leaning into equity markets as a core wealth-building vehicle.
What home bias actually costs you
Home bias is not simply a comfort preference. It is an active allocation choice with a measurable opportunity cost.
The clearest cost is missed sector exposure. Technology and healthcare have driven a substantial share of global equity returns over the past decade, and the ASX gives you very little of either. Every dollar overweight to Australia is a dollar not participating in those sectors.
There is a second cost that is easy to overlook: volatility. Many advisers flag that home bias amplifies the cyclical swings tied to commodity prices, the domestic housing market, and Reserve Bank of Australia policy. If your portfolio is built around VAS or individual ASX stocks, you are not diversified globally. You are concentrated domestically, and that single distinction is what should drive every decision that follows.
The home bias return cost is measurable and persistent: over the decade to June 2025, the ASX delivered 11.1% annually against the S&P 500’s 15.5%, and Morningstar’s analysis confirms that franking credits alone do not close that gap for growth-oriented investors.
When big ASX news breaks, our subscribers know first
The six ETFs explained: what each one actually does for your portfolio
No single ETF does the full job. Once you see what each of these six products is actually built to do, the case for combining them becomes obvious.
The first thing to understand is the split between two categories. Market-beta ETFs aim to track a whole market at the lowest possible cost. Factor-tilt satellites apply screens that deliberately narrow the holdings in exchange for a specific characteristic.
Market-beta core vs. factor-tilt satellite: why the distinction matters
A market-beta ETF holds the full index. You get the market’s return, minus a very small fee, with no attempt to outsmart it. VAS, IVV, and VEU all work this way.
A factor-tilt satellite does something different. It filters the universe down to companies that share a trait, high quality, a durable competitive advantage, or strong free cash flow, and holds only those. QUAL, MOAT, and CFLO are built on this logic.
Neither approach is better in isolation. The market-beta ETFs give you cheap, broad coverage; the factor satellites give you a targeted bet on a characteristic outperforming over time. Which matters more depends entirely on the role you want each to play, and that means the fee and strategy differences below are not details to skim past. They determine how much weight you should give each holding and exactly what you are paying for.
| ETF Ticker | Index/Strategy | Geographic Focus | Role in Portfolio | Management Fee |
|---|---|---|---|---|
| VAS | S&P/ASX 300 (approx. 300 securities) | Australia | Domestic core (market-beta) | 0.07% p.a. |
| IVV | S&P 500 (approx. 500 companies) | United States | US core (market-beta) | 0.04% p.a. |
| VEU | FTSE All-World ex-US Index | Global ex-US (developed + emerging) | Rest-of-world core (market-beta) | 0.04% p.a. |
| QUAL | MSCI World ex-Australia Quality Index | Global developed ex-Australia | Quality-factor satellite | 0.40% p.a. |
| MOAT | Morningstar Wide Moat methodology | United States | Competitive-advantage satellite | 0.49% p.a. |
| CFLO | Top 200 global (ex-Australia) by free cash flow | Global ex-Australia | Cash-flow-factor satellite | 0.40% p.a. |
VAS holds around 300 ASX-listed securities and had funds under management (FUM) of roughly $26.886 billion as at 31 August 2026. IVV tracks the S&P 500 with FUM of approximately $14.74 billion as at 23 September 2026. Both are among the largest and most liquid equity ETFs on the ASX, which keeps spreads tight when you buy or rebalance.
VEU is the one many investors miss. It tracks the FTSE All-World ex-US Index, covering Europe, Asia, and emerging markets. It fills the gap between VAS (Australia) and IVV (the US), so together the three cover almost the entire global equity opportunity set.
The three satellites each screen for a different trait. QUAL selects for high return on equity, stable earnings growth, and low financial leverage. MOAT applies Morningstar’s wide-moat research to US companies with durable competitive advantages and attractive valuations. CFLO targets the top 200 global companies by free cash flow generation and efficiency. Confuse any of these with the beta core, and you risk paying factor fees for exposure you could get for a tenth of the cost.
Quality factor screening selects for high return on equity, consistent earnings growth, and low financial leverage, which means QUAL’s portfolio ends up systematically tilted toward technology and healthcare, the two sectors most underrepresented in a domestic ASX holding.
How to build a core-satellite portfolio with these six ETFs
The structure that ties these six together is straightforward. You build a large, low-cost core from broad-index ETFs, then add a smaller satellite allocation to the factor products for a specific enhancement.
Think of the core as three distinct geographic building blocks, each doing a job the others cannot:
- Domestic core via VAS gives you Australian large and mid-cap exposure plus franking credit access.
- US core via IVV adds the technology, healthcare, and consumer sectors that the ASX barely offers.
- Global ex-US core via VEU covers Europe, Asia, and emerging markets, reducing your reliance on any single country.
- Factor satellite via one or more of QUAL, MOAT, or CFLO overlays a quality, moat, or cash-flow tilt on top of the core.
The cost dynamics drive the sizing decision, and they are stark.
The central cost trade-off Core ETFs (VAS, IVV, VEU) charge 0.04-0.07% p.a. Satellite ETFs (QUAL, MOAT, CFLO) charge 0.40-0.49% p.a. A larger core weight keeps your blended portfolio cost low; a larger satellite weight raises it.
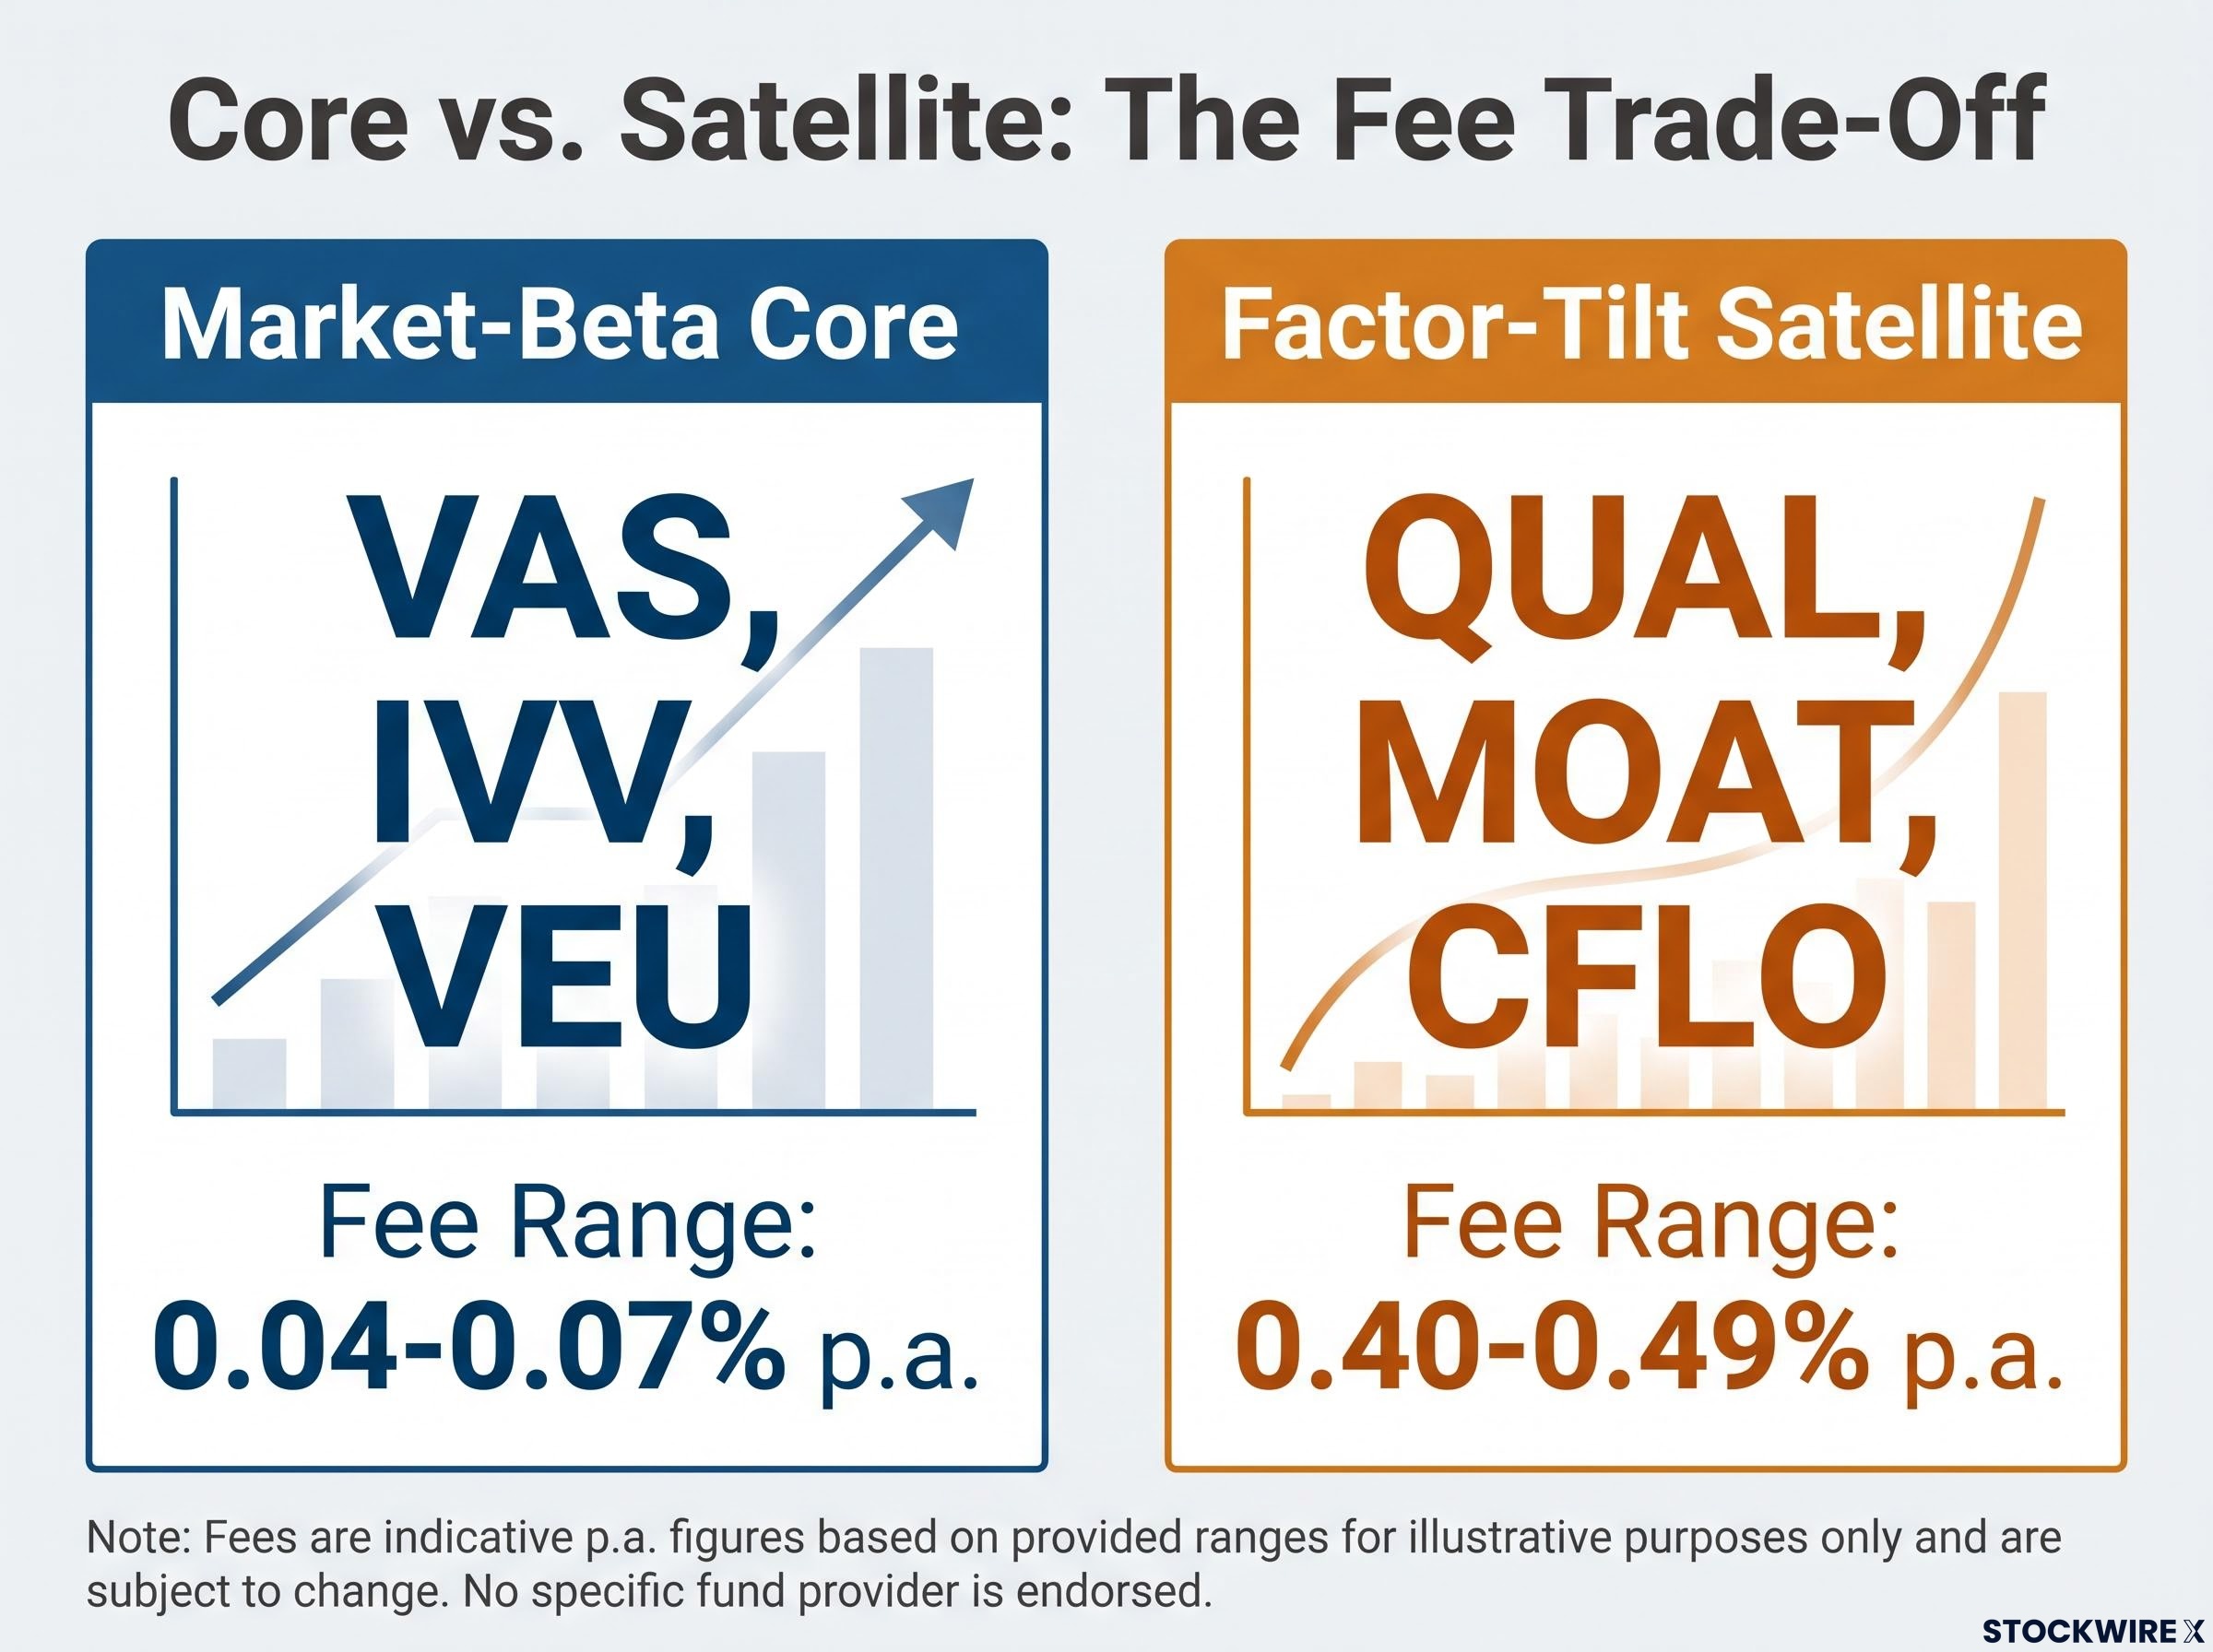
Your blended fee drag depends entirely on how you split core versus satellite. Keep the core dominant and you barely notice the cost. Load up on satellites and the fee gap compounds against you year after year.
The SMSF data suggests this structure is already widely adopted. With VAS at 14.2%, IVV at 13.4%, and QUAL at 12.7% of SMSFs holding ETFs, the domestic-plus-global-plus-quality pattern is close to a default among self-directed investors. The practical implication for you is that satellite sizing is a cost-versus-conviction decision. The higher fees on QUAL, MOAT, and CFLO are only justified if you genuinely believe the factor premium they target will show up over your investment horizon.
Managing US concentration when you hold both IVV and MOAT
Here is a trap worth naming early. IVV and MOAT are both US equity products. Hold both without thinking about it, and your total US allocation can quietly become the dominant share of your entire portfolio.
VEU is your primary tool for correcting this. Because it holds everything outside the US, adding VEU directly offsets the US-heavy tilt that IVV and MOAT create together. If you want a satellite in US moats, size your VEU allocation with that combined US weight in mind, not just your IVV position on its own.
The franking credit trade-off and what it means for your domestic allocation
Franking credits are the usual justification for holding a lot of Australian equity. They are a genuine tax advantage, but they are also frequently used to defend what is really just domestic familiarity bias.
Franking, or imputation, credits work like this. When an Australian company pays tax on its profits and then distributes dividends, it can attach a credit for the tax already paid. You can use that credit to reduce your own tax bill, and in a low-tax environment such as superannuation, the benefit is at its largest.
Franking credit mechanics vary significantly by investor structure: pension-phase SMSFs taxed at 0% receive the full credit as a cash refund from the ATO, while accumulation-phase investors use the credit to offset personal tax at their marginal rate, a distinction that directly affects how much domestic overweight is actually justified.
VAS is the primary vehicle for accessing these credits among ASX ETFs. The catch is that maximising franking access requires overweighting Australian shares, which means concentrating further in banks, miners, and a few industrials. The international ETFs, IVV, QUAL, VEU, and CFLO, carry no franking credits at all, because they hold non-Australian companies.
Here is the trade-off laid out plainly:
- VAS offers: franking credits, familiar domestic sector exposure, and AUD-denominated returns
- IVV, VEU, QUAL, and CFLO offer: global sector breadth, currency diversification, and access to technology and healthcare that the ASX lacks, but no franking credits
Adviser commentary consistently warns that allowing franking to drive an extreme domestic overweight increases sector concentration and erodes the geographic diversification international ETFs provide. The commonly applied approach is to keep a meaningful but not dominant VAS allocation, retaining the franking benefit while sending a substantial portion of growth assets offshore.
So the right question is not “how do I maximise franking credits?” It is “how much franking benefit am I willing to sacrifice for genuine global diversification?” Your VAS weight is the dial that controls exactly that trade-off.
Currency exposure as a feature, not just a risk
Every international holding you own carries currency exposure. Unhedged international ETFs mean your returns are partly driven by movements in the AUD against the US dollar and other currencies.
That sounds like pure risk, but it can work in your favour. When the Australian dollar weakens, your international holdings deliver higher returns once translated back into local currency. Periods of AUD weakness often coincide with domestic economic stress, so that currency effect can act as a natural hedge, cushioning your portfolio precisely when the local economy is struggling.
Performance, costs, and what the data actually says about quality and moat ETFs
The case for quality and moat satellites rests on evidence, and honest evidence cuts both ways. QUAL has a strong long-term record, and it has also gone through stretches of underperformance you need to expect.
Start with the long-term numbers. According to InvestSMART and VanEck data as at 31 August 2026, QUAL delivered a 1-year total return of 8.41% and a trailing 10-year annualised return of 14.9%. Its Sharpe ratio, which measures return per unit of risk, came in at 1.05 against 0.88 for the broad large-blend category. A higher Sharpe ratio means you were compensated more generously for the risk you took.
Now the other side. Morningstar’s 2026 analysis, “ETF Spotlight: Finding quality exposure to global equities,” noted that over one specific trailing 12-month period, QUAL returned just 2.4% against 6.5% for its MSCI World ex-Australia parent index. Factor strategies can and do lag the broad market for extended stretches.
The downside-protection case is clearest in a crisis. During the Covid selloff in early 2020, quality held up better than the market did.
Quality-factor downside protection in action During the early 2020 Covid drawdown, QUAL fell approximately 7.5% while the broader market declined approximately 12.8%.
MOAT deserves a separate note. It does not track the full S&P 500 the way IVV does. It applies a concentrated qualitative and valuation screen, which means it can diverge substantially from IVV in both directions, outperforming in some periods and lagging in others.
| ETF | 1-Year Return | 10-Year Annualised | Sharpe Ratio | Fee (p.a.) |
|---|---|---|---|---|
| QUAL | 8.41% | 14.9% | 1.05 | 0.40% |
| IVV | See fund fact sheet | See fund fact sheet | See fund fact sheet | 0.04% |
| MOAT | See fund fact sheet | See fund fact sheet | See fund fact sheet | 0.49% |
| VEU | See fund fact sheet | See fund fact sheet | See fund fact sheet | 0.04% |
| CFLO | See fund fact sheet | See fund fact sheet | See fund fact sheet | 0.40% |
Current total return figures in AUD for MOAT, VEU, and CFLO were not available at the time of writing. Check the latest fund fact sheets from VanEck, Vanguard Australia, and Betashares before you commit.
The fee gap is the final piece. QUAL and CFLO charge 0.40% p.a. and MOAT charges 0.49% p.a., against just 0.04% p.a. for IVV. That gap of roughly 0.36-0.45 percentage points a year compounds materially over a decade. The Sharpe ratio and the drawdown numbers tell you quality has historically delivered better return per unit of risk and softer falls in stress. The underperformance episode tells you it can lag for years. Both are true at once, and holding both truths is exactly why satellite sizing matters.
Factor premiums are measured in percentage points rather than multiples, which means transaction costs, portfolio turnover, and tax drag can quietly erode the advantage a quality or moat screen is designed to capture over a standard index fund.
Past performance does not guarantee future results. Financial projections are subject to market conditions and various risk factors.
Building your 2027-ready portfolio: the decisions that actually matter
You now have the pieces. What remains is a sequence of choices, and each one is yours to make rather than a default to accept. Work through them in order.
- Set your domestic versus international split. This is where your franking and domestic concentration trade-off lives. A larger VAS weight means more franking credits and more exposure to banks and miners; a smaller weight means broader global reach.
- Decide your US versus non-US global balance. Within your international allocation, split between IVV for the US and VEU for everywhere else. Your VEU weight is the lever that controls US concentration.
- Decide whether to include a factor satellite, and which one. Choose QUAL for global quality, MOAT for US moats, or CFLO for global cash-flow strength, or a combination.
- Size the satellite relative to the core based on fee tolerance. This is your cost-versus-conviction bet. Core sits at 0.04-0.07% p.a.; satellites sit at 0.40-0.49% p.a.
- Review your total US concentration across IVV and MOAT combined. Both are US products, and combined weight can become dominant without deliberate sizing.
The right mix depends on your own tax situation, whether you invest inside superannuation or a personal account, your risk tolerance, your horizon, and what you already hold. That is why this is a framework, not a set of fixed percentages.
A few forward-looking considerations specific to 2027 deserve weight in these decisions:
- US technology valuation risk: heavy IVV and MOAT exposure ties you to the fortunes of a narrow band of mega-cap tech names
- AUD currency direction uncertainty: unhedged international holdings add currency as a return driver you cannot fully predict
- Interest rate plateau implications: a stable-rate environment affects sectors unevenly, from banks to rate-sensitive growth stocks
This article is for informational purposes only and should not be considered financial advice. Investors should conduct their own research and consult with financial professionals before making investment decisions.
What a considered ETF mix actually gives you heading into 2027
A core of VAS, IVV, and VEU, with a measured satellite in QUAL, MOAT, or CFLO, produces a portfolio that is geographically broad, sector-balanced, and cost-managed, with a deliberate tilt toward quality businesses. You get all of that without picking a single stock yourself.
The work does not end at construction. Allocations drift, and currency movements in particular will shift the relative weight of your international holdings over time, so periodic rebalancing back toward your targets is part of the discipline.
Treat this framework as the starting point for your own review rather than a fixed prescription. Where your tax circumstances or investment objectives call for tailored guidance, a licensed financial adviser can help you translate these building blocks into weightings that fit your specific situation.