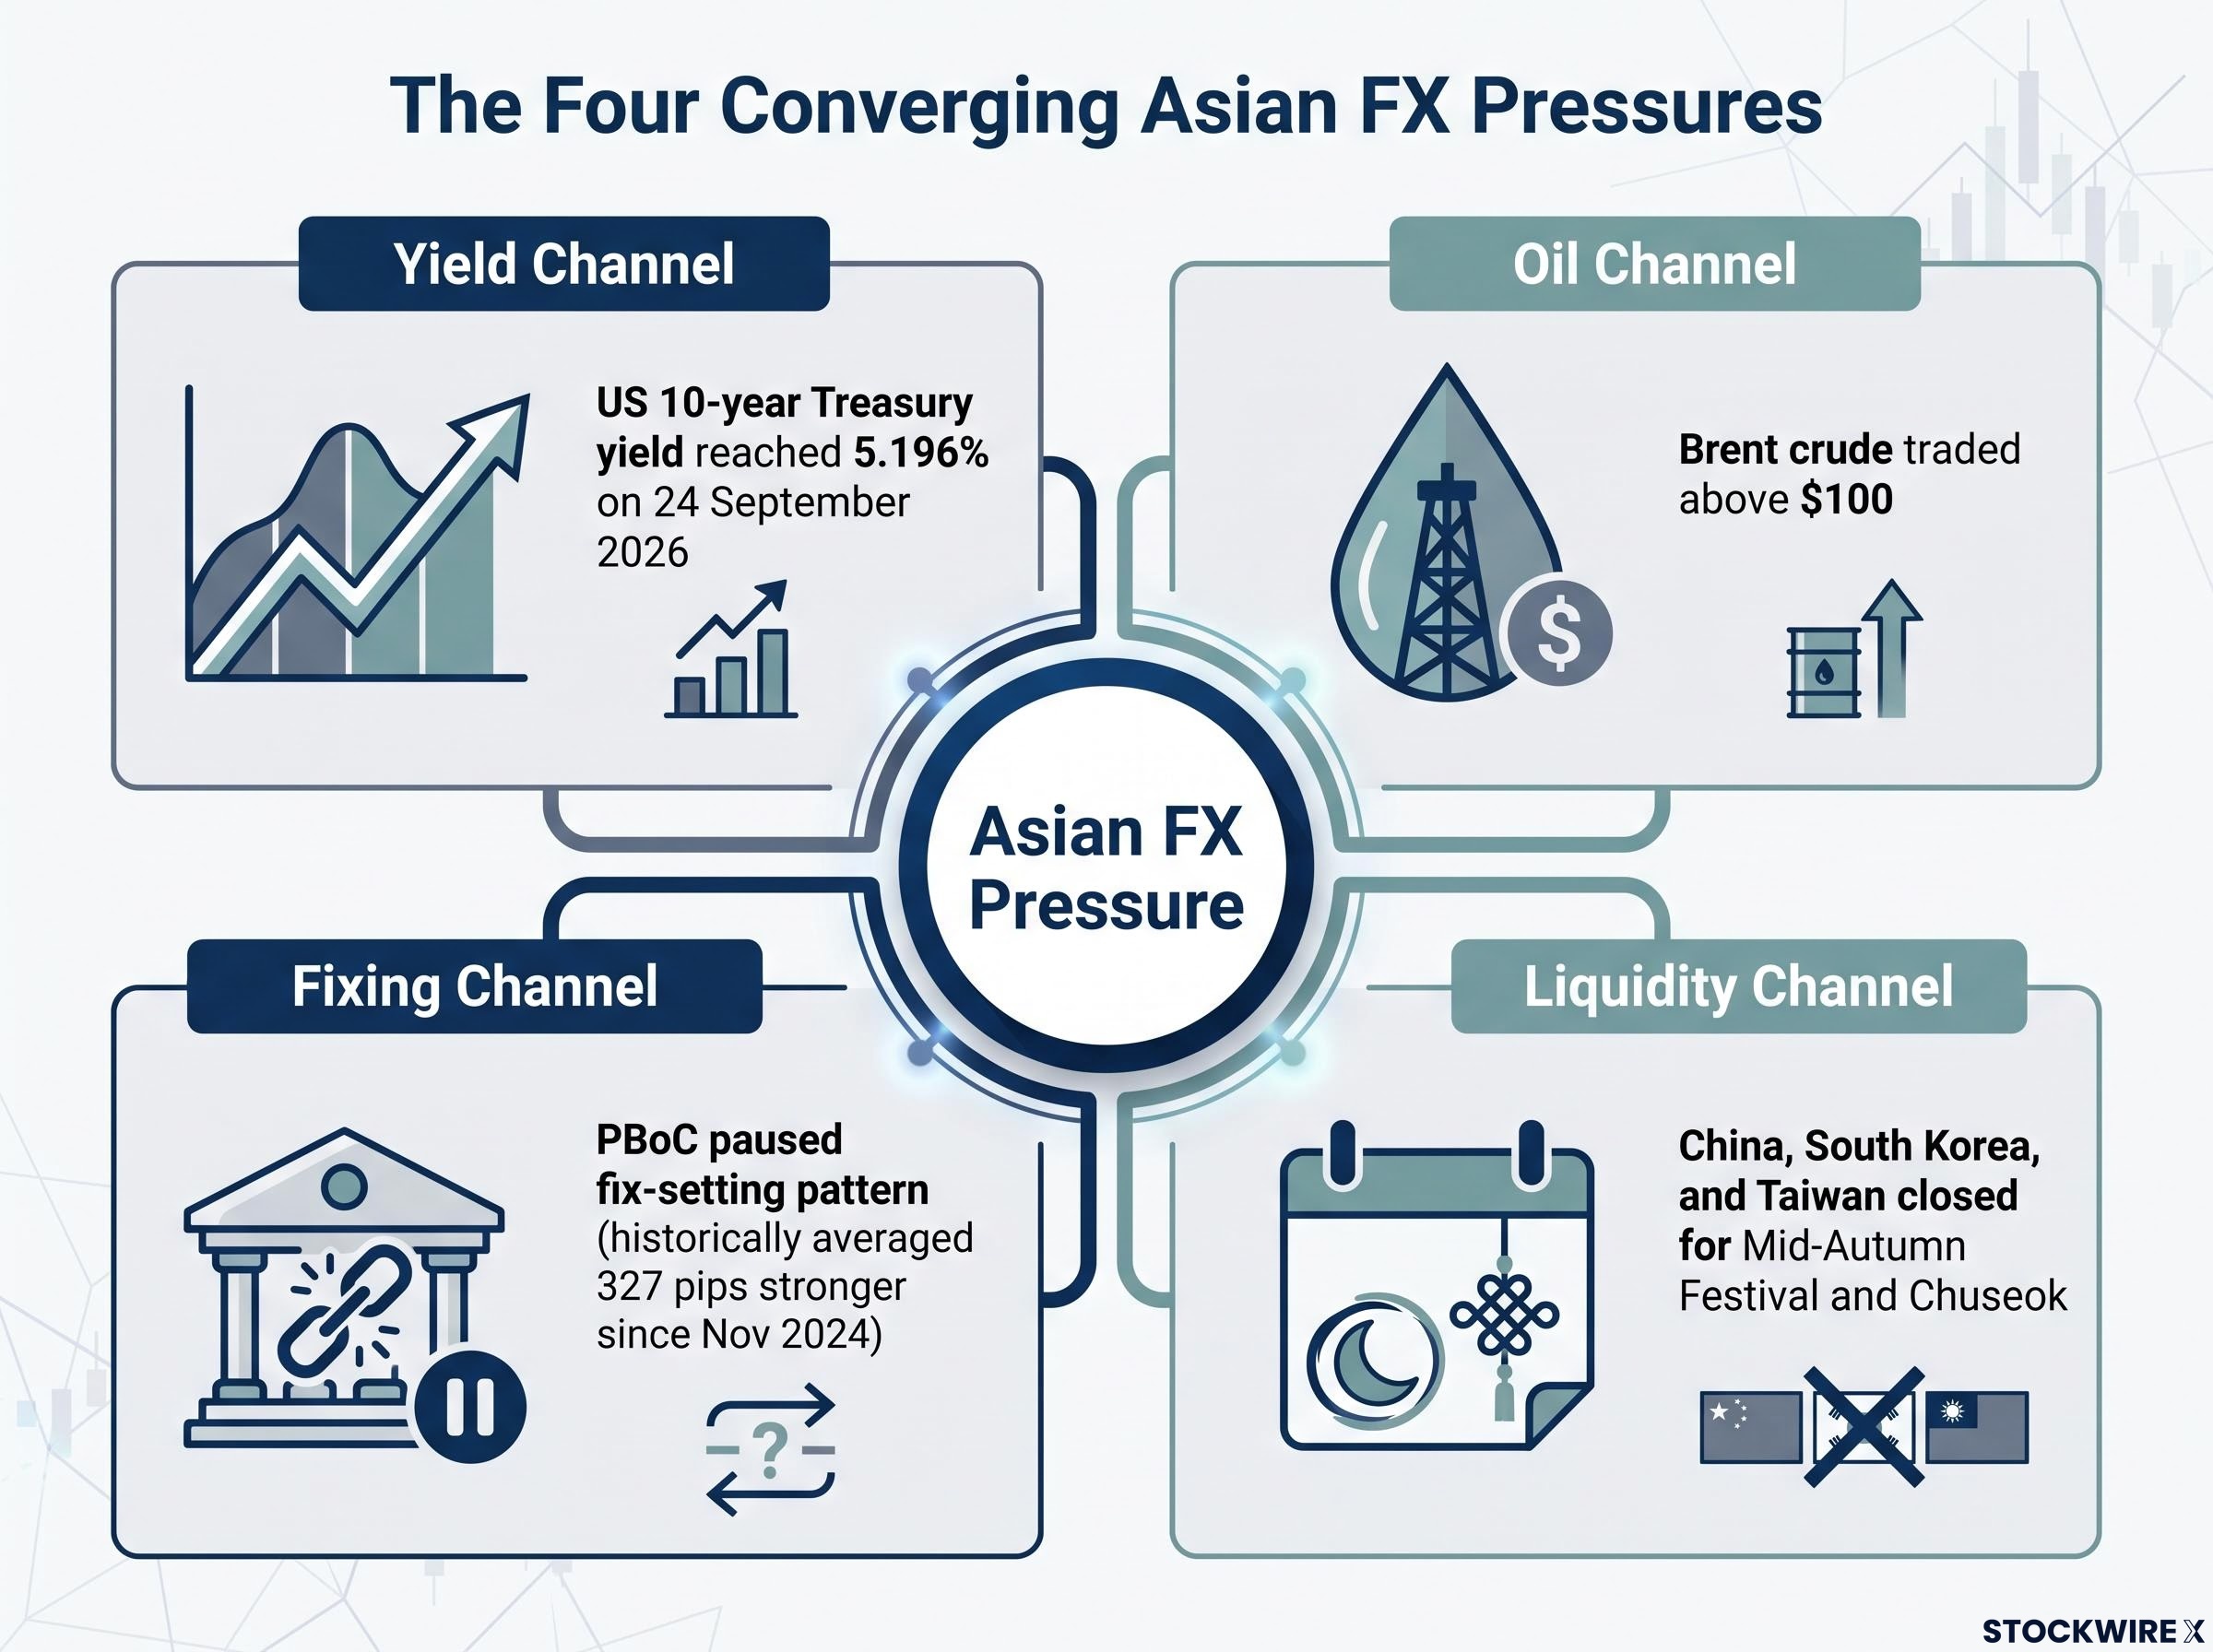
Three headwinds are hitting Asian currencies at once, and they arrived within days of each other. The US 10-year Treasury yield pushed above 5% in late September 2026, the highest since 2007, while Brent crude traded above $100 and three of Asia’s largest markets closed simultaneously for holidays. That combination has a name in FX desks: pressure.
This is not a routine bout of dollar strength. It is three distinct headwinds, each transmitting through a different mechanism, converging on the same currencies at the same time. There is also a fourth wildcard: the People’s Bank of China (PBoC) has paused a fix-setting pattern that had quietly been supporting the region, removing a stabiliser many market participants had come to lean on.
Here is how each pressure channel actually works, where the risk concentrates across individual pairs, and what the Chinese yuan’s recent behaviour signals about how durable this stress really is. Treat what comes next as a framework for reading the region, not a snapshot of one bad week.
How a 5% US 10-year yield becomes a regional FX problem
Start with the anchor fact. The US 10-year Treasury yield reached 5.196% on 24 September 2026, according to Reuters, before easing marginally to 5.18% on 25 September 2026 per TradingEconomics. Both readings sit at the highest level since 2007.
The anchor number The US 10-year Treasury yield hit 5.196% on 24 September 2026, described by Reuters as the highest since 2007.
A yield that high does specific work. The wider the gap between US Treasuries and Asian government bonds, the harder it becomes for global investors to justify holding local debt. Capital rotates back into dollar assets, which forces sales of Asian bonds and equities, and those sales push the exchange rate lower.
The yield differential transmission from US Treasuries to emerging market assets operates simultaneously across bonds, equities, and currencies, meaning a sustained 5% yield does not hit Asian FX in isolation but reprices the entire risk stack that foreign investors hold across the region.
The channel bites hardest where foreign investors hold the largest share of government debt. That points directly at Indonesia, India, and Thailand, where a heavy foreign presence in the local bond market means capital exit shows up quickly in the currency.
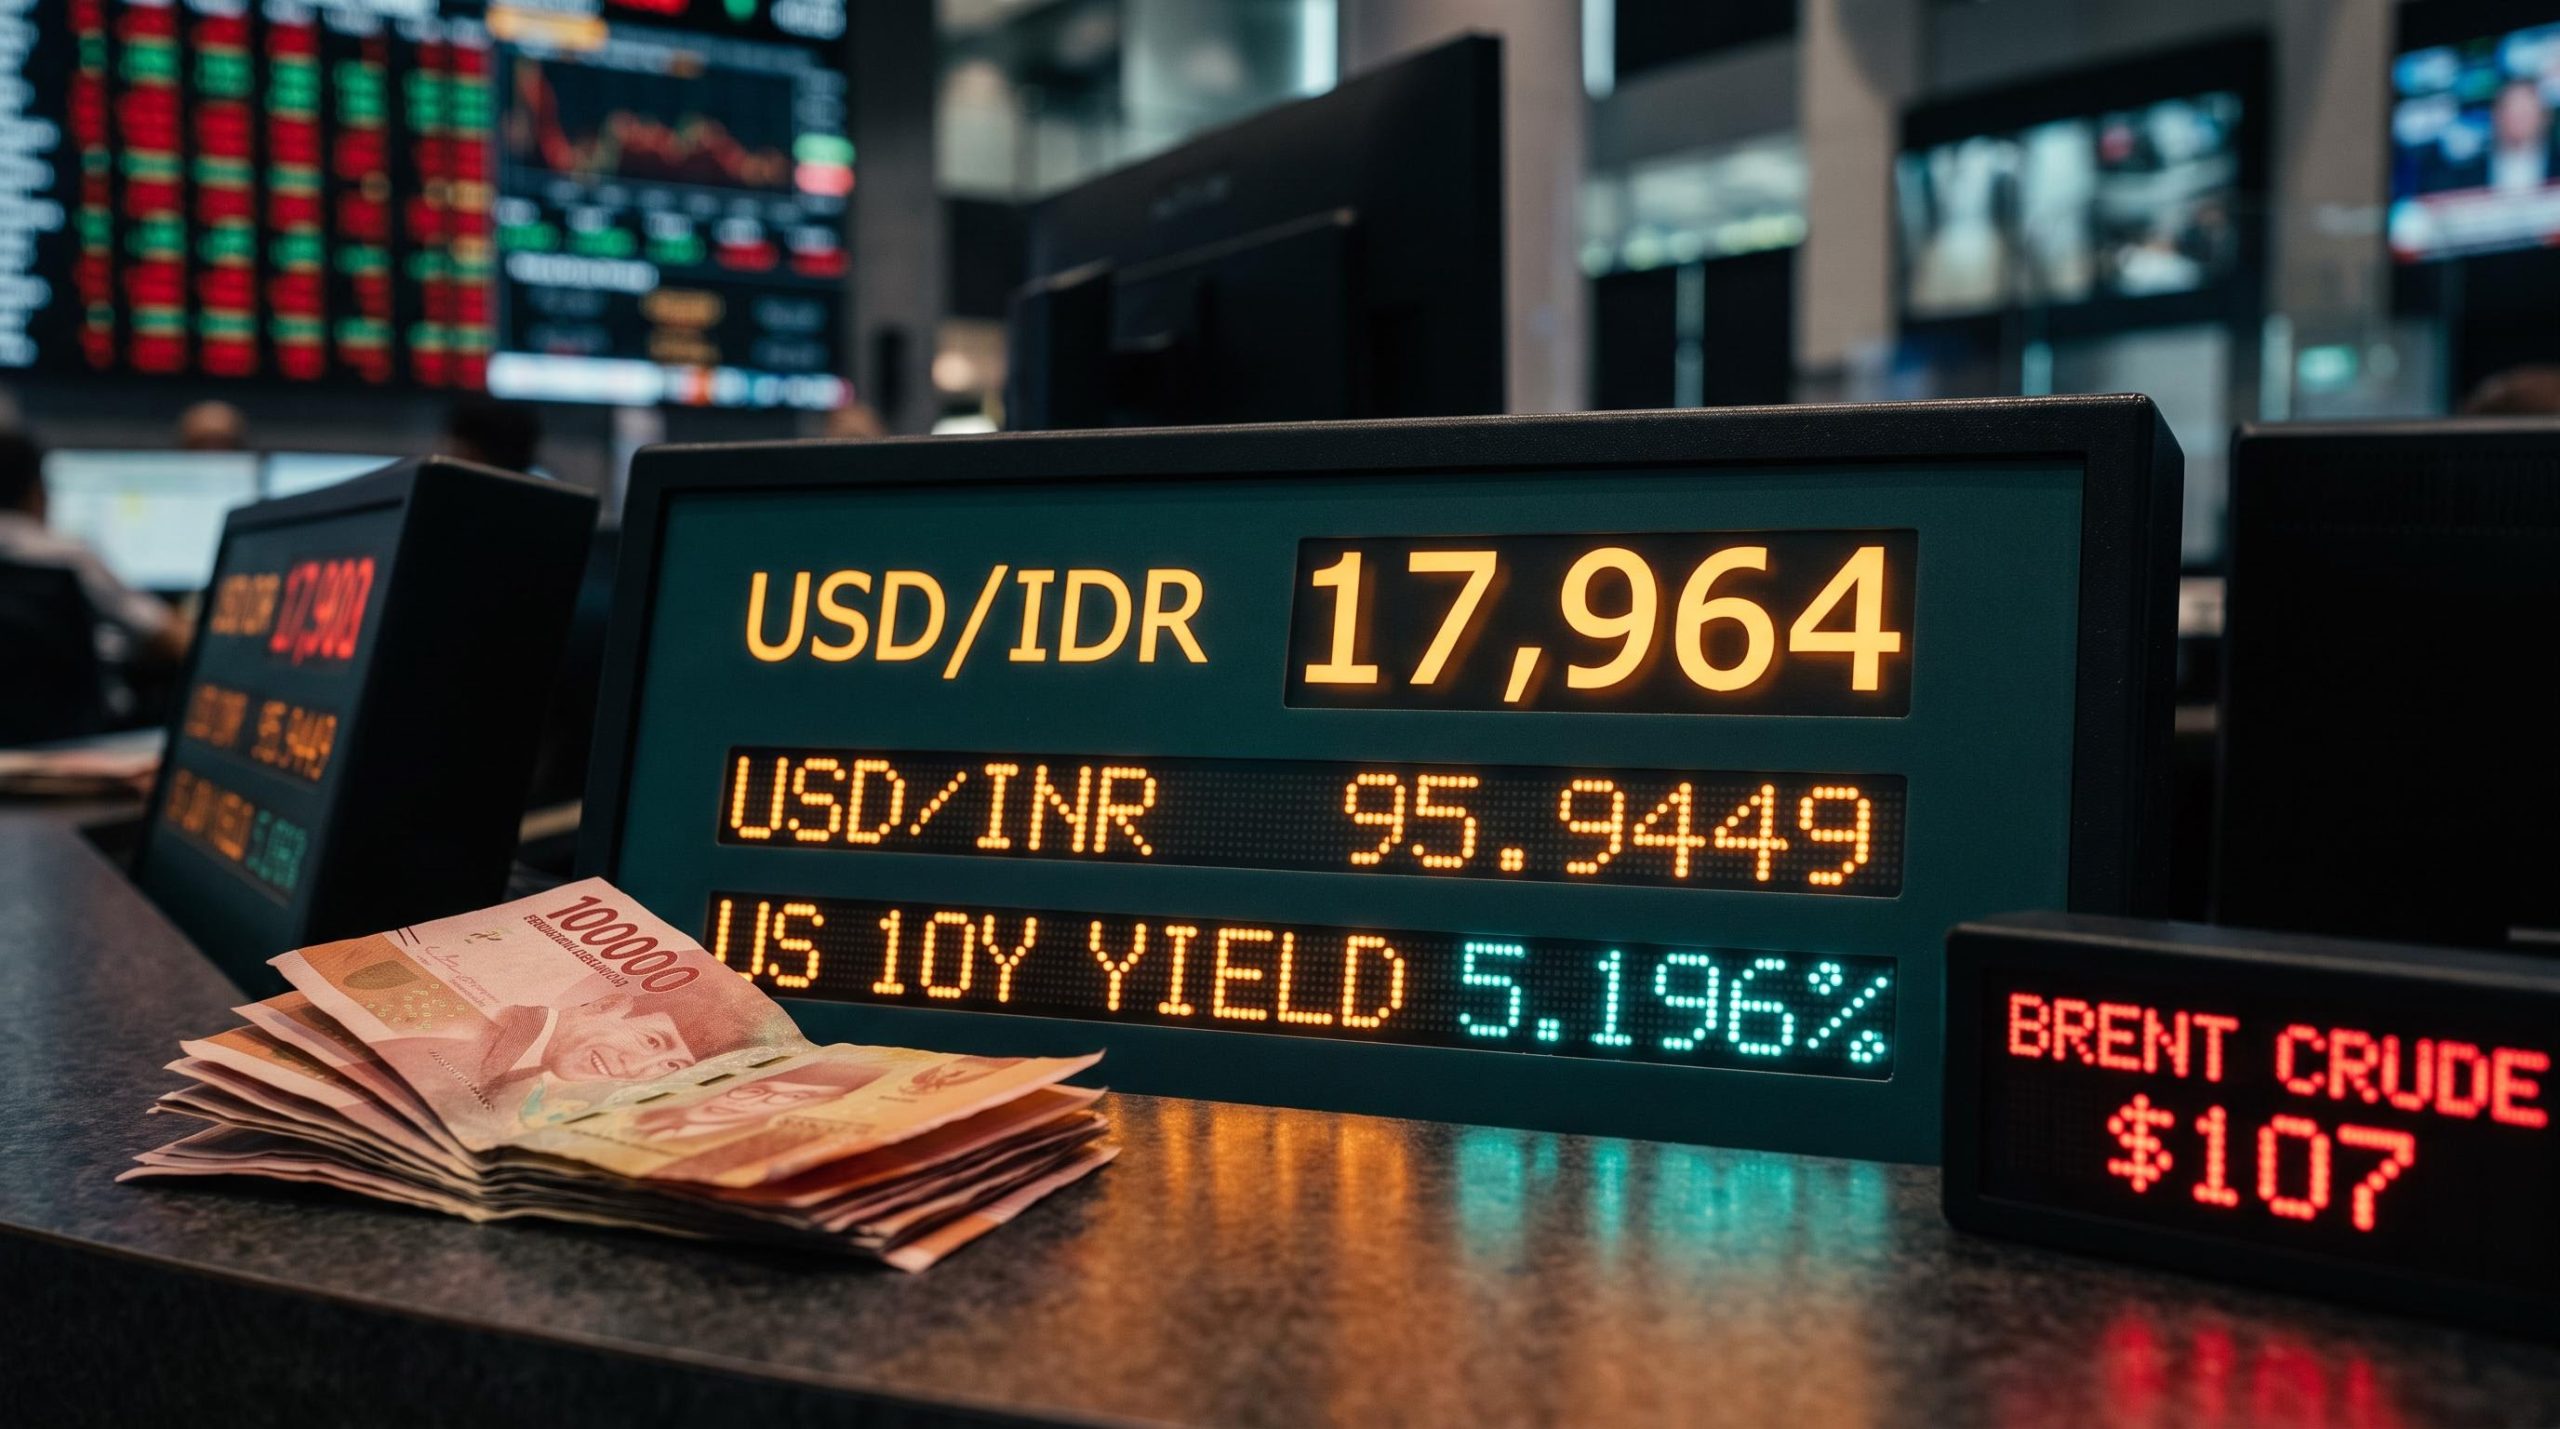
The numbers on 24 September 2026 confirm the pattern. OCBC strategists Sim Moh Siong and Christopher Wong flagged the Indonesian Rupiah as among the worst regional performers, with the Philippine Peso, Indian Rupee, and Thai Baht also under pressure.
| Pair | Level (24 Sep 2026, except USD/THB which is 17 Sep 2026*) | Daily move | OCBC characterisation |
|---|---|---|---|
| USD/IDR | 17,964 | +0.75% | Among worst performers |
| USD/INR | 95.9449 | +0.21% | Underperformer |
| USD/PHP | 62.727 | +0.10% | Underperformer |
| USD/THB | 33.420 | -0.03% | Underperformer |
| USD/SGD | 1.2793 | -0.06% | Relatively stable |
The read for you is this: Asian central banks are not competing with an abstractly stronger dollar. They are competing with a risk-free US return not seen in almost two decades, and for currencies with large foreign debt-holder bases, that competition is structuring genuine capital exit. As long as the Fed’s posture holds, this channel does not fade on its own.
When big ASX news breaks, our subscribers know first
The oil price channel: why Asian importers carry a heavier burden
The yield story explains capital flows. It does not explain why India, the Philippines, and Thailand look more exposed than commodity exporters facing the identical dollar. That gap is the oil channel, and it works through the trade balance rather than the bond market.
Oil traded at elevated levels across the whole of September 2026, not in a single spike. The progression through the month makes the sustained pressure clear:
- 1 September 2026: Brent at $94.65 (up 4.6% on the day) and WTI at $90.22 (up 5.2%), settling at five-week highs, per Reuters.
- Late August/early September 2026: WTI topping $92 and Brent around $97, with Saxo Bank explicitly linking oil above $95 to multi-decade-high bond yields.
- 15 September 2026: Brent at $107.37 and WTI at $103.24, per New Straits Times reporting.
- 18 September 2026: Brent around $105, framed by the IMF Global Markets Monitor as part of tightening global financial conditions alongside high yields and a stronger dollar.
For a net oil importer, sustained elevated crude means the import bill surges without a matching lift in export revenue. The current account deteriorates, external balances weaken, and reliance on foreign capital inflows rises. That is a terms-of-trade shock, distinct from anything the yield channel does.
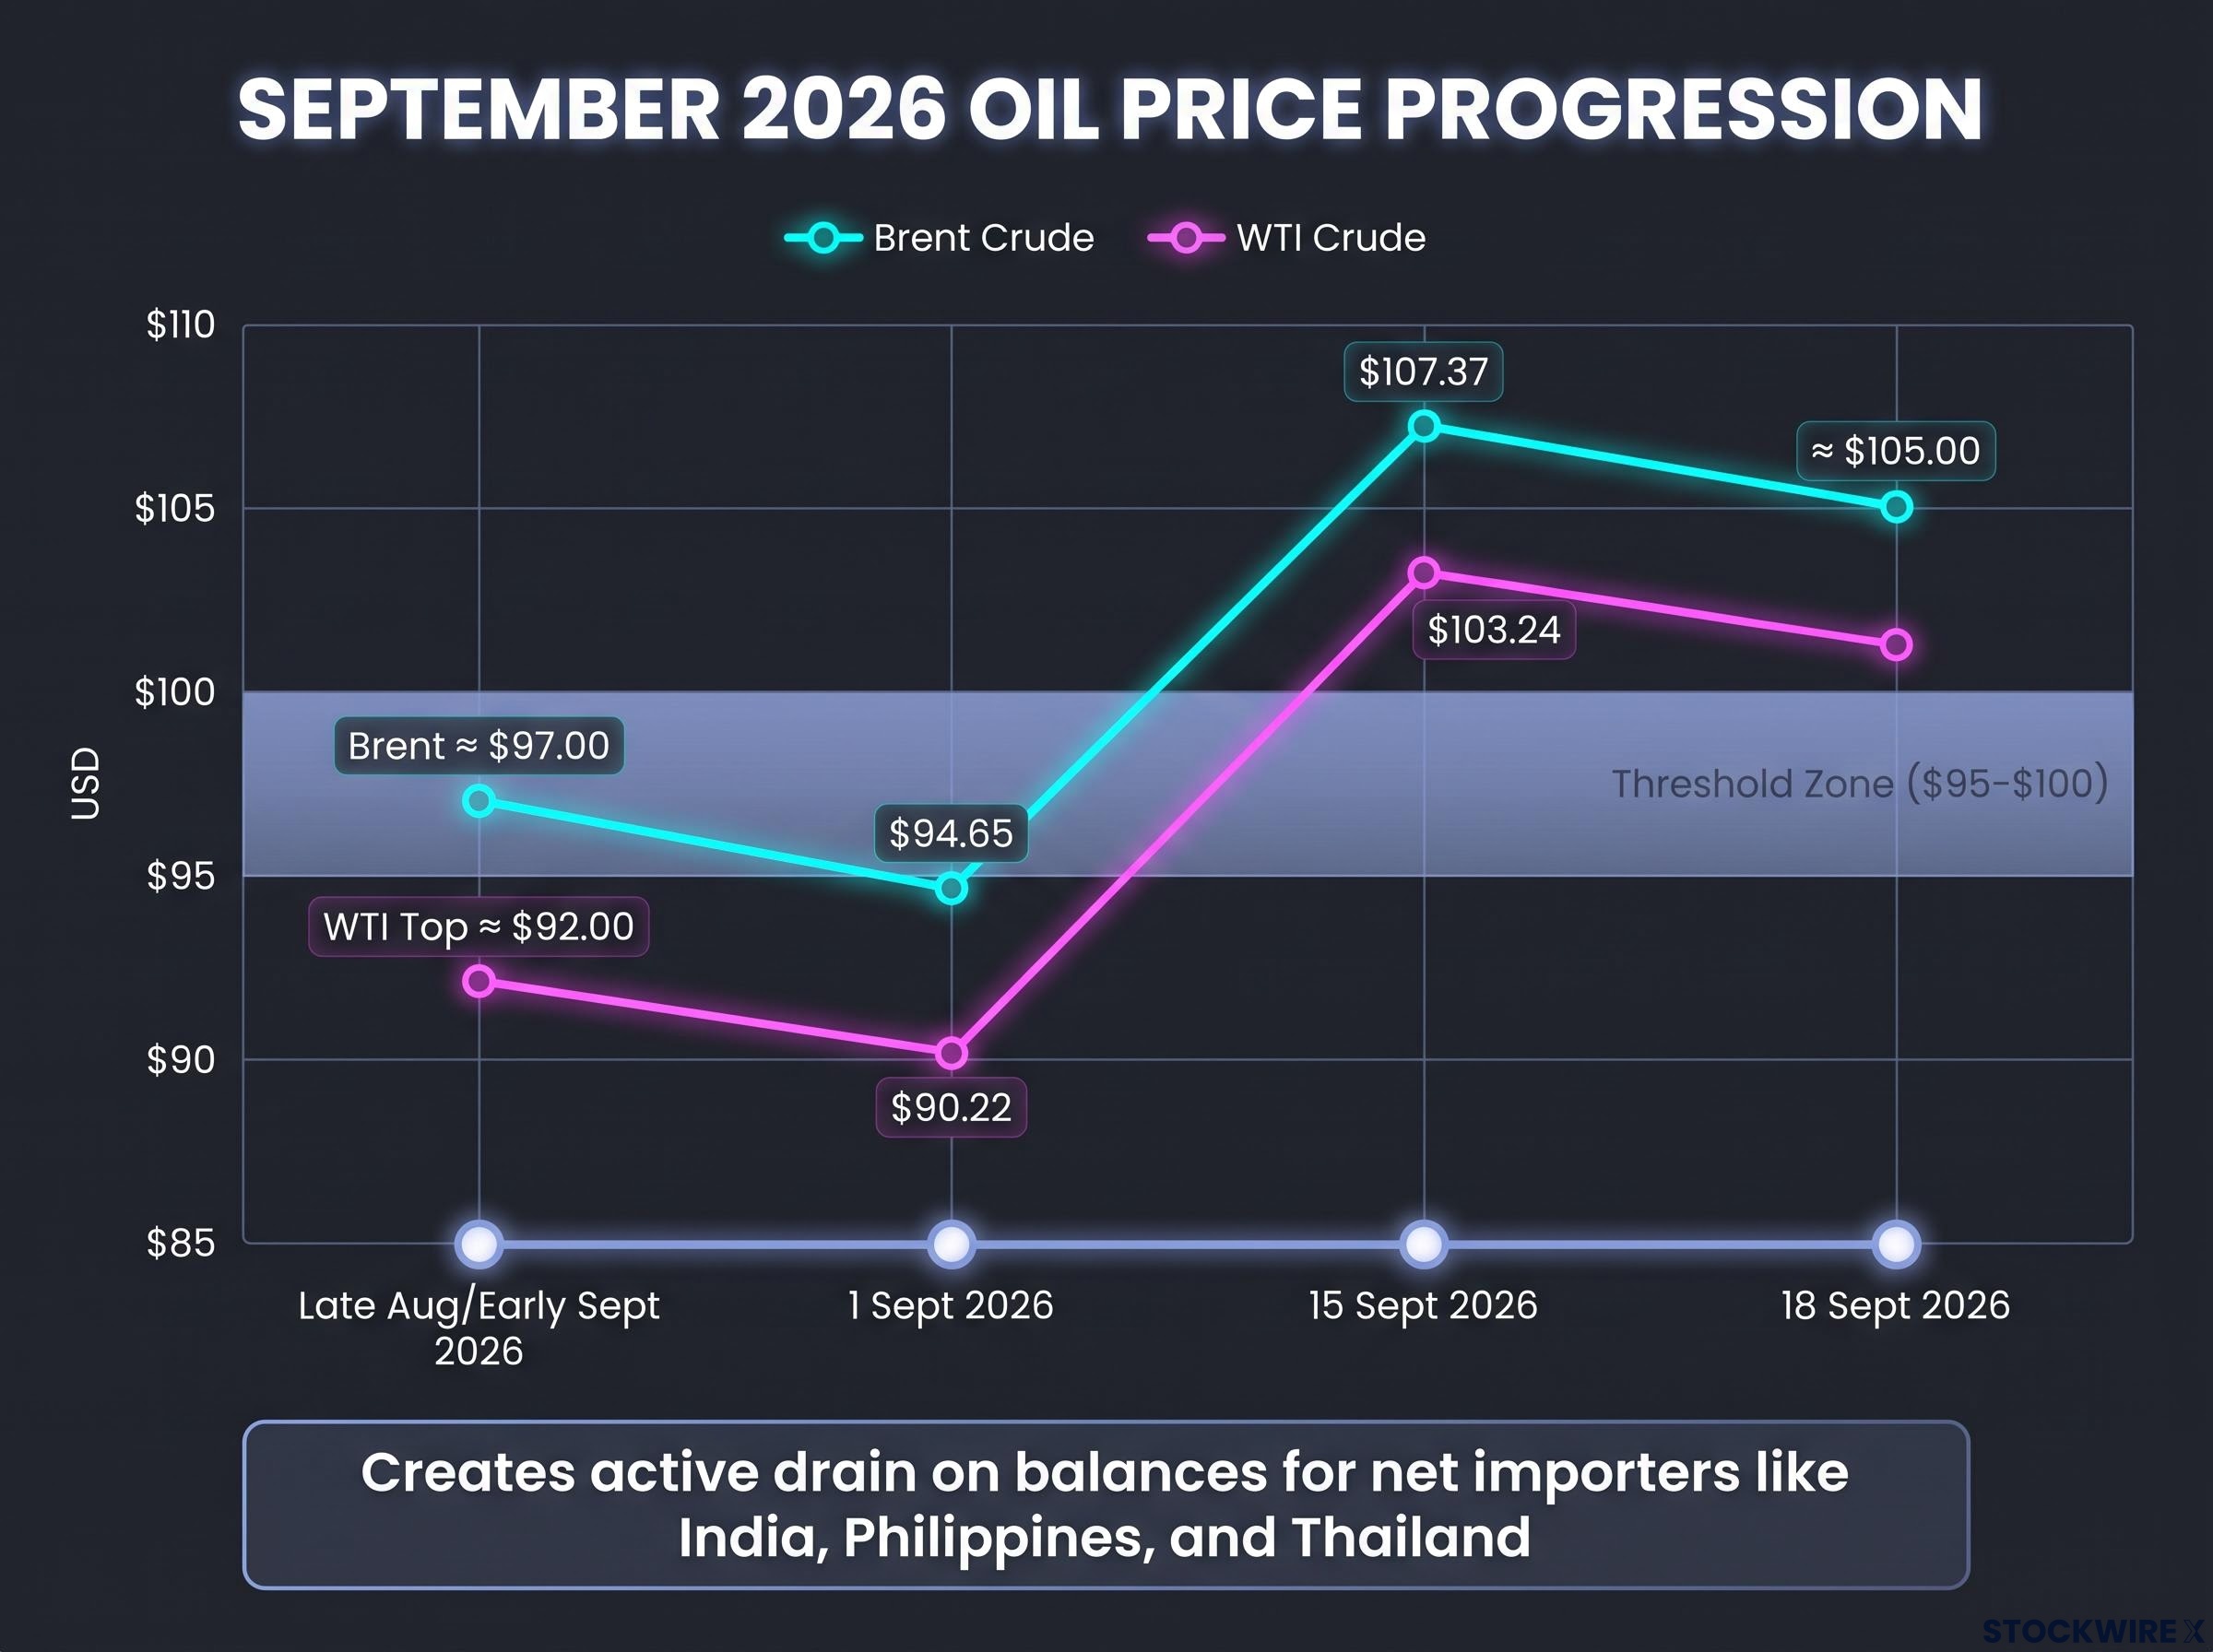
India, the Philippines, and Thailand sit squarely in the exposed group. For a commodity exporter, the same oil move is neutral or even supportive; for these importers, it is an active drain on the balances that give their currencies resilience.
The Hormuz supply shock that materialised in mid-September 2026 added a geopolitical risk premium on top of the structural oil-price trend, compressing the Rupiah, Rupee, and Peso from two directions simultaneously by raising the import cost and triggering broad risk-off outflows in the same session.
If you hold or track the Indian Rupee, Philippine Peso, or Thai Baht, Brent above $95-$100 is not background noise. It is an ongoing deteriorant of the external position that underpins each currency’s ability to absorb any further shock.
The IEA Oil Market Report for September 2026 flags that crude-price losses from elevated costs are concentrated in middle distillates and petrochemical feedstocks, with Asia bearing the heaviest share, reinforcing why the terms-of-trade damage lands disproportionately on net-importing economies rather than being distributed evenly across the region.
When yield differentials and import costs converge
Here is where the analysis sharpens. These two channels are not additive; they are mutually reinforcing.
A worsening current account increases a country’s dependence on capital inflows to fund the gap. High US yields are draining exactly those inflows away at the same moment. So the oil shock deepens the need for foreign capital precisely when the yield shock is making that capital harder to attract.
Current market commentary treats these as overlapping rather than independent forces, and that framing matters for you. It is why the oil channel, often underweighted next to the louder yield-differential narrative, turns Asia’s net-oil importers into a two-front vulnerability rather than a one-front one.
What the PBoC’s pause in fix-setting means for the region
To understand the fourth pressure, you first need to understand how China manages its currency. Each morning the PBoC sets a daily midpoint, or fixing, for the yuan against the dollar. The spot rate is then allowed to trade within a ±2% band around that fix, which gives the central bank a direct lever over the currency’s direction.
The key point is not the mechanism itself but how the PBoC had been using it. According to Reuters reporting from 24 November 2025, the bank had been setting its midpoint consistently firmer than market models expected, averaging a gap of roughly 327 pips stronger than Reuters’ model-based estimates since November 2024.
How firm the fix had been The PBoC’s official midpoint ran an average of about 327 pips stronger than model-based estimates from November 2024, per Reuters (24 November 2025).
That firmer bias was a signal. It told the market the PBoC wanted a stable-to-stronger yuan, and it lent the whole region a directional anchor. Then, per OCBC’s Sim Moh Siong and Christopher Wong, that pattern paused in the near-term period, removing a key support factor and causing the yuan’s recent upward momentum to fade.
The outlook for the yuan is genuinely contested, and the two cases run in parallel:
- The managed-stability case: the PBoC backstop and its demonstrated willingness to guide the currency, China’s sizeable goods current-account surplus, and ongoing yuan internationalisation in trade and reserves all argue for a stable-to-gradually-appreciating band.
- The renewed-depreciation case: structural growth headwinds from property-sector stress and demographics, the high cost of defending the yuan against a 5% US yield, and the risk of capital outflows all argue for softness, sharpened by the pause in the firmer-fix pattern.
There is also a structural wrinkle worth flagging. The offshore yuan (CNH) can move more sharply than the onshore yuan (CNY), particularly during holidays when the onshore official presence is reduced.
Offshore yuan dynamics carry particular weight in this environment because CNH moves more freely than CNY during periods of reduced onshore presence, and the gap between the two benchmarks widens precisely when the PBoC’s ability to guide sentiment through the fix is most constrained.
Why does a technical fixing pattern matter beyond the yuan itself? Because the currency has functioned as a managed anchor for regional FX sentiment. When the most-watched anchor in the region starts losing directional momentum, it strips one layer of psychological support from the entire Asian FX complex at the worst possible moment.
Holiday-driven liquidity gaps and what thin markets do to FX risk
The final pressure is structural rather than macro, and it is easy to dismiss as a seasonal footnote. That would be a mistake. Thin markets do not create shocks, but they amplify the ones already in play.
Here is how a holiday closure degrades a market in sequence, with each step compounding the last:
- Reduced dealer participation as major market-makers go offline.
- Wider bid-ask spreads as fewer participants quote prices.
- Increased price impact per order, so smaller flows move the rate further than usual.
- Higher probability of stop-loss cascades as those larger moves trigger automatic selling.
- Limited central-bank smoothing, because with onshore markets shut, intervention is confined to less effective offshore channels.
BIS and central-bank commentary on market microstructure has long documented how dealer inventories and market depth drop during holiday periods, and how that raises price impact for any given order. The caution attached to that literature is important: thin-market moves often reflect microstructural imbalances rather than fundamental shifts.
History supports the caveat. Previous Golden Week and Lunar New Year periods have produced outsized intraday moves in pairs like USD/IDR and USD/THB that reversed once liquidity normalised.
The late September 2026 calendar: three markets out simultaneously
The timing here is unusually concentrated. Per OCBC’s Sim Moh Siong and Christopher Wong, China, South Korea, and Taiwan were all closed together for the Mid-Autumn Festival and Chuseok observances, thinning offshore liquidity sharply into the weekend.
China’s Golden Week, beginning the following Thursday, then extends the thin-liquidity window further. With onshore markets shut, the capacity of regional central banks, sovereign wealth funds, and large domestic banks to smooth volatility is limited to offshore channels that are typically less effective.
The practical implication for you is specific. If you hold open Asian FX positions or are watching levels in USD/IDR or USD/THB, a modest global catalyst arriving in this window could produce intraday moves that look alarming but reflect microstructural distortion rather than a real shift in the underlying balance of pressures. Knowing that mechanism is how you separate signal from noise.
What the convergence of these pressures means for the near-term outlook
Read in isolation, each channel is manageable. Read together, they form a system, and the system is where the vulnerability compounds beyond the sum of its parts.
High US yields are pulling capital out of the region. Elevated oil is deepening the current-account deficits that make that capital more necessary. Thin holiday liquidity is amplifying every move either channel produces. And the PBoC’s fixing pause has removed one of the few counterweights that had been supplying directional support. Four forces, one direction.
The exposure is not uniform, and that is the point OCBC’s strategists stress: weakness was expected to differ across individual currency pairs rather than being uniform.
| Pair | Yield-differential exposure | Oil-import exposure | Liquidity sensitivity | OCBC near-term view |
|---|---|---|---|---|
| USD/IDR | High | Moderate | High | Among worst performers |
| USD/INR | High | High | Moderate | Underperformer |
| USD/THB | Moderate | High | Moderate | Underperformer |
| USD/PHP | Moderate | High | Moderate | Underperformer |
| USD/SGD | Low | Low | Low | Relatively stable |
The Rupiah near 17,964 and the Rupee near 95.9449 carry dual exposure and sit at the sharpest end. The Singapore Dollar at 1.2793 is a relative anchor thanks to its managed-currency architecture, with the Baht and Peso in between.
The takeaway is not freefall. The broader analyst view holds that this weakness is primarily cyclical, tied to a global high-yield and high-oil environment, rather than a structural break, though amplified by Asia-specific vulnerabilities. Because the risks are so concentrated and multi-directional, partial normalisation in any single channel could deliver a meaningful relief rally without any change to the underlying macro backdrop.
Three shifts could trigger that relief:
- A pullback in the US 10-year yield back below 5%.
- Brent easing back under the $95-$100 zone.
- Liquidity returning as the holiday cluster clears.
This article is for informational purposes only and should not be considered financial advice. Investors should conduct their own research and consult with financial professionals before making investment decisions.
Three variables to watch before conditions normalise
The framework is only useful if it tells you where to look first. Three variables carry the highest near-term signal value for the Asian FX complex, and each leads the currency moves rather than lagging them.
- The US 10-year yield. Watch whether it holds above 5% or pulls back. This is the primary driver of the capital-flow channel, so it moves before the FX pressure it creates. A sustained retreat below 5% would ease the single largest headwind.
- Oil price direction. Watch whether Brent sustains above the $95-$100 zone. Above that level, current-account deterioration for net-oil importers becomes material, so the crude price signals external-balance stress before it shows up in the Rupee or Baht.
- PBoC fix-setting behaviour. Watch whether the firmer-fix pattern resumes in the sessions immediately after the holidays. A return to stronger-than-model fixes would restore the regional anchor; continued absence signals fading support.
For investors wanting to map how the yuan resolves from here, our full explainer on USD/CNH swing factors examines the four variables — Fed policy, property sector trajectory, PBoC tolerance for volatility, and sanctions escalation — that will determine whether the pair drifts toward the 6.60 or 6.90 end of the institutional forecast range.
One final discipline. The holiday window creates a stretch of elevated noise, so weight post-holiday price action far more heavily than anything that prints during the thin-market period itself.
The framing to hold onto Near-term weakness was expected to differ across individual currency pairs rather than being uniform, per OCBC strategists Sim Moh Siong and Christopher Wong. Generalising across the whole region is analytically insufficient.
Past performance does not guarantee future results. Financial projections are subject to market conditions and various risk factors, and these forward-looking statements are speculative and subject to change based on market developments.