Most retail options traders make one of two mistakes. They hedge too little and panic when the market drops, or they hedge too expensively and drag their returns buying puts they never end up needing. There is a third way, and it costs almost nothing to run.
Professionals do not simply buy protection and hope for the best. They build layered structures where one leg finances another, where a bearish overlay subsidises itself, and where a portfolio can be profitable in two or three scenarios at once. These mechanics are teachable, and the numbers confirm retail traders are already heading this way: roughly half of all Cboe options volume now involves complex, multi-leg defined-risk orders.
This guide gives you a step-by-step picture of how to combine bullish equity exposure with low-cost bearish overlays. The point is simple: you want to stay in your core positions during a selloff without resorting to panic exits or overpriced insurance.
Why selling calls to buy puts changes everything about hedging costs
Here is the problem you have almost certainly run into. An outright protective put, bought on its own, is expensive. So you buy it once, watch it decay, and then quietly stop buying protection altogether, usually right up until the market drops and you wish you had it back.
The SEBI data behind why most options buyers lose comes down to three compounding forces: theta erosion, implied volatility crush, and the need for direction, magnitude, and timing to align simultaneously, and missing any one of the three produces a loss even when the directional view is right.
The fix is to stop paying for the put out of pocket. Instead of buying protection in isolation, you finance a protective put spread by selling a call spread above the current market. The premium you collect from the short calls subsidises the puts you actually want.
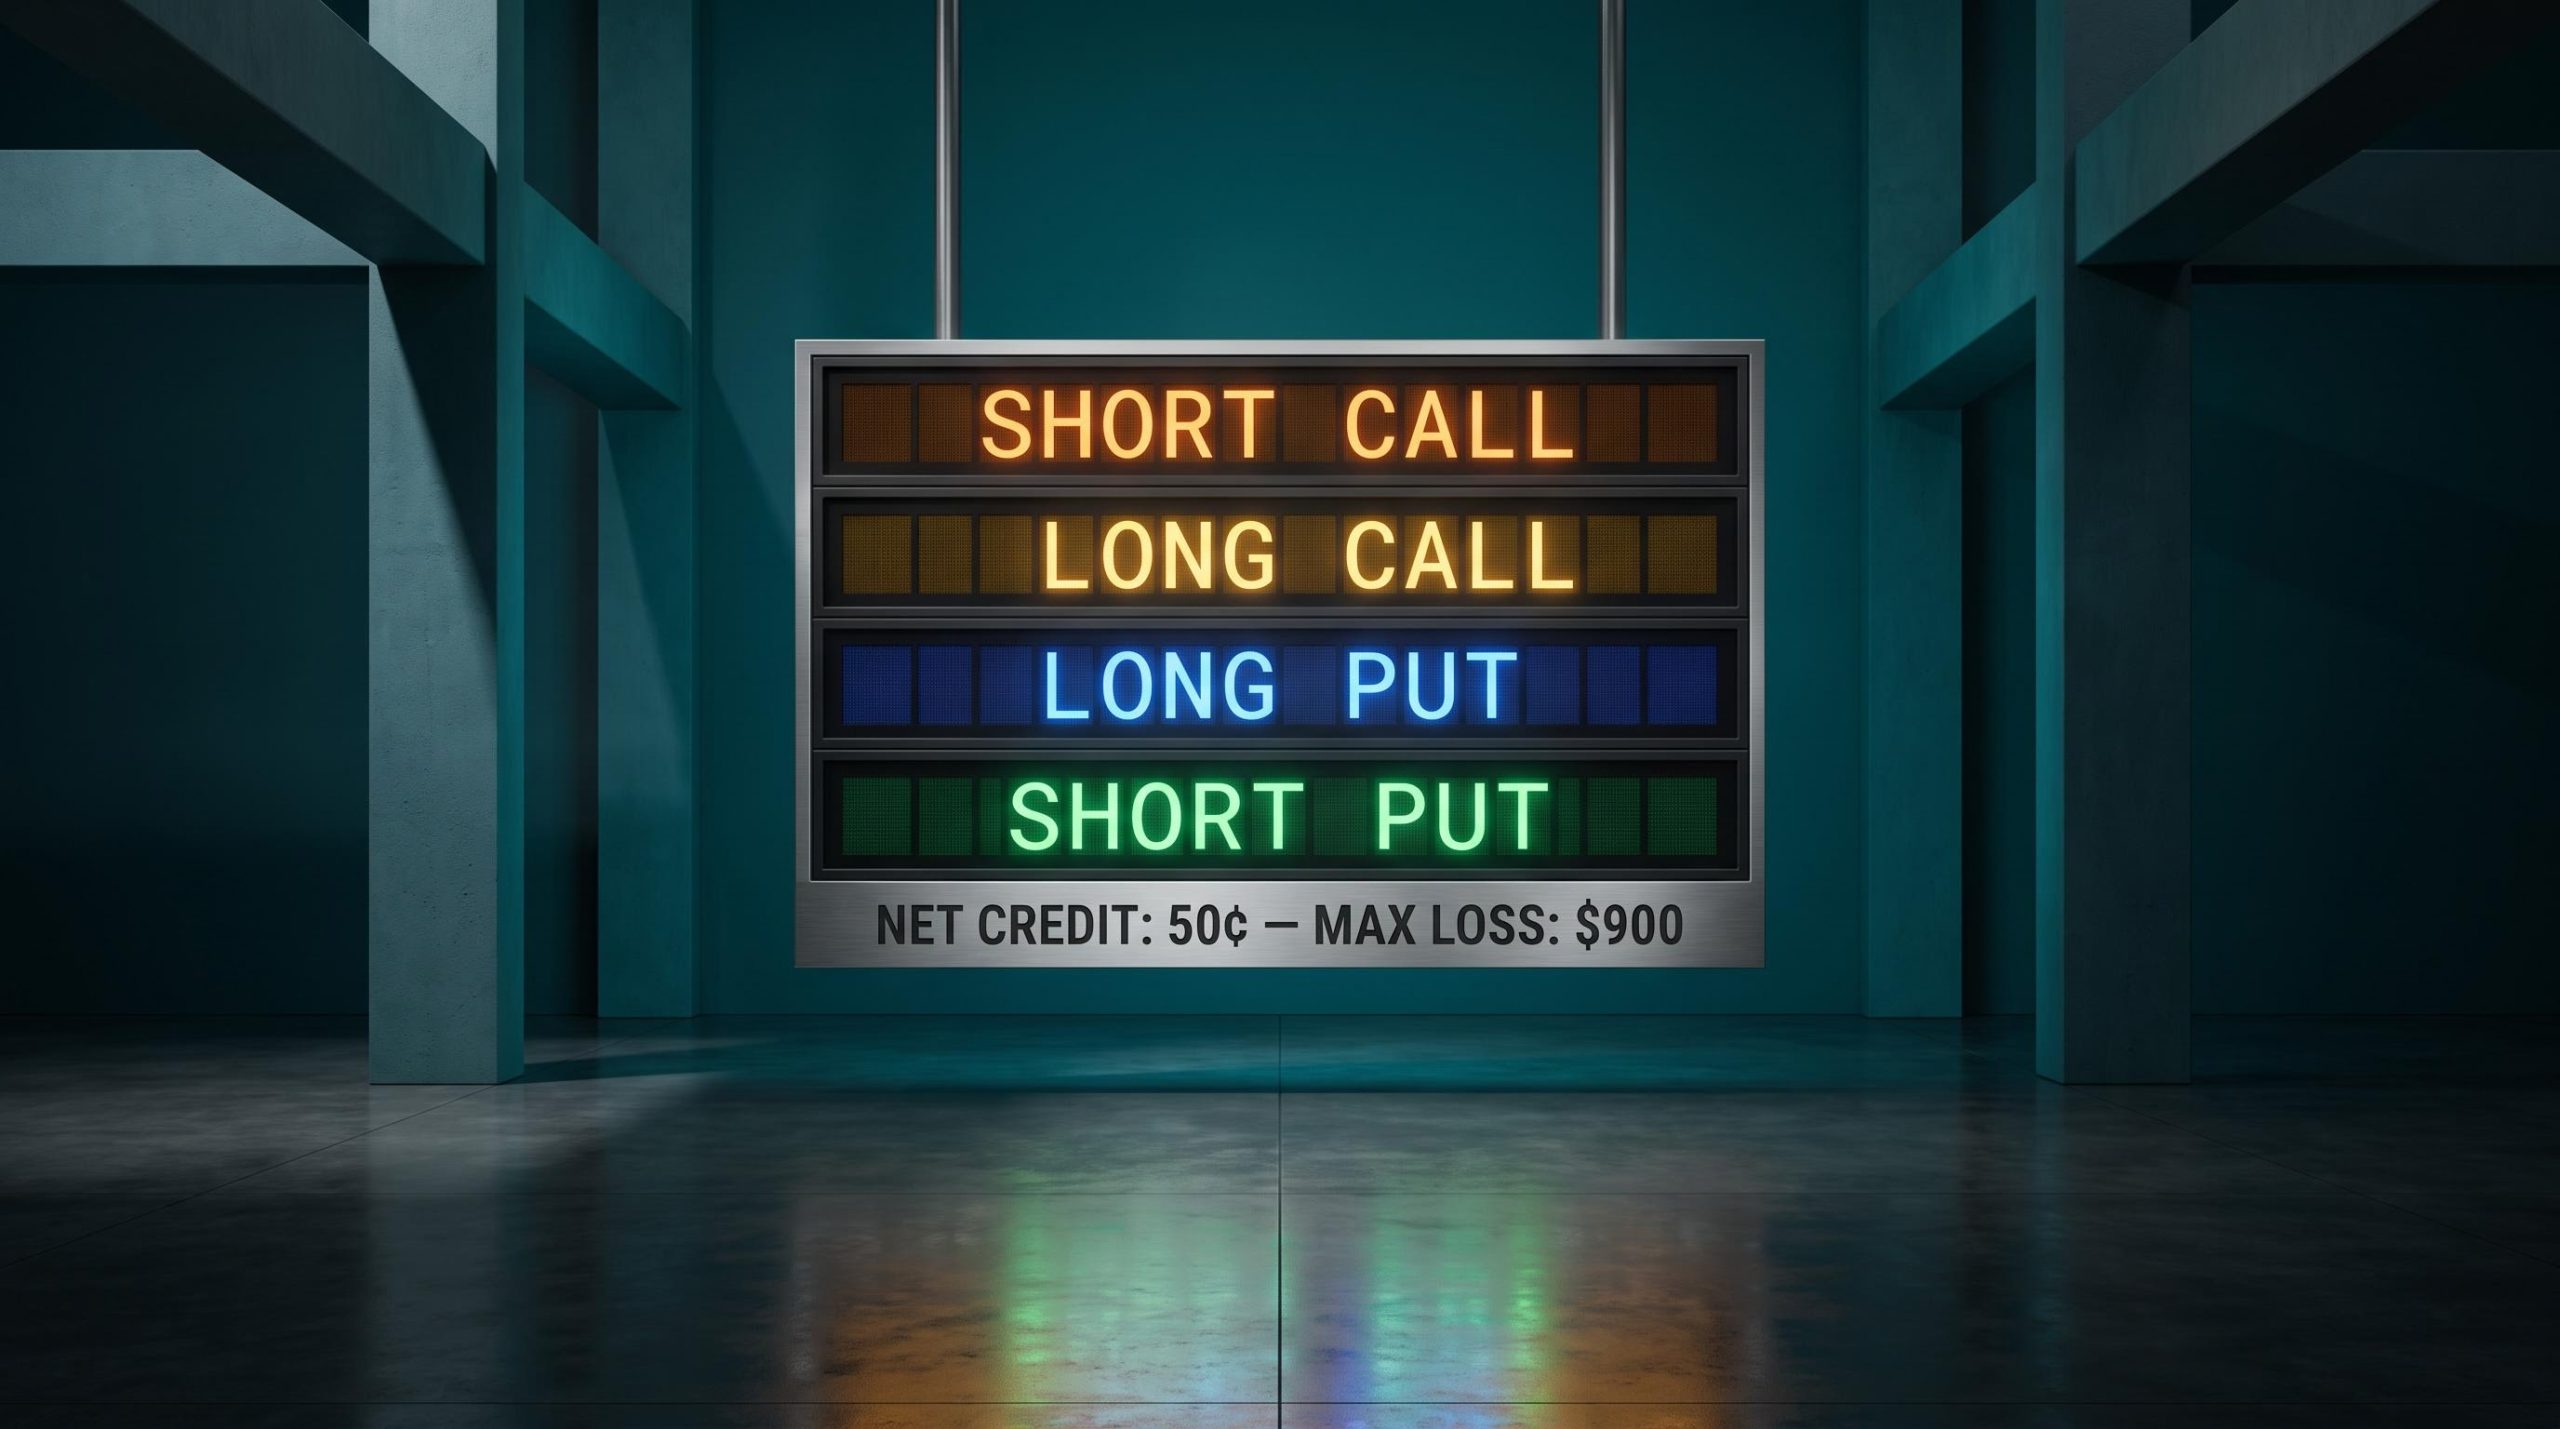
That is the core of what is sometimes called the “Super Bear” structure on the SPX index. In one documented application, a trader entered this four-legged structure for an upfront net credit of roughly 50 cents, while capping the maximum possible loss at around $900.
The Super Bear numbers Net credit of approximately 50 cents. Maximum loss capped at approximately $900.
Read that again, because it reframes the whole question. A structure that pays you a small credit to enter, while mathematically limiting your worst case to $900, tells you that professional-grade downside protection does not have to cost anything upfront. Once the hedge is effectively free, the question of whether to hedge at all disappears.
The structure has four legs, and each one does a specific job.
| Leg | Direction | Strike Zone | Function in the Structure |
|---|---|---|---|
| Short call | Sell | Above current price | Generates the premium that funds the hedge |
| Long call | Buy | Further above current price | Caps the loss if the market rallies hard |
| Long put | Buy | Below current price | The actual downside protection |
| Short put | Sell | Further below current price | Cheapens the protection by capping how far it pays |
The trade-off is your upside. The short call caps how much you make if the market rockets higher, and you accept that ceiling because the hedge is otherwise close to free.
Institutional managers run the same idea. According to Simplify, its Kayne Anderson Energy and Infrastructure Credit ETF (KNLG) buys an at-the-money call, sells a further out-of-the-money call to offset part of that cost, then mirrors the structure on the downside with a sold put financing a purchased protective put. It is the same financing mechanic you can run, scaled to a fund.
When big ASX news breaks, our subscribers know first
What butterfly spreads actually do inside a layered portfolio
Most retail traders meet the butterfly spread as an income trade. Inside a layered portfolio, it is something else entirely: a cheap, asymmetric insurance policy.
A bearish butterfly here is not meant to be your main profit driver. Its job is to offset losses in your bullish core positions when the market sells off, and the maths of that job is what makes it worth understanding.
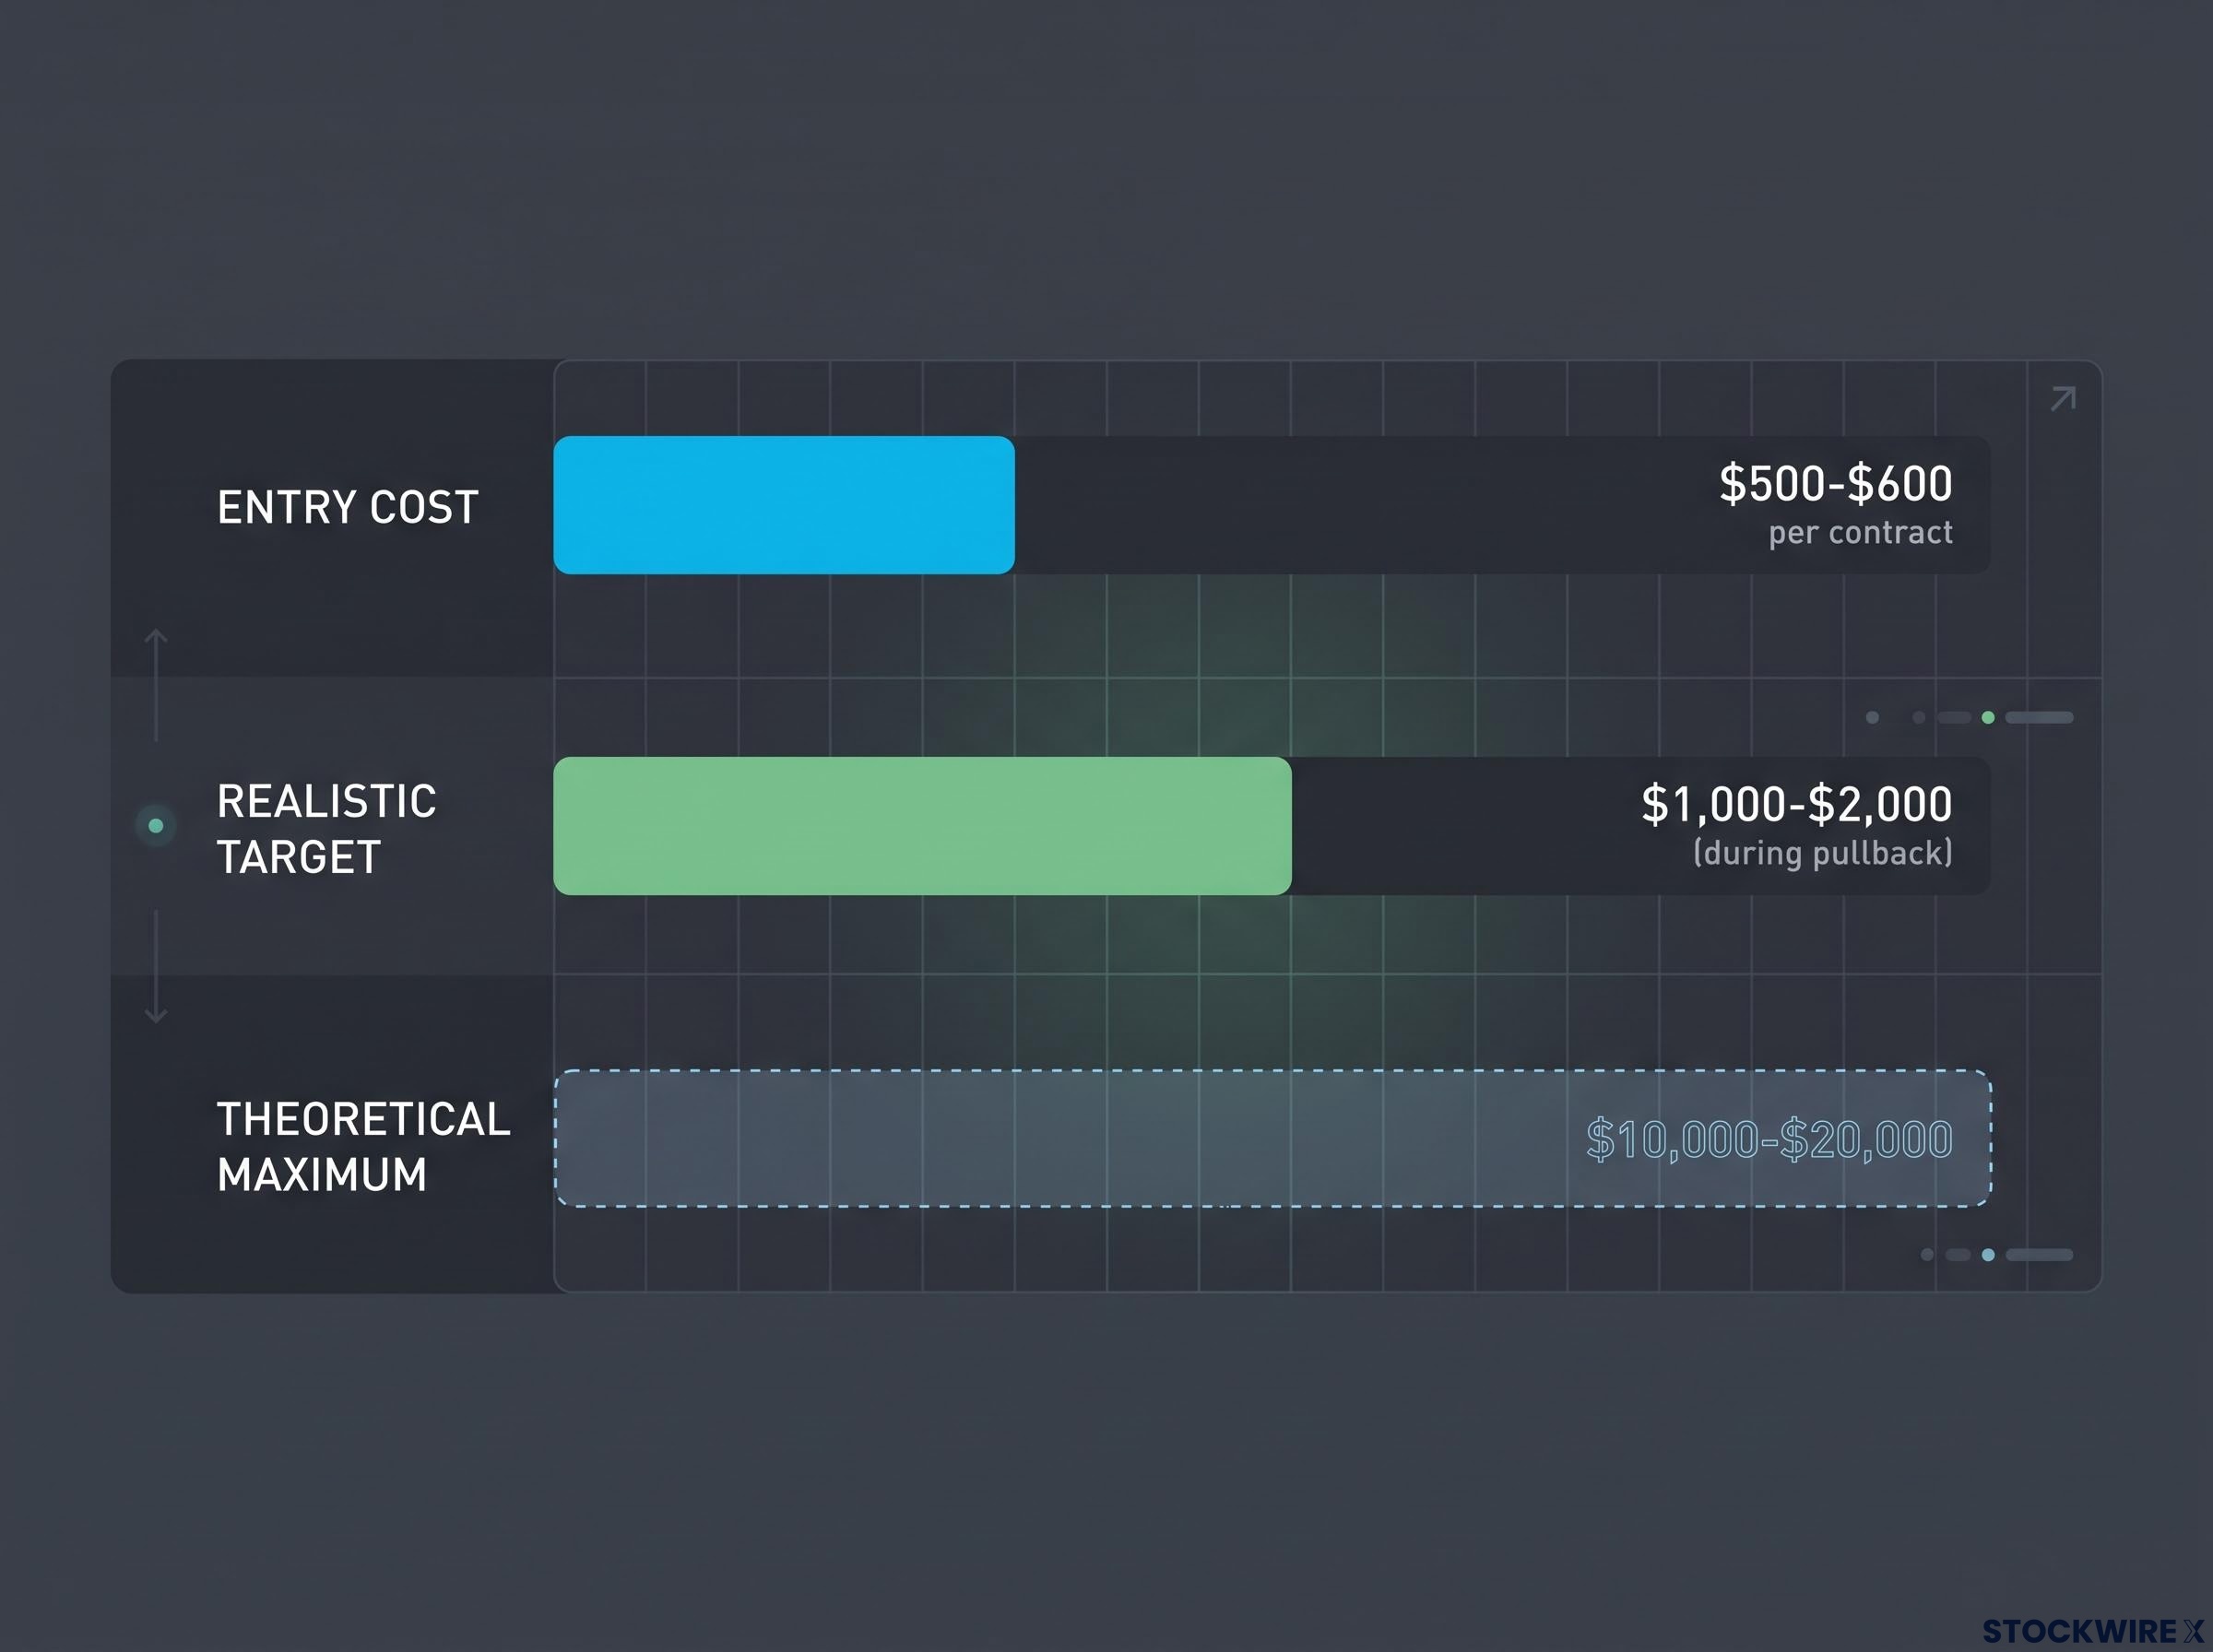
Consider the contrast. In one documented portfolio, butterfly positions were entered at roughly $500-$600 per contract, each carrying a theoretical maximum profit of $10,000-$20,000. During a well-timed pullback, though, the realistic target was more modest: $1,000-$2,000 per position, sized to offset simultaneous losses in longer-dated bullish equity holdings.
That gap matters for how you size these. A $500-$600 cost against a realistic $1,000-$2,000 payoff tells you this is cheap, disposable insurance. It does not need to hit its jackpot maximum to earn its place. The mistake is over-sizing the butterfly to chase the $20,000 headline number instead of treating it as a shock absorber sized to the actual risk it offsets.
The educational platform MyOptionsEdge (2026) points to the SPX butterfly precisely because your maximum loss is known the moment you enter, and the maximum profit sits in a narrow price band around the middle strike. That defined-loss quality is what makes it usable as a hedge rather than a gamble.
Placing one as a hedge comes down to three decisions.
- Choose the body strike relative to the current price. For a hedge, you place it below the market to catch an anticipated pullback.
- Choose the wing width based on how much volatility you expect. Wider wings tolerate a bigger move; narrower wings pay more if the move is precise.
- Choose the expiration based on when you expect the risk event to land.
The failure modes are worth naming. A butterfly can fail if the market crashes violently past your outer wings, or if it rebounds before the price spends time in your profit zone. Timing precision is the price of the low cost.
For readers wanting to build on the sizing framework above before constructing their first bearish butterfly, our full explainer on butterfly spread mechanics covers real NDX examples, 0DTE income applications, and how pairing a bearish put butterfly with a bullish call butterfly covers a two-session selloff-then-recovery scenario.
When butterflies become income trades instead
The same structure flips purpose when you place the body at the current market price rather than below it. This is the zero-days-to-expiration (0DTE) iron butterfly, and here your profit comes from rapid time decay rather than any directional move.
Research on these income trades cites a risk convention worth borrowing: maximum risk per trade typically calibrated to roughly 10% to 17% of total account size.
Keep the two uses separate in your head. The hedging butterfly sits below the market and protects your core; the income butterfly sits at the market and harvests decay. Conflating them is exactly how traders end up oversized in the wrong tool at the wrong time.
How market selloffs actually work, and why your hedge must be ready before they start
There is a reason your hedge has to be on before the drop, not after, and it starts with how you are wired.
Daniel Kahneman and Amos Tversky’s prospect theory established that investors feel losses more intensely than equivalent gains. The practical result is that fear moves faster than greed.
Investors are significantly more sensitive to losses than gains, leading to abrupt panic-selling and more gradual profit-taking during rallies.
Robert Shiller documented the next layer: negative news triggers herd behaviour and compounding feedback loops. One seller becomes ten, ten become a hundred, and the move builds on itself.
Then the machines join in. Selloff velocity gets amplified by mechanical forces that have nothing to do with anyone’s opinion of the news.
- Loss-aversion selling as individual investors cut positions to stop the pain.
- Herd behaviour feedback as falling prices trigger more selling.
- Margin call forced liquidation as leveraged accounts are closed out automatically.
- Dealer gamma-driven shorting, the least visible and often the most powerful.
That last one deserves attention. When options dealers are short gamma, a falling market forces them to short more of the underlying to stay hedged, which pushes the price down further, which forces more shorting. The market is partly manufacturing its own velocity.
Here is what that means for you. A falling market is not simply reflecting bad news; it is accelerating itself through mechanical selling. So by the time you decide to buy protection, implied volatility has already spiked, and the hedge you wanted now costs far more than it would have the day before.
The scale of this market is not small. Retail traders executed more than 12.22 billion options contracts in 2024, a record according to Options Clearing Corporation (OCC) data. That is the environment your hedge has to survive, and it is why systematic hedgers pre-position while panic buyers pay top dollar for protection that arrives late.
Sizing undefined-risk trades so the market cannot force your hand
Everything above assumes you are still in the game when the selloff hits. Position sizing is what keeps you there, and this is where most retail losses actually originate.
Start with what makes a position dangerous. An undefined-risk position, such as a naked short put or a short strangle, exposes you to theoretically unlimited losses. That open-ended exposure is what triggers fight-or-flight thinking during a sudden move, and fight-or-flight is where good plans go to die.
The principle is straightforward. Size any undefined-risk trade so that a move of two or three standard deviations threatens the position, not the account. If a single bad day can take down your whole account, the market, not your plan, decides when you exit.
Consider a documented example of what happens when discipline slips. One trader held a Treasury futures long position beyond the planned timeframe out of stubbornness and took a realised loss, even while running four profitable options trades in the same week through disciplined sizing. That tells you something uncomfortable: even a well-run portfolio can hand back a week’s gains on one oversized position held past its plan. The fix is structural, not a matter of trying harder.
This matters especially to you if you trade simply, and most retail traders still do. An estimated 70-80% of retail options trades still involve just 1-10 contracts and single-leg directional bets, which is exactly the profile most exposed to sizing errors.
The structural tools, in order of implementation priority, are these.
- Define risk mathematically by converting naked shorts into spreads and collars, which caps your maximum loss.
- Pair positions with offsetting hedges so a loss in one place is structurally cushioned by a gain in another.
- Use rule-based automated exits, such as cutting at a set percentage of maximum loss, to remove in-the-moment emotion.
- Avoid highly leveraged, ultra-short-dated naked positions, which empirically produce the worst outcomes.
The point of conversion becomes obvious when you see it side by side. The same directional view can be expressed with wildly different risk profiles, and the risk profile determines how you behave under stress.
| Position Type | Risk Profile | Psychological Effect |
|---|---|---|
| Naked short put | Undefined, large downside | Triggers panic on sharp moves |
| Short put spread | Defined, capped loss | Removes the tail-risk trigger |
| Iron condor | Defined on both sides | Calm through range-bound moves |
| Bearish butterfly | Defined, known at entry | Disposable, low emotional weight |
Sizing and defined-risk conversion are not conservative concessions. They are the mechanical tools that keep you in the game long enough for the strategy to actually work.
Defined-risk conversion is not simply a conservative preference: across a five-year study period that included the April 2025 drawdown, put spreads outperformed naked short puts on a per-dollar-of-capital basis, and a win-rate differential of just two percentage points was enough to erase the entire cumulative advantage of the naked strategy.
Building Plan A and Plan B into a single portfolio structure
Now the pieces come together. A layered portfolio runs a Plan A and a Plan B at the same time, on purpose.
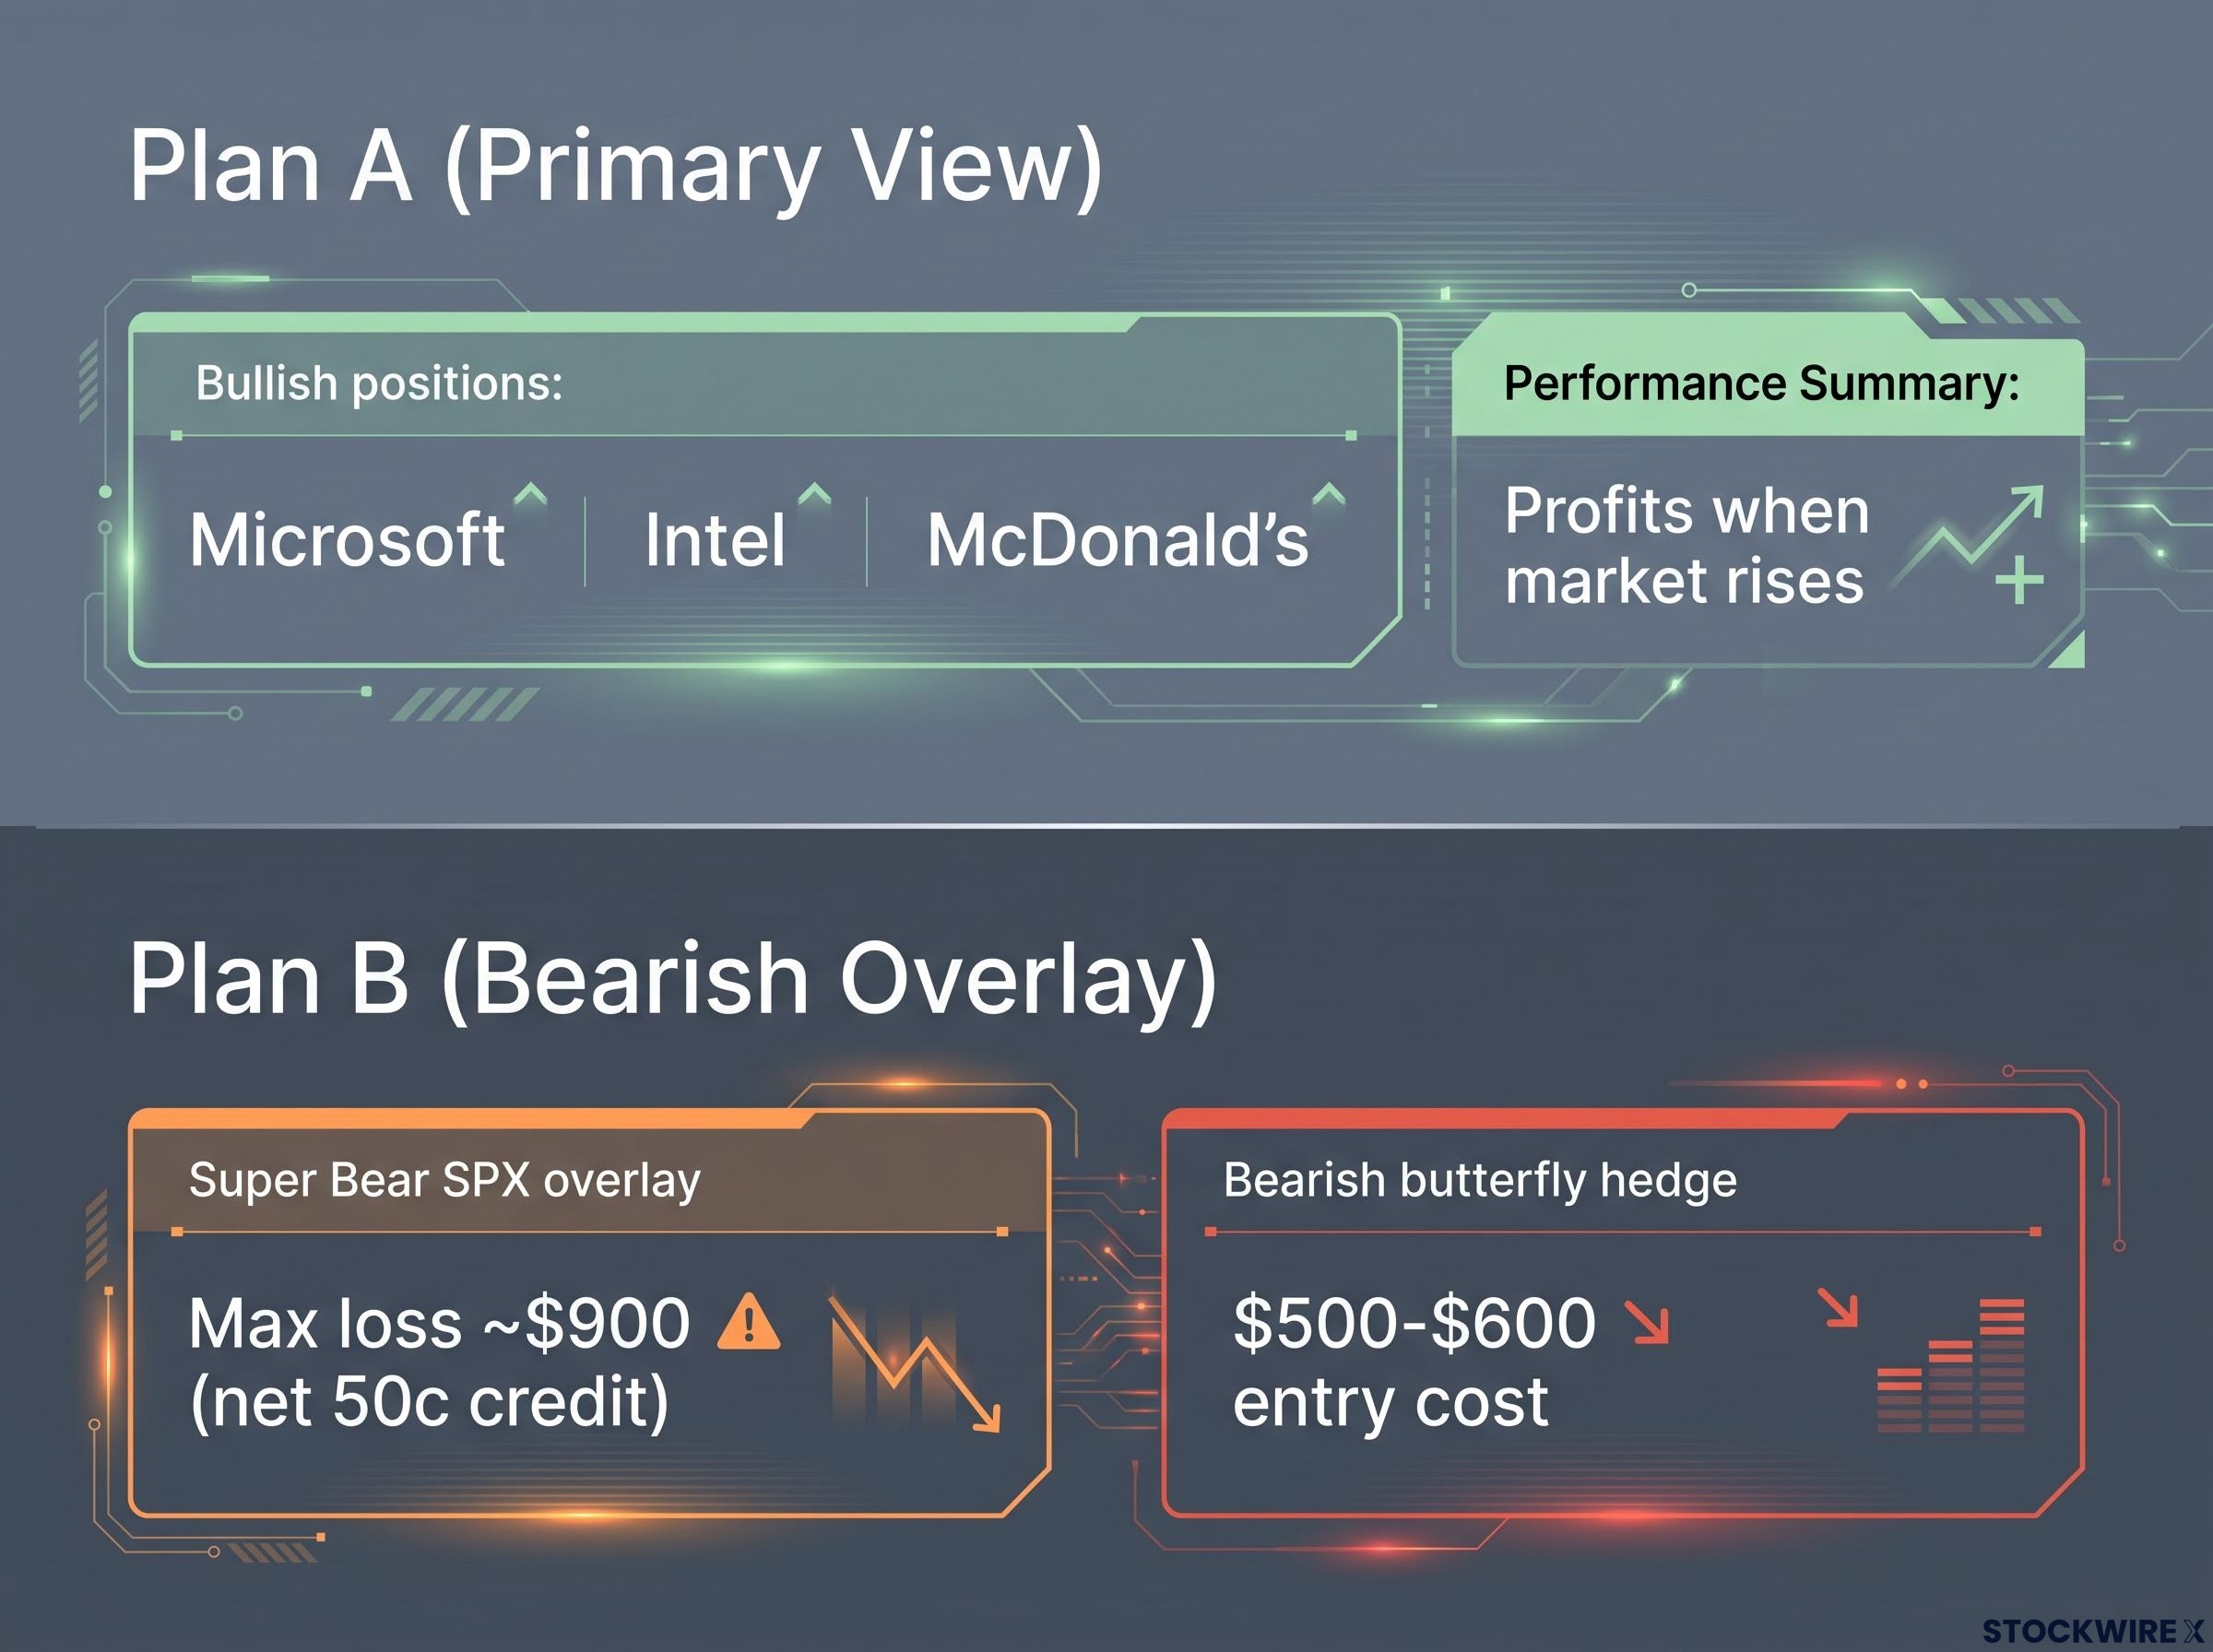
Plan A is your primary directional view. In one documented example, that meant bullish positions in Microsoft, Intel, and McDonald’s as the core equity exposure.
Plan B is the bearish overlay, built to be profitable if Plan A fails over a defined window. That is where the Super Bear SPX structure and the bearish butterflies come in.
How the layers interact in different scenarios
The elegance is in how the layers behave depending on what the market does.
If the market rallies, Plan A profits. Your butterfly expires worthless at a small, known cost, and that cost is simply the price of having been insured.
If the market sells off, Plan B does its job. The Super Bear overlay and the butterflies profit while your equity positions draw down, but crucially, you are not forced into a panic exit because your downside is already accounted for.
| Layer | Instrument | Profits When | Max Loss Per Unit |
|---|---|---|---|
| Plan A | Equity long (MSFT, INTC, MCD) | Market rises | Position-dependent |
| Super Bear SPX overlay | Call spread funding put spread | Market sells off | ~$900 (net 50c credit at entry) |
| Bearish butterfly hedge | SPX butterfly below market | Moderate pullback | $500-$600 entry cost |
The common mistake is abandoning the hedge when it is not paying off. But the continuity of the bearish overlay is precisely what gives Plan A its staying power. Cut the hedge in a quiet market and you are exposed the moment volatility returns.
What basis risk means for individual stock portfolios
One caveat you cannot ignore. SPX options reflect index-level moves, not the volatility of any single stock you own.
SPX options hedge the index. Individual stock positions carry residual single-stock risk that the overlay does not cover.
So if one holding drops 20% while the index falls only 5%, the SPX overlay will not meaningfully cover that gap. You have two practical responses: size your equity positions modestly relative to the overlay, or add single-stock puts on your largest individual holdings as a supplemental layer. No hedge is perfect, and the goal here is not to eliminate risk but to stay solvent and calm enough to hold your view through a drawdown.
Putting the framework to work when markets are not cooperating
You do not need to rebuild your whole portfolio to use any of this. You need one adjustment, made deliberately, before your next position goes on.
Before entering anything, work through three decisions in order.
- Confirm your Plan A sizing and time horizon. Know how much you hold and how long you intend to hold it.
- Choose your downside overlay. Decide whether the protection is a Super Bear credit structure, a bearish butterfly, or both.
- Set the rule-based exit for each leg before you place the trade. The exit rule written in advance is the one you will actually follow.
Accept from the start that this will not always work cleanly. Butterflies expire worthless, Super Bear structures get tested by sharp rallies, and both need re-entering periodically. That is maintenance, not failure.
The four-trade winning week alongside the single losing Treasury position makes the point plainly: disciplined structure produces net-positive outcomes even when individual legs miss. You are not aiming for a perfect record; you are aiming to survive the bad ones.
For readers wanting to extend this framework beyond index options into a full portfolio defence, our dedicated guide to professional downturn protection covers the three-layer structure combining value equity selection, a tail-risk sleeve of deep OTM index puts, and a liquidity buffer that addresses forced selling at the bottom.
You are also not doing anything exotic. Cboe reports that roughly half of all volume on its options exchange sits in complex, multi-leg orders with capped downside risk. Layered, defined-risk positioning is now the dominant structural choice across the largest options market in the world, which means choosing not to use it is the genuinely contrarian bet.
A trader who knows their maximum loss on every position can hold their core view through volatility. That is the actual edge.
Defining risk mathematically removes the tail-risk scenarios that trigger panic, and panic is the root cause of most retail options losses. Get your worst case fixed in advance, and you free yourself to stay in the trade.
This article is for informational purposes only and should not be considered financial advice. Investors should conduct their own research and consult with financial professionals before making investment decisions. Past performance does not guarantee future results. Options trading carries substantial risk and is not suitable for all investors.