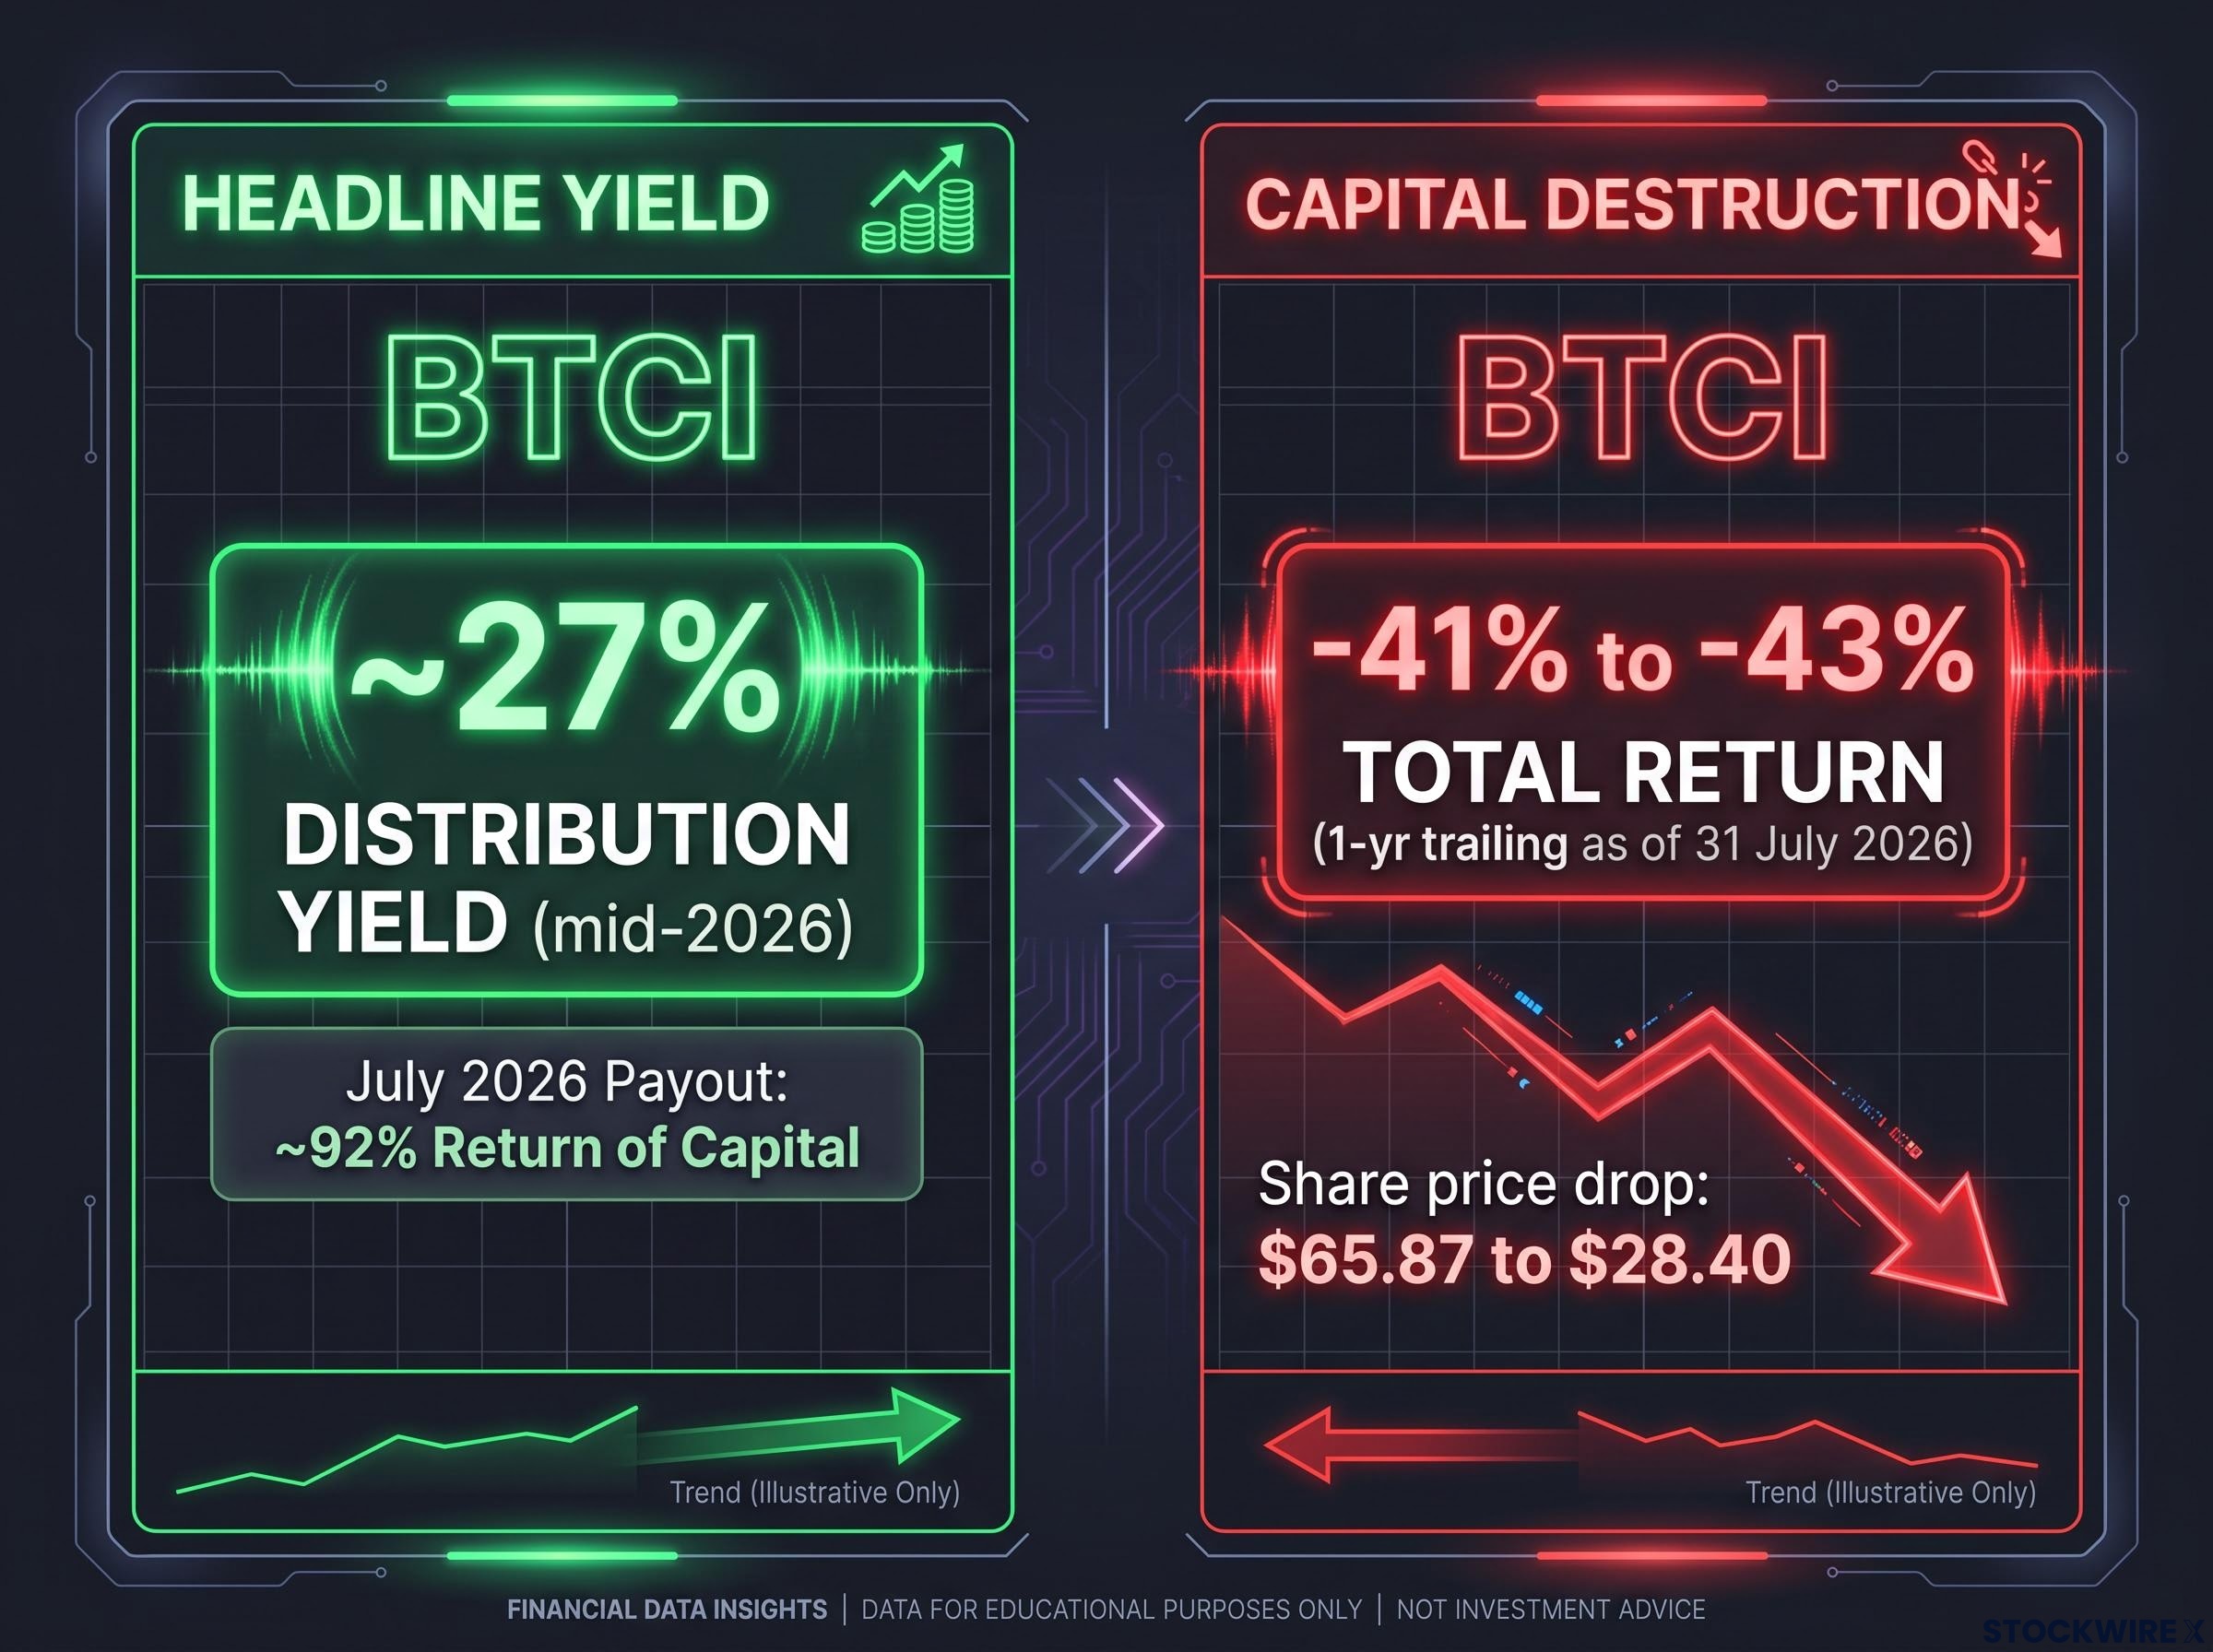
A Bitcoin income fund can advertise a 27% annual yield and still destroy your capital. In 2026, the flagship product in this space did exactly that: a 27% headline yield paired with a one-year loss of more than 41% on net asset value.
That gap between what a fund pays out and what it actually returns has become the defining feature of options-based income products. The hunt for yield has pushed well beyond the S&P 500 and into the highest-volatility corners of the market: the Nasdaq 100, the technology sector, and cryptocurrency itself.
These alternative income ETFs have multiplied fast, but their structural differences produce performance gaps that catch casual investors off guard. Here is a framework for evaluating complex options-based ETFs, so you can tell which high-yield structures preserve wealth and which quietly erode the capital underneath them.
Evaluating the 2026 Nasdaq and technology income landscape
Start with the scoreboard, because it does not read the way brand reputation would predict. Among Nasdaq 100 covered call funds, QQQI from NEOS finished last on total return over the past year, a result that is genuinely hard to reconcile with the provider’s strong standing in the options-income category.
Meanwhile, QYLD, one of the older and less fashionable names, outperformed several newer Nasdaq income funds on total return. That is the kind of upset that should make you question any allocation built on how well-regarded a fund family is rather than what its numbers actually say.
Zero-DTE (zero days to expiration) strategies told a cleaner story. Among the funds reviewed, T-DAC most closely tracked the Nasdaq 100 total return, suggesting these daily-premium structures are tracking their benchmark effectively on this index.
The technology sector produced the standout winners. XLK, the SPDR Technology Sector fund, and its covered call sibling XLKI led total return among technology-focused income ETFs. The driver was concentration: heavy exposure to Nvidia carried the bulk of the return. Note the trade-off in what XLK owns, because Amazon and Tesla are excluded, classified under consumer sectors rather than technology.
This is the point you need to internalise. When you look under the hood of a tech income ETF, a handful of mega-caps like Nvidia are likely driving most of your total return, not the options overlay you are paying for.
| Fund Ticker | Strategy Type | Benchmark | Key Performance Note |
|---|---|---|---|
| QQQI | Nasdaq covered call | Nasdaq 100 | Ranked last on total return despite provider reputation |
| QYLD | Nasdaq covered call | Nasdaq 100 | Surprised by outperforming several newer funds |
| T-DAC | Zero-DTE | Nasdaq 100 | Closest tracking of the underlying index |
| XLKI | Sector covered call | XLK (Technology) | Led total return on heavy Nvidia concentration |
Tech sector concentration risks
Funds like XLKI demand a high tolerance for single-company exposure. If you are comfortable with Nvidia doing the heavy lifting, that suits pure technology positioning; if you are not, that concentration is your primary risk. AIPI, also from NEOS, takes a slightly more aggressive route by focusing on AI-related names, while EGGY stood out for a notably high distribution yield and, when the comparison window is extended by excluding the recently launched XLKI, actually outperformed the Nasdaq index over the maximum available timeframe.
When big ASX news breaks, our subscribers know first
The educational mechanics of selling upside on high-growth assets
Now for the why. A covered call ETF holds a basket of assets and sells call options against them. A call option gives the buyer the right to purchase those assets at a set price, and in exchange the fund collects a premium, cash it can distribute as income.
The catch is that selling the call caps how much the fund can gain if the underlying assets rise sharply. You collect cash today in return for surrendering future appreciation. That trade sits at the heart of every headline yield in this category.
Write those options on highly volatile assets like technology stocks or cryptocurrency and the maths intensifies. Higher volatility means fatter option premiums, so the income swells. It also means the capped upside costs you far more during a strong rally, and the underlying asset can still fall hard in a downturn.
This is why the standings from the previous section make sense. The analysis suggests poor performance in this category stems more from stock selection and weighting decisions than from the covered call mechanism itself. The engine is not broken; the fuel choice determines the outcome.
Return of capital components in high-distribution covered call funds can erode NAV by 5-10% annually, making screener yields an unreliable basis for comparison and exposing a gap that only becomes visible when total return data is placed alongside the headline distribution figure.
Zero-DTE strategies attempt to sidestep some of that capped-upside problem by selling options that expire the same day. The fund captures daily premium without locking in a long-dated ceiling on gains, and the general view is that this approach currently works better on the Nasdaq 100 than on the S&P 500.
When you buy a high-yielding covered call ETF, you are explicitly trading tomorrow’s capital appreciation for cash today. That transaction becomes dangerous in exactly the conditions many investors hope for or fear most:
- Strong, sustained bull markets in the underlying asset, where repeated call-writing keeps selling away the upside and total return lags the index even as distributions look generous.
- Prolonged bear or high-volatility drawdowns, where premiums and distributions cannot offset a falling asset, producing large losses and heavy return-of-capital payouts.
- Long holding periods, over which compounding capital losses and foregone gains erode wealth relative to simply owning the underlying.
That framework is the foundation for judging any income ETF, and it is what makes the double-digit yields in the leveraged and crypto corners so easy to misread.
Leveraged income structures and the amplification of risk
If a capped-upside strategy already trades away appreciation, what happens when you add leverage to it? Early 2026 answered that question with a new wave of boosted covered call ETFs, and the results complicate the simple assumption that more leverage means more danger.
Two names anchor this space. XQQI, the boosted version of QQQI, launched around February 2026. XBCI, the leveraged Bitcoin sibling detailed in the next section, arrived on the same structural template.
How the synthetic leverage works
NEOS builds these boosted funds using a synthetic index options approach, targeting roughly 150% exposure to the underlying strategy. Rather than borrowing to buy more shares, the fund uses options positions to amplify its exposure to the same covered call approach it already runs.
The counterintuitive result is the one worth pausing on. The leveraged XQQI outperformed during the review period while its non-leveraged sibling QQQI lagged its peers. Strong Nasdaq performance in the weeks before the review flattered the leveraged version, which magnified the upside the underlying strategy was capturing.
On the Bitcoin side, the leverage effect was even starker. XBCI delivered roughly double the total return of non-leveraged BTCI over the comparison period. TappAlpha offers a different flavour in the Nasdaq space with T-DAX, a 130% daily leveraged version of T-DAC.
Treat these products not as set-and-forget income generators but as tactical, high-maintenance instruments. Leverage magnifies your sequence-of-returns risk, meaning the order in which gains and losses arrive matters far more to your final outcome.
The upside capture dilemma
During a rapid rally, leveraged covered call funds can shine, amplifying whatever upside the capped strategy manages to keep. That is precisely what powered XQQI and XBCI in their short lives so far.
The mirror image is unforgiving. According to TechTimes, XBCI’s 150% exposure magnifies the same trade-offs seen in its unleveraged parent: when the asset sells off, leveraged exposure drives larger NAV drawdowns, and over a prolonged drawdown those compounding capital losses can gut a position. Active monitoring is not optional here.
Daily rebalancing amplification in leveraged ETFs forces these products to sell into falling markets to restore their target exposure ratio, a mechanical behaviour that becomes particularly consequential when a leveraged covered call fund is already absorbing NAV drawdowns from both the options overlay and the underlying asset declining simultaneously.
Bitcoin yield and the contradiction of institutional validation
Nowhere is the yield-versus-capital tension more brutal than in Bitcoin covered call funds, and nowhere has the institutional response been louder. BTCI, the NEOS Bitcoin High Income ETF, carried a distribution yield of roughly 27% as of mid-2026 while its trailing one-year total return sat in the range of -41% to -43% as of 31 July 2026.
The composition of that yield is the tell. CryptoSlate estimated that approximately 92% of BTCI’s July 2026 payout was classified as return of capital, meaning most of what the fund handed back to investors was their own money, not income generated by the strategy. TheStreet reported the share price fell from a 52-week high of $65.87 to around $28.40 over the same window.
Analyst warning Eric Balchunas, Senior ETF Analyst at Bloomberg Intelligence, has noted that selling calls against a highly volatile asset like Bitcoin converts price rallies into income, causing the fund to underperform spot Bitcoin severely in strong bull markets while still suffering large losses in bear markets.
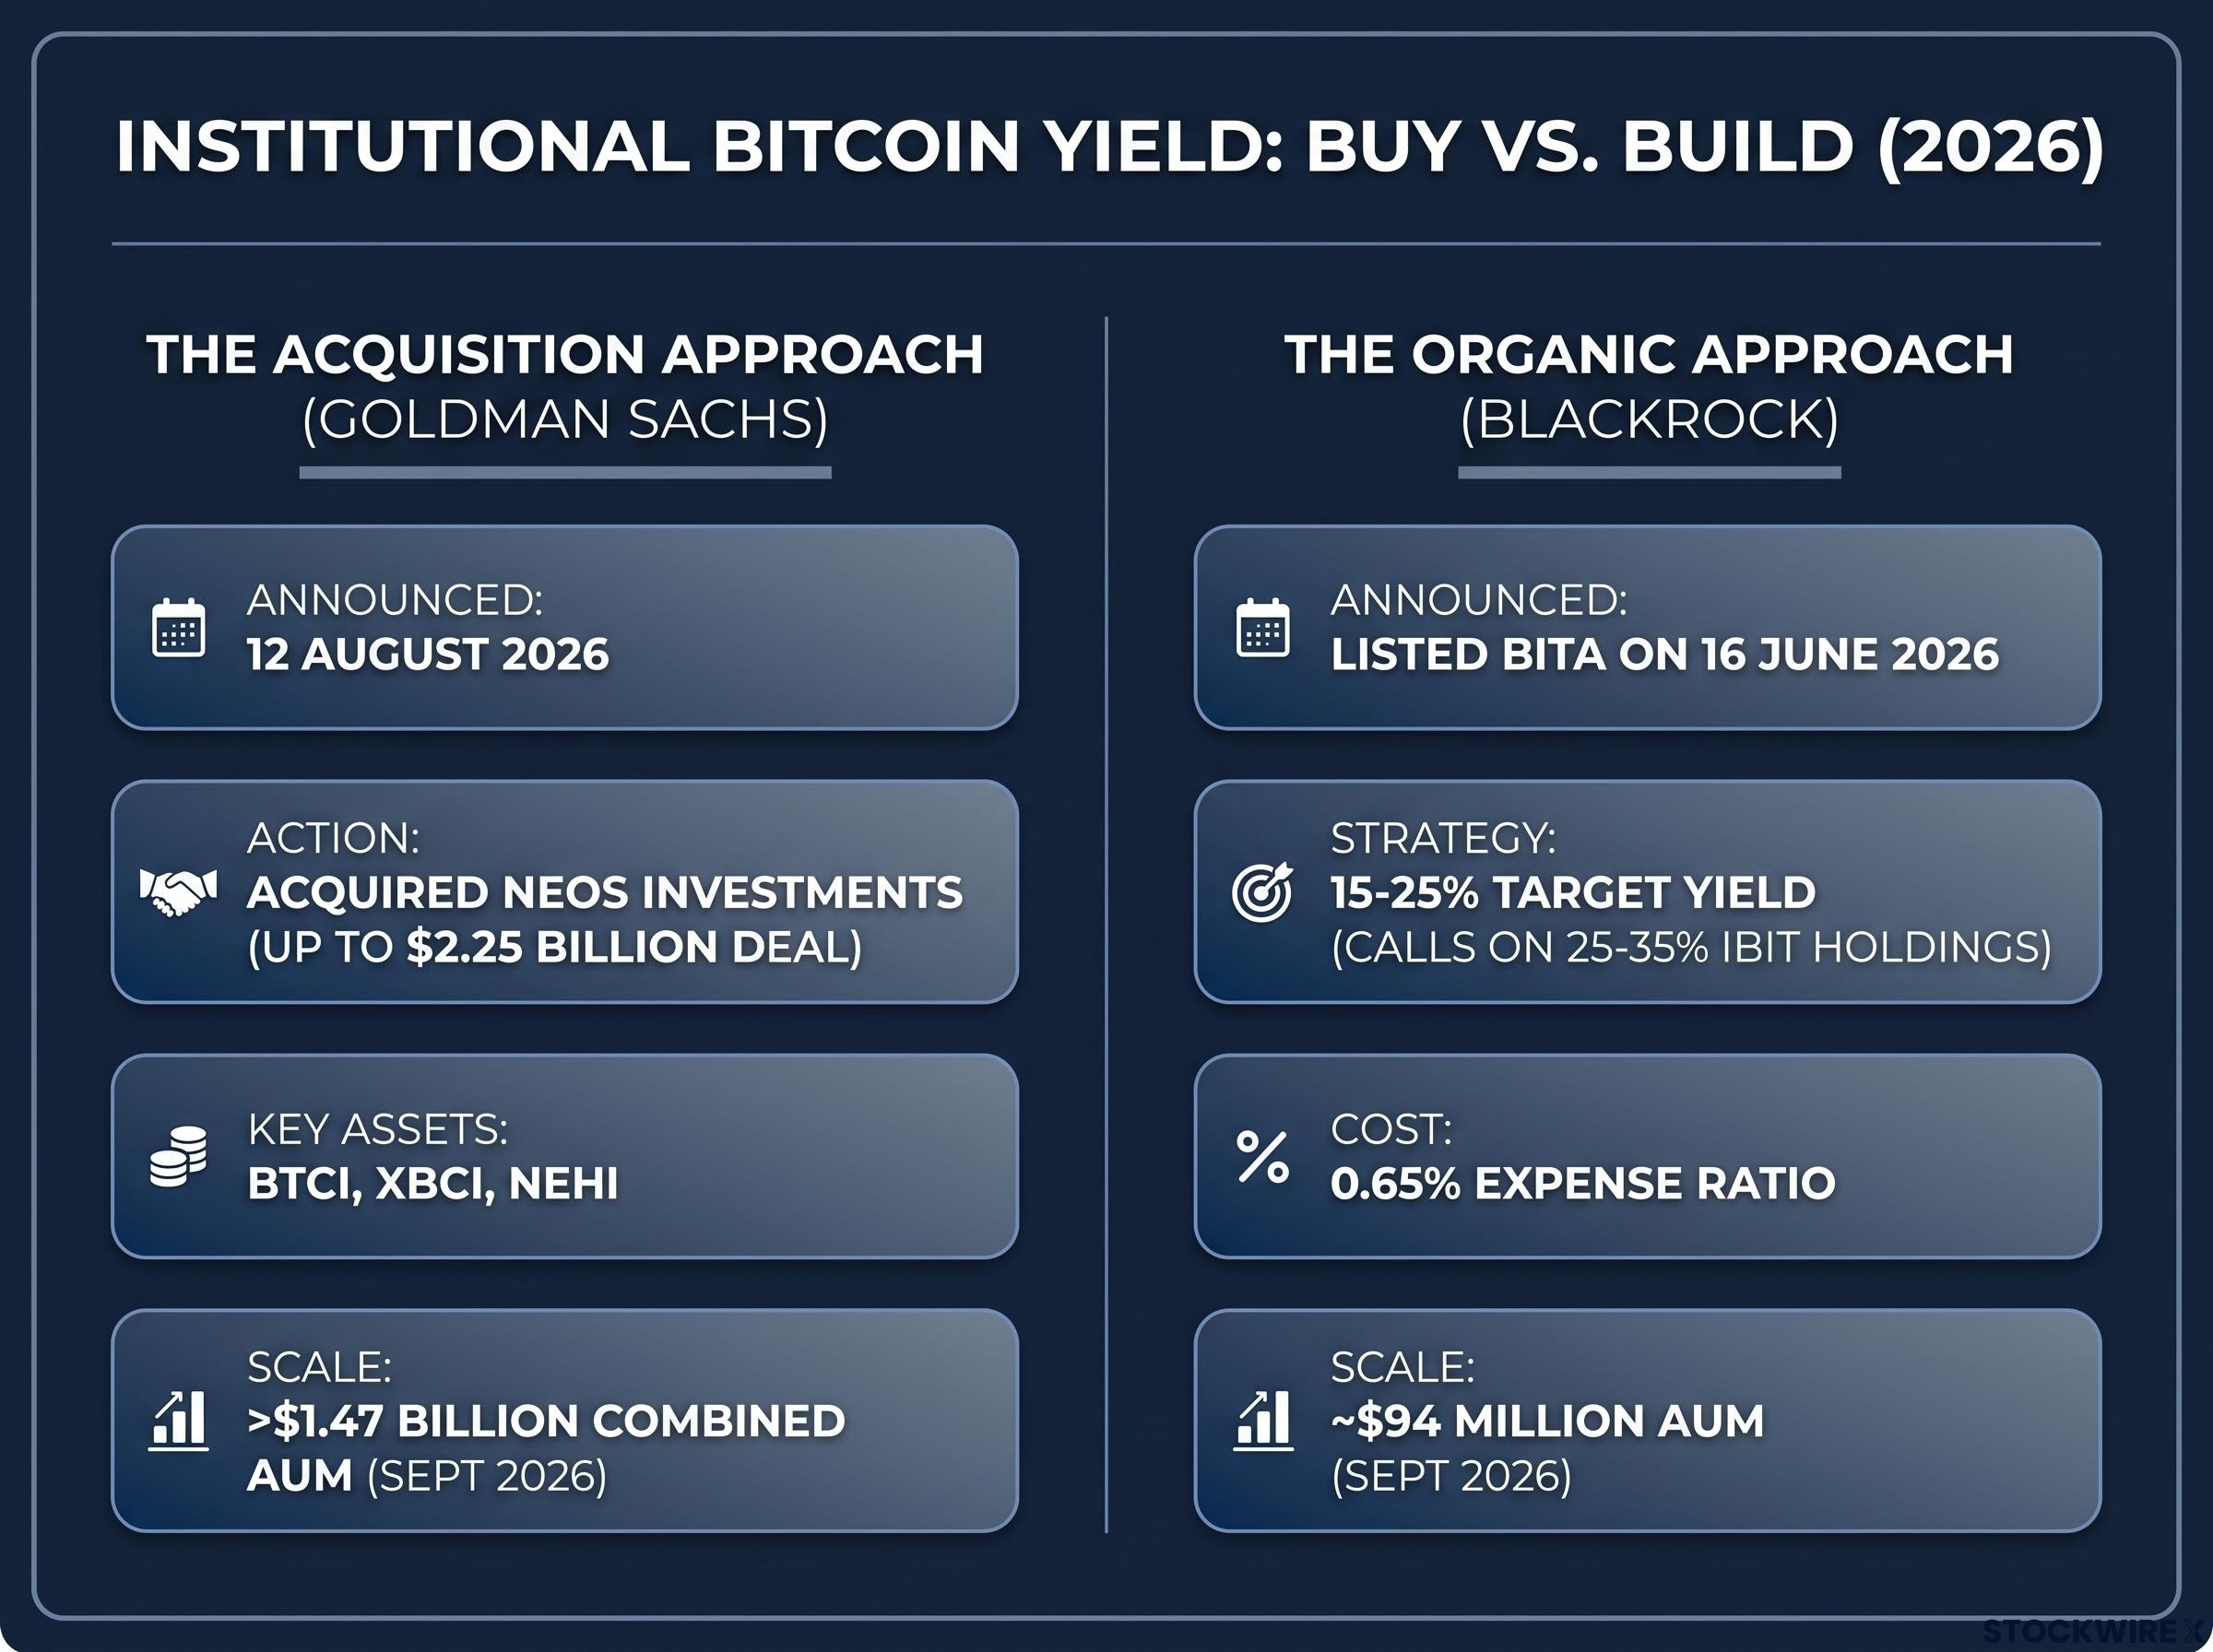
Against that backdrop, the industry’s biggest players placed their bets in opposite ways. On 12 August 2026, Goldman Sachs announced an agreement to acquire NEOS Investments, the systematic options-income specialist behind BTCI, in a deal valued at up to $2.25 billion and expected to close in Q1 2027.
The acquisition scoops up BTCI, XBCI, and NEHI, three crypto-linked covered call funds managing more than $1.47 billion combined as of September 2026. Reuters framed the move as Goldman doubling down on active ETFs. Goldman had earlier filed for its own Bitcoin Premium Income ETF but never launched it, choosing instead to buy scale rather than build a more conservative product from scratch.
Compare that with BlackRock’s slower, organic route. BlackRock listed BITA on Nasdaq on 16 June 2026, targeting roughly a 15-25% annual yield by selling covered calls on around 25-35% of its IBIT holdings, at an expense ratio of 0.65%. By September 2026 it had gathered only about $94 million in assets, a fraction of what Goldman acquired in a single transaction.
The contradiction is the point. Goldman’s willingness to pay billions tells you these high-yield crypto products are here to stay and that big banks see durable fee revenue in them. It does not tell you the funds will preserve your capital, because that responsibility remains entirely yours.
Bitcoin concentration risk takes a different form in preferred equity structures like STRC, where a 12% headline yield maps to CCC-rated credit risk, perpetual duration, and board dividend discretion, illustrating that the yield-versus-capital tension described in covered call ETFs reappears across every Bitcoin-linked income product regardless of its legal wrapper.
This article is for informational purposes only and should not be considered financial advice. Investors should conduct their own research and consult with financial professionals before making investment decisions. Past performance does not guarantee future results. Financial projections are subject to market conditions and various risk factors.
Calibrating your yield strategy for complex asset classes
The through-line across tech and crypto is a single tension: a high distribution rate is not the same as a high total return, and the two frequently move in opposite directions. Commercial success and swelling AUM do not translate into wealth preservation for a retail portfolio, as BTCI’s 27% yield sitting atop a 41%-plus one-year loss makes plain.
A workable decision framework starts with what you actually want. If you prioritise total return, broad index coverage or sector funds riding genuine winners like Nvidia have carried the load, not the options overlay. If you want maximum income and can tolerate capital erosion, the covered call and leveraged structures deliver yield, provided you monitor them actively rather than treating them as passive holdings.
Watch the Goldman integration of NEOS closely through 2027. The most important variable is whether Goldman adjusts fees, option-overlay parameters, or investor communication once these funds sit under its brand. That decision will shape whether the retail investor keeps absorbing the structural risk or finally gets a more conservative version of the trade.
For investors wanting to apply the Nasdaq-versus-S&P income framework to specific leveraged covered call products, our full explainer on QQCL versus USCL examines how 25% leverage interacts with each index’s volatility profile to produce divergent income and total return outcomes across market cycles.