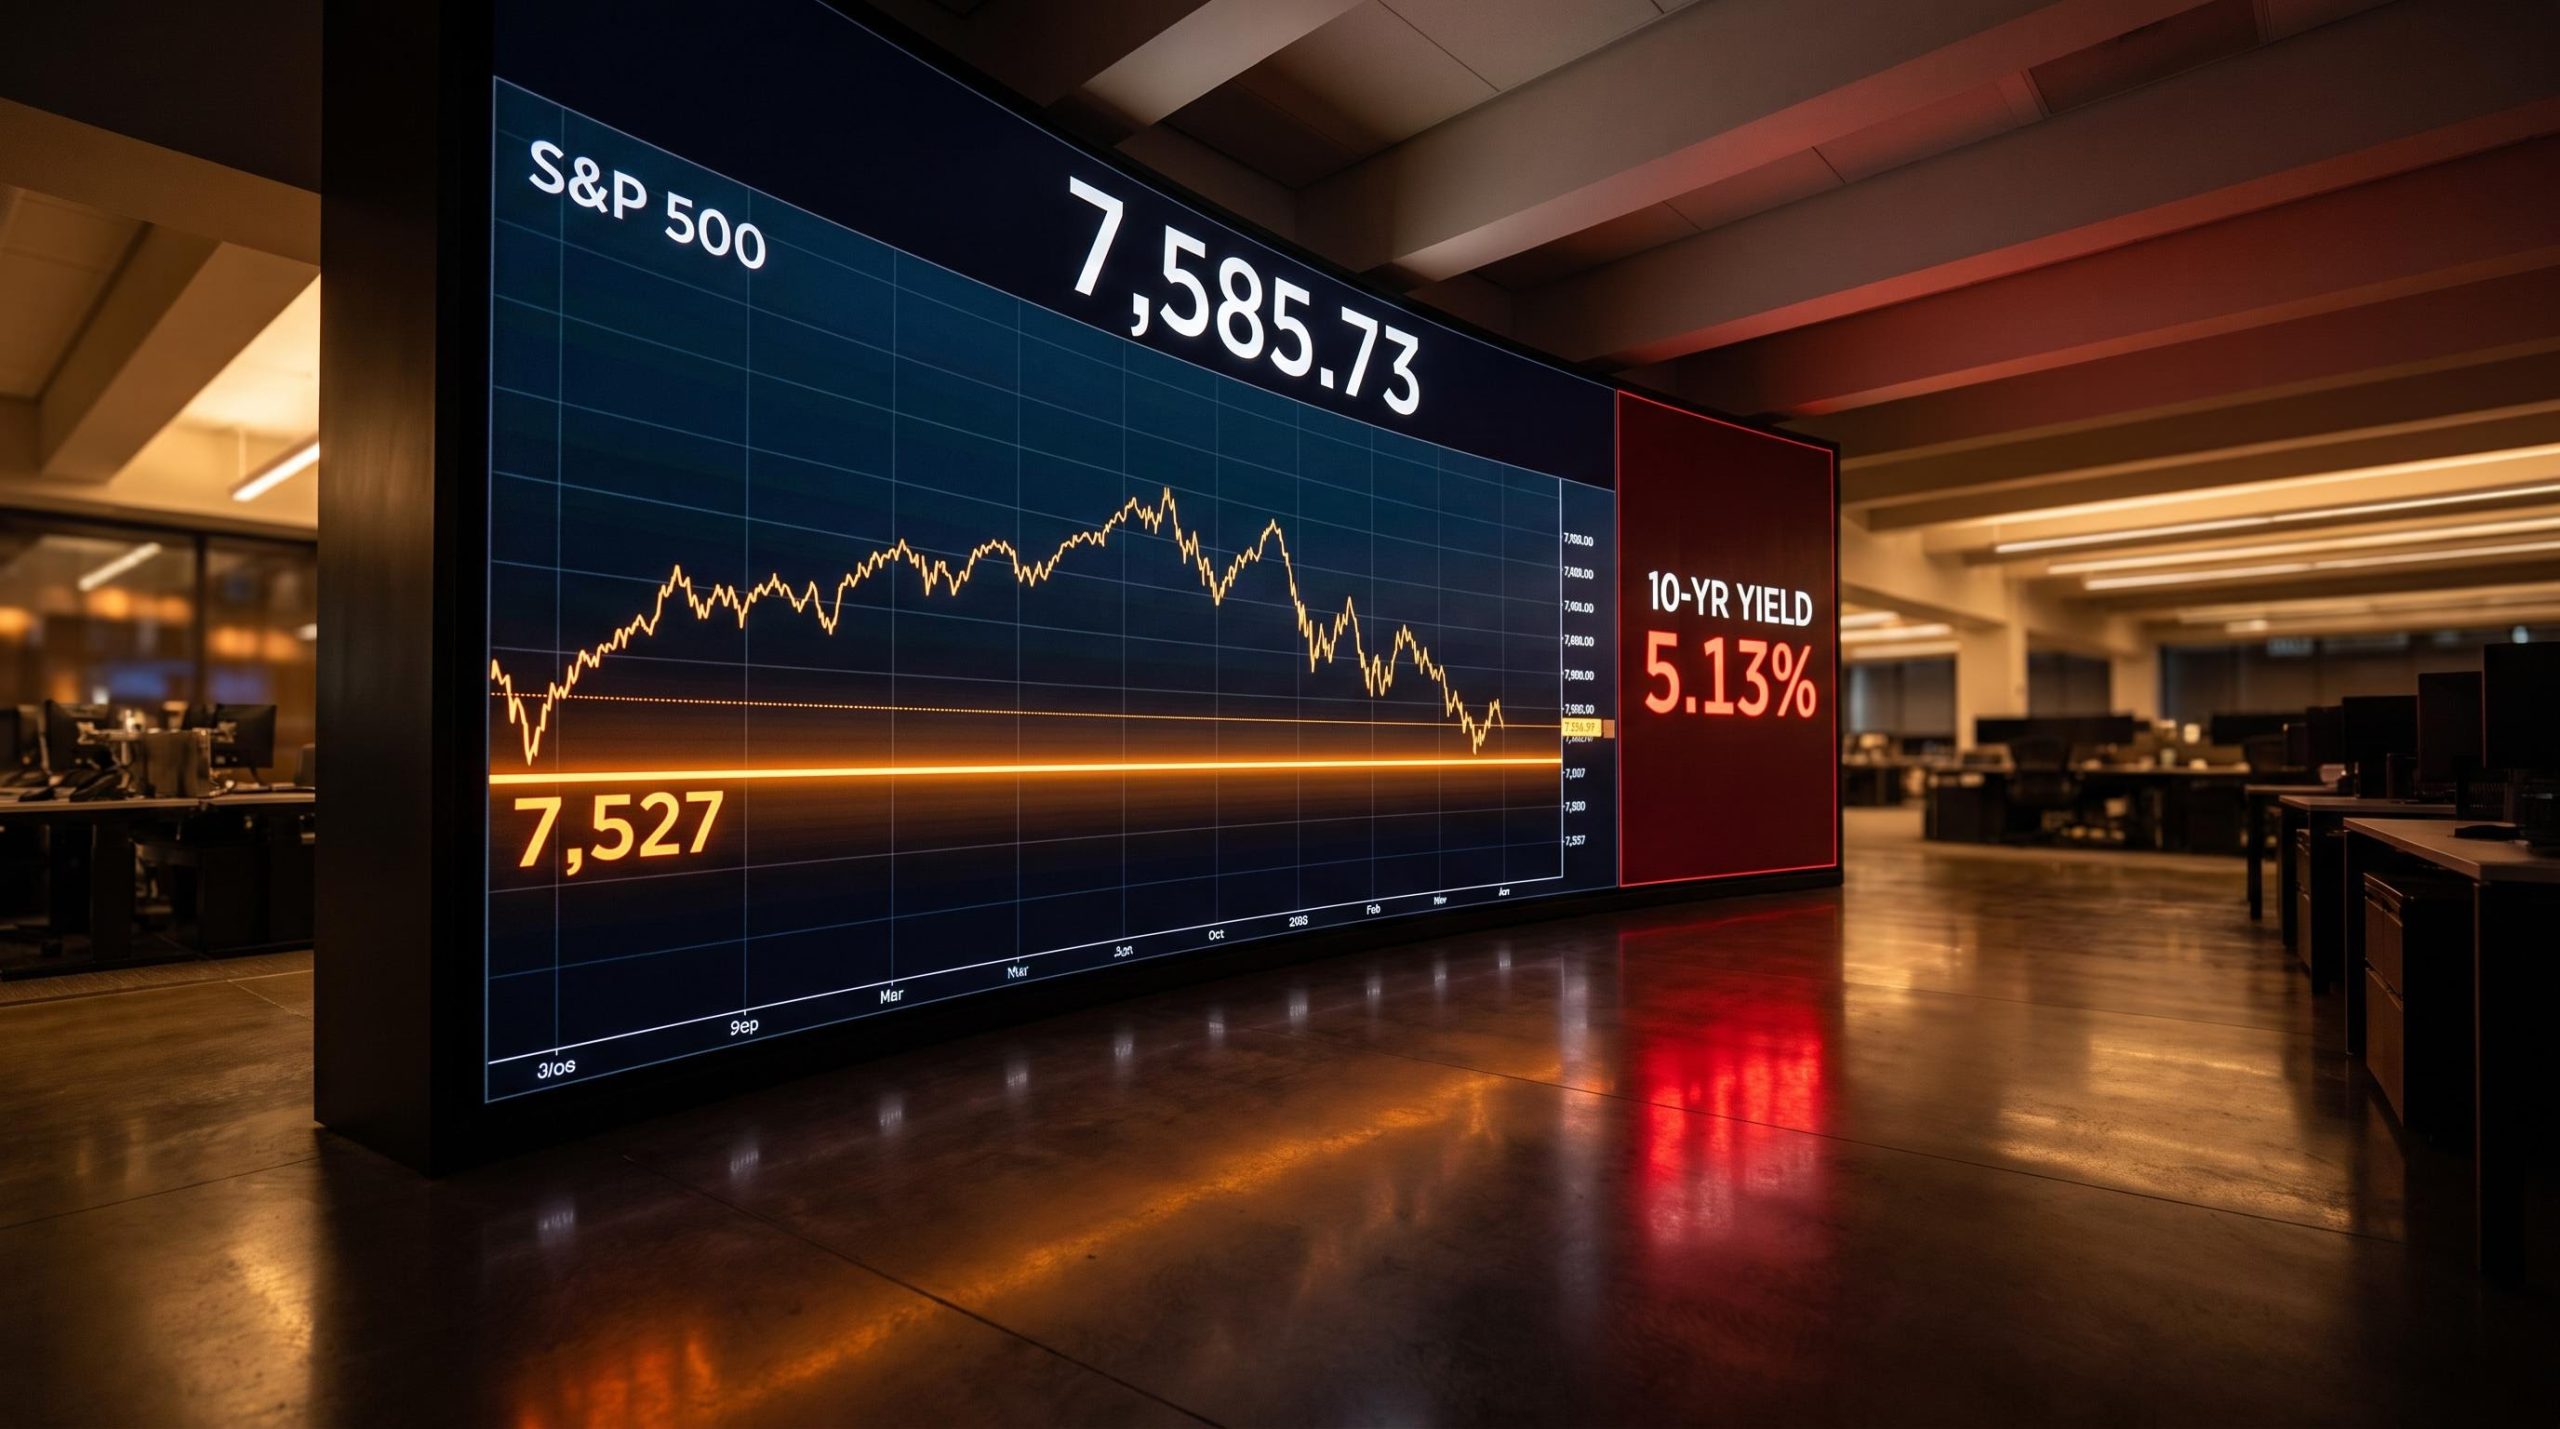
At 12:10 PM on 22 September 2026, a single 10-minute candle on the S&P 500 shot upward while oil dropped and Bitcoin surged, all on the strength of one unconfirmed headline out of the Middle East.
The trigger was a report that Iran might reopen the Strait of Hormuz, the waterway that carries a significant share of the world’s oil supply. Even unverified, a signal like that is enough to reprice risk across every correlated asset within minutes. And when the report was later denied in the same session, the episode became more useful, not less, because it exposed exactly which moves had real structural backing and which were pure sentiment.
This is a live case study in how geopolitical events move markets. Here is what moved, why oil, equities and crypto each responded through a different channel, and what the chart structure told prepared traders before and after the headline hit. Treat 22 September as a portable mental model for the next flash headline, whenever it lands.
What the Strait of Hormuz reopening report actually said, and when
To read the price action, you first have to read the information environment traders were working inside. It escalated, then reversed, all within a single session.
The chain began on 22 September 2026, during the European FX session. Kyodo, citing Iranian officials, reported an offer to reopen the Strait of Hormuz within seven days, conditional on Washington meeting specific terms. The message was reportedly relayed through intermediaries around the UN General Assembly.
The Iranian conditions, as reported A phased reopening within a seven-day window, in exchange for the United States lifting its blockade of Iranian ports and halting military operations.
The initial Kyodo flash was not what moved markets decisively. That came when Reuters corroborated the report. Only then did oil extend its losses sharply and risk assets rally in earnest.
That detail matters more than it looks. The gap between the first flash and the decisive move tells you that traders, algorithmic and discretionary alike, wait for an institutional credibility threshold before executing. Novelty alone does not move size; confirmation from a trusted source does.
Then the story turned. Late in the same session, Fars News explicitly denied that Iran had made any such offer, citing its own Iranian sources. Within hours, a confirmed catalyst had become an unconfirmed one, and the multi-asset moves began to unwind.
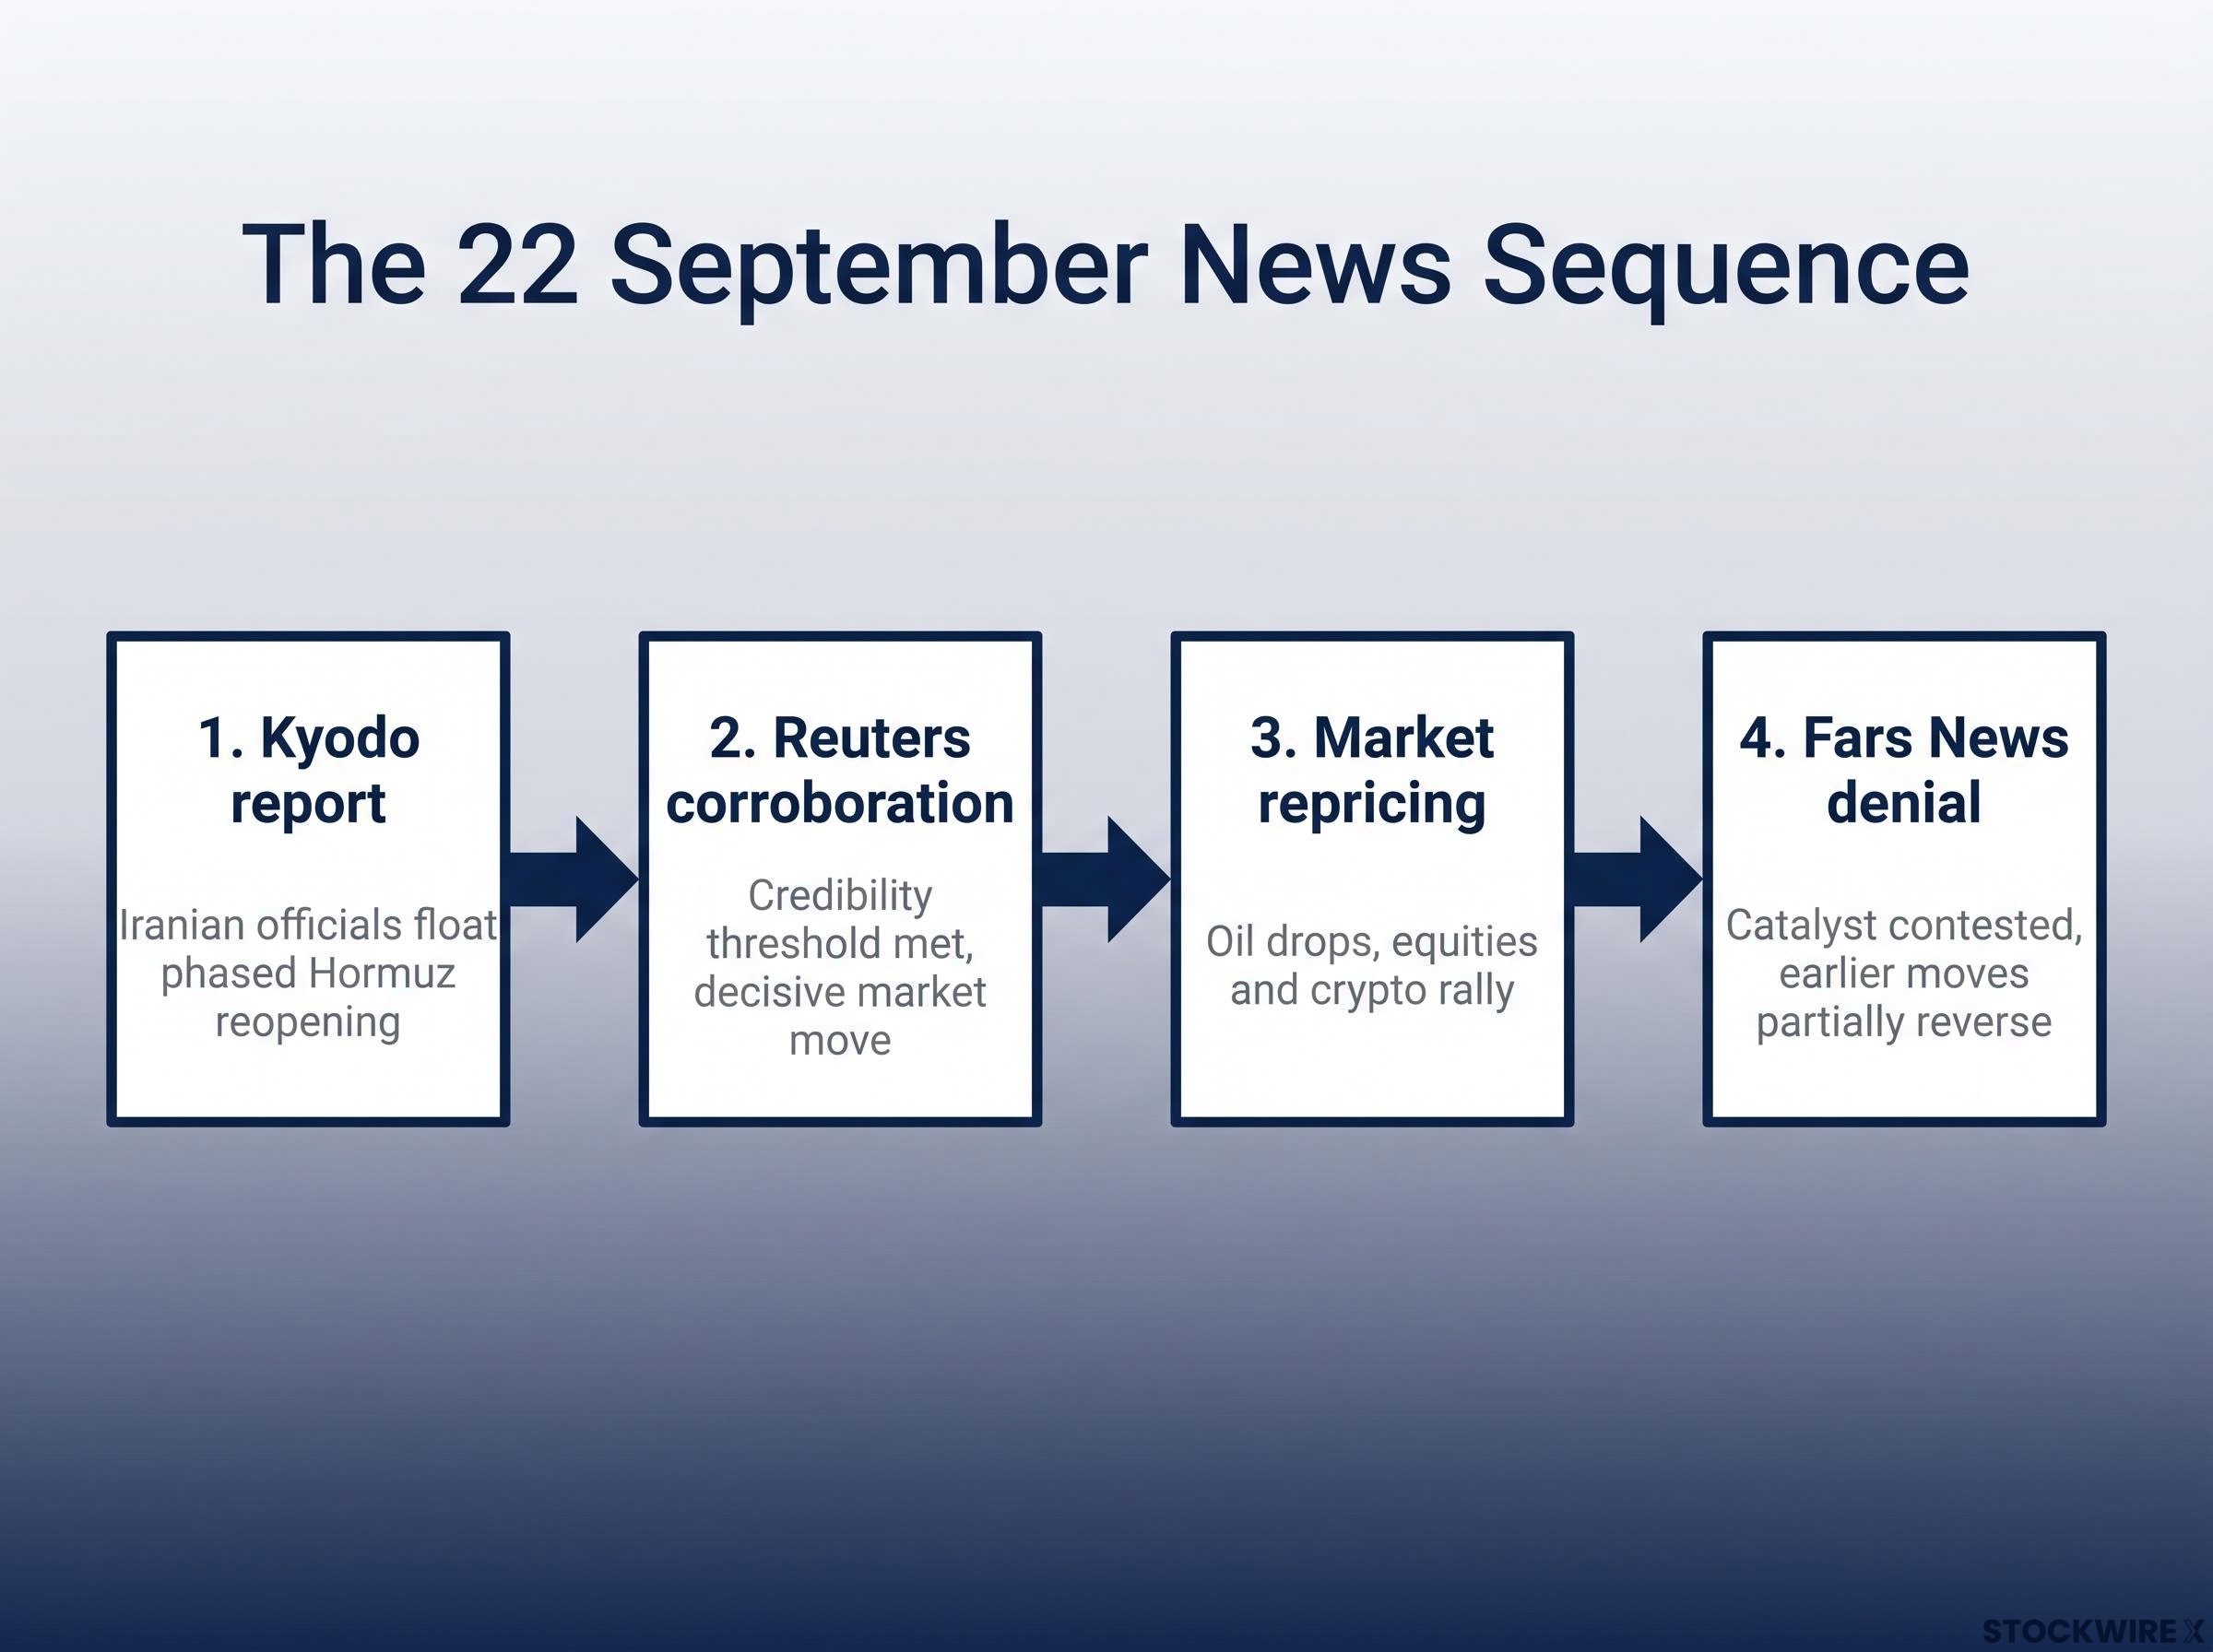
Here is the sequence in four stages:
- Kyodo report (22 September): Iranian officials float a phased Hormuz reopening, conditional on US concessions.
- Reuters corroboration: The credibility threshold is met, and markets move decisively.
- Market repricing: Oil drops, equities and crypto rally on eased inflation and supply fears.
- Fars News denial: The catalyst is contested, and the earlier moves partially reverse.
Mapping this chain lets you identify where dislocation risk peaks. It is not at the first rumour, and not after the denial. It is in stage three, the window between institutional confirmation and any contradiction, when conviction is highest and liquidity thinnest.
When big ASX news breaks, our subscribers know first
Why oil, equities, and crypto each moved in a different direction
Here is where most reactive trading goes wrong. A single headline hit three asset classes, but they did not move as one correlated blob. Each repriced along its own structural logic, and treating them as interchangeable is the source of most knee-jerk errors.
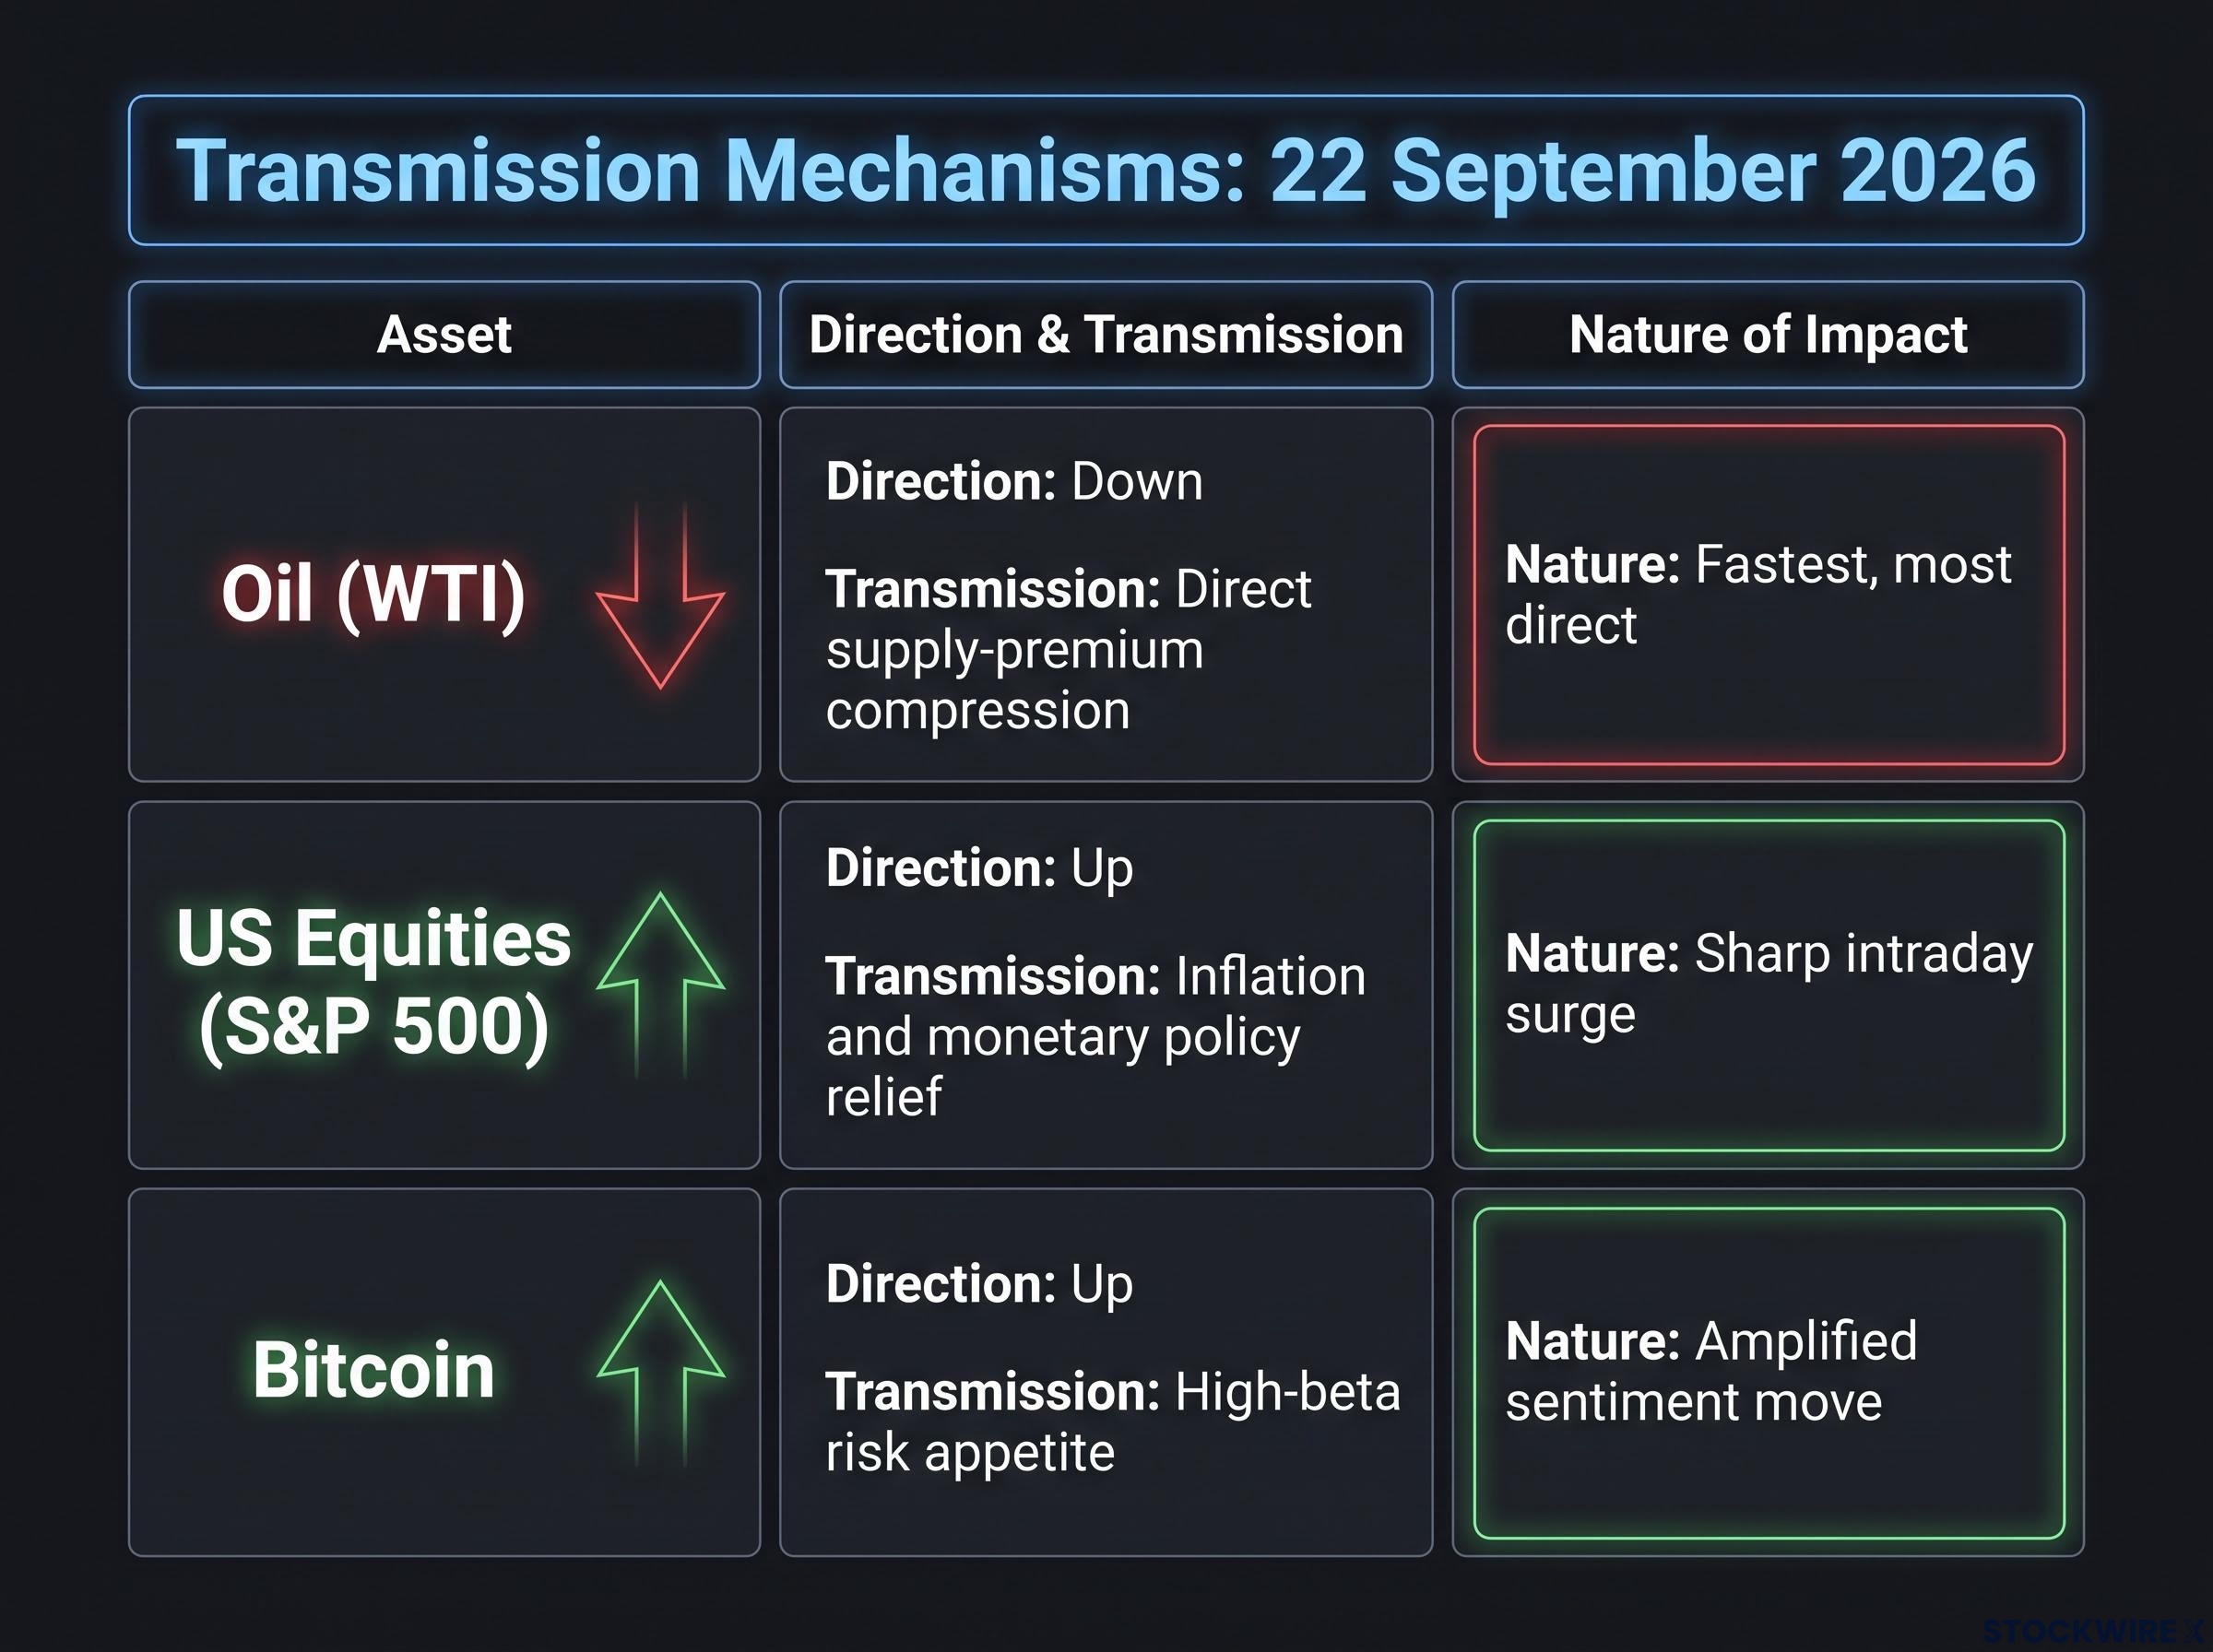
| Asset | Direction on report | Transmission mechanism | Nature of move |
|---|---|---|---|
| Oil (WTI) | Down | Direct supply-premium compression | Fastest, most direct |
| US Equities (S&P 500) | Up | Inflation and monetary policy relief | Sharp intraday surge |
| Bitcoin | Up | High-beta risk appetite | Amplified sentiment move |
Oil and the supply-premium channel
Oil is the primary and fastest channel for any Middle East news, because Hormuz physically controls a significant portion of global supply. Any de-escalation signal compresses the geopolitical risk premium baked into Brent and WTI futures almost instantly.
The context made the drop sharper. WTI crude had held above $100 per barrel since 10 September 2026, but by 22 September it had fallen back below that mark for a fifth straight session, its longest losing streak in over a year, according to Reuters. The reopening report simply accelerated a premium that was already deflating.
Equities and the inflation-policy channel
Equities move through a slower, indirect channel: monetary policy. High oil prices stoke inflation and tighten financial conditions, which keeps equity buyers cautious. Ease the oil price, and you ease the inflation fear that was sidelining them.
You can see the effect in the S&P 500 through the month. Reuters and Investing.com reported closes of 7,592.12 on 10 September, 7,585.73 on 15 September, 7,637.74 on 17 September, and 7,706.05 on 23 September. With crude above $100 through much of that stretch, buyers stayed cautious; the reopening report handed them the relief signal to step back in.
Crypto and the risk-appetite channel
Bitcoin has no direct link to oil supply at all. It moves as a high-beta expression of global risk appetite, responding to the same macro relief signal that lifts equities but amplifying it, given its sensitivity to expectations for global liquidity.
That is why crypto’s move on a supply headline can look outsized relative to its actual fundamental exposure. Understanding these three separate channels lets you anticipate which asset is most exposed to a given development before prices move, rather than scrambling to react once they already have.
What “buy the denial” means and why it happened with oil
Now the twist. When Fars News denied the reopening story, the intuitive expectation would be for oil to keep falling once the bullish supply news was confirmed real. It did the opposite. Buyers re-entered rapidly, leaving multiple lower wicks on the hourly chart, clear evidence of demand stepping in at depressed prices.
The reason sits in what the denial did and did not do. It removed a temporary positive catalyst, but it restored no Iranian supply and resolved nothing on the ground. The tight underlying fundamentals that had pushed crude above $100 were still fully intact.
This is the “buy the denial” dynamic. Traders fade the initial de-escalation selloff because the baseline geopolitical risk premium in oil is a structural feature during an active disruption, not a mood that a single headline can erase.
Three conditions make this reversal likely:
- Underlying supply fundamentals remain tight and unresolved.
- The denial removes a positive catalyst without adding a negative one.
- Alternative supply routes are insufficient to cover the disruption.
This had already played out weeks earlier. In early August 2026, Trump administration signals about an imminent Iran deal drove oil down and stocks up, only for the moves to unwind when no agreement materialised. The pattern of deal signal, relief rally, and reversal was not new.
Even the September relief had a mechanical basis: crude dropped to a one-week low on 17 September as reports of Saudi oil moving through Oman temporarily eased supply fears. When those alternatives prove insufficient, the premium snaps back. The practical lesson is direct: selling oil exposure on a de-escalation headline, before the supply disruption has actually resolved, is a common and costly mistake.
How technical traders use chart structure to navigate news spikes
Charts can look like pure noise during a news spike. They are not. On 22 September, pre-existing technical structures did not break under the pressure; they defined the ceiling and floor of the repricing. Pattern-aware traders had a map while reactive ones had only a headline.
Take the S&P 500. A descending trend line had been tracked from pivots formed after the index’s most recent all-time high. On the 12:10 PM candle, price surged straight into that resistance, stalled, and then pulled back in after-hours trading, confirming the line’s relevance even under news-driven conditions.
Oil told a similar story. A 30-minute inverse head and shoulders pattern (a bottoming formation that signals a potential trend reversal upward) had already triggered before the news, projecting a target near $97.50. That aligned neatly with daily resistance at $97.43, the high of the 21 September candle.
Natural Gas offered a concurrent but distinct development. It broke above a long-standing declining trend line on strong momentum, though a daily close above the session high was required to confirm the breakout, with the next upside target sitting just under $3.60.
| Asset | Technical structure identified | Level or target cited |
|---|---|---|
| S&P 500 | Descending trend line resistance | Held on the news surge, pulled back after-hours |
| US Oil | Inverse head and shoulders | Target $97.50, daily resistance $97.43 |
| Natural Gas | Breakout above declining trend line | Next target just under $3.60 |
| Bitcoin | Head and shoulders neckline | Resistance zone $88,000-$89,000 |
The precision of these levels holding through a news spike tells you something. Technical structures reflect collective market memory, and that memory does not vanish under geopolitical stress; it just takes a few candles to reassert itself.
Three principles follow directly:
- The first spike through a level on news is the highest-risk entry, because liquidity gaps produce slippage and false breakouts.
- Established structures regain their relevance once the initial reaction fades.
- A breakout needs confirmation, typically a daily close above the level, before you treat it as valid.
Used this way, a pre-existing structure becomes a decision boundary rather than a guess. That is the functional difference between a plan and an impulse.
The repeating pattern: why geopolitical news spikes follow a recognisable sequence
Step back from the single day, and 22 September stops being a one-off. It becomes a template you can reuse, because geopolitical flash events tend to move through the same four stages.
- Flash or rumour: An unconfirmed headline hits. Movement is tentative.
- Institutional confirmation and peak dislocation: A trusted source corroborates, conviction spikes, and liquidity thins. This is where prices move most violently.
- Denial or qualification: The catalyst is contested or walked back.
- Partial mean reversion: Prices drift back toward pre-event levels, weighted by asset class.
The speed of that final stage differs by asset. Oil reverts fastest and most completely once alternative supply routes are confirmed, as the 17 September Saudi-via-Oman episode showed. Equities and Bitcoin mean-revert more slowly and less predictably, because their recovery is path-dependent, tied to broader macro conditions and positioning rather than a single resolved supply variable.
The August 2026 Iran deal signal ran the full sequence start to finish: rumour, rally, unwind. Recognising it as a repeatable structure is what separates a framework from a scramble.
The practical implication is the part worth internalising.
Your edge does not come from reacting faster than the algorithms in stage two. It comes from recognising which stage the market is in, and positioning for the stage-four mean reversion with a pre-existing technical structure behind you.
Liquidity at technical levels evaporates during stage two, making the initial spike the most dangerous place to enter. Stage-four consolidation is where the structurally sound opportunity tends to sit.
Applying the September 22 framework to the next geopolitical disruption
So what do you actually do when the next Hormuz-type headline flashes across your screen? Turn the episode into three diagnostic questions you can run in real time.
- Which asset is the primary transmission channel for this specific disruption? A supply shock points to oil first; a broad risk event points to equities and crypto.
- What technical structures existed on that asset before the news hit? On 22 September, the answers were concrete: the oil inverse head and shoulders target at $97.50, and the S&P 500 descending trend line acting as a firm ceiling.
- Is the market in stage-two peak dislocation, or stage-four consolidation? Your positioning should look completely different in each.
The framework has limits worth naming. Not every event follows the four-stage arc. A genuine, verified, irreversible policy shift, rather than an unconfirmed report, can drive a sustained directional move with no mean reversion at all. The sequence applies to rumour-driven flashes, not to confirmed structural change.
Run the check against August 2026, and it holds up. A reader applying these questions would have flagged the Iran deal signal as a stage-two event, declined to chase the equity rally, and been positioned for the reversion when no deal appeared.
The lasting lesson of 22 September is that the denial clarified more than the initial report did. It revealed which move had genuine repricing behind it, oil, with its “buy the denial” logic, and which were mostly sentiment relief with thinner structural justification.
This article is for informational purposes only and should not be considered financial advice. Investors should conduct their own research and consult with financial professionals before making investment decisions.
What September 22 actually taught traders about navigating geopolitical volatility
The single clarifying insight is this: geopolitical news does not create market moves in isolation. It interacts with pre-existing technical structures, underlying supply fundamentals, and asset-specific transmission channels to produce moves that are partially predictable in shape, even when their timing is not.
The 22 September sequence confirmed what earlier episodes had only hinted at.
The denial leg of a geopolitical flash often carries more signal than the initial spike. It strips away pure sentiment and leaves only the structural repricing behind, showing you which move was real.
That reframes your relationship to this kind of volatility entirely. It is not chaos to be avoided, but a layered process with identifiable stages that rewards preparation over reaction.
Most retail errors in these moments come from treating the stage-two spike as the whole story. The next Hormuz-type headline will arrive without warning. Meet it with the four-stage framework and a chart you have already mapped, rather than a reflex, and you are operating with an edge that the headline-chasers simply do not have.
Past performance does not guarantee future results. These statements are speculative and subject to change based on market developments.