
Until a few years ago, getting into Australian private credit meant one thing: having $5 million to $15 million spare and a wholesale investor certificate to prove you belonged in the room. That barrier has now dissolved.
If you have only ever touched fixed income through a term deposit or a bond fund, that shift is worth sitting with. The asset class that once sat behind a seven-figure velvet rope is now something you can enter from a few hundred dollars through a standard brokerage account.
ASX-listed private credit funds have driven that change over the past three to four years. But the product you are buying as a retail investor is genuinely different from what institutions access, and understanding that difference is the whole point of this piece.
What you will get here is a practical framework: what private credit actually means in the Australian context, how a listed fund structure reshapes the risk you are taking on relative to an unlisted equivalent, and how to judge these funds on the one metric that matters, net-of-fees income, rather than a headline yield or a management fee looked at in isolation.
What “private credit” actually means in Australia (and why the US definition will mislead you)
If you have picked up the term “private credit” from US financial media, you are probably picturing corporate loans: a fund lending directly to mid-market companies, earning income off business cash flows. Hold that picture loosely, because in Australia it is largely the wrong one.
Here, private credit is predominantly real estate-backed lending. Construction finance, property development loans, and land banking transactions make up the bulk of it. According to ASIC’s REP 814, published 22 September 2025, the Australian market spans commercial real estate lending, construction and development finance, and other asset-backed loans.
That focus exists for a structural reason. The major banks dominate residential and commercial mortgage lending, but they have pulled back from development and construction finance. Non-bank lenders and private credit managers have moved into the gap.
The regulator has noticed the concentration. ASIC’s planned 2026 surveillance specifically flags wholesale private credit funds “including those with a focus on real estate lending,” which tells you where the sector’s weight sits.
On the ASX, the two sub-categories show up in two funds. Qualitas Real Estate Income Fund (ASX:QRI) is real estate-backed. MA Credit Income Trust (ASX:MA1) is direct corporate lending, closer to the US model. Both are available to retail investors, but they are not interchangeable.
| Feature | Australia | United States |
|---|---|---|
| Primary asset type | Real estate-backed loans | Corporate cash-flow loans |
| Typical borrower | Property developers, construction projects | Mid-market companies |
| Key risk driver | Property cycles, project outcomes | Business earnings |
| Collateral structure | Property security | Company cash flows and assets |
| Listed fund example | QRI (real estate); MA1 (corporate) | Corporate direct-lending funds |
This is not a semantic quibble. If you assume you are buying US-style corporate diversification, you may actually be taking on property cycle risk and project-specific development risk without realising it. Getting the definition right changes which macro events you need to watch.
Your real estate lending exposure through a private credit fund occupies a structurally distinct position from owning A-REITs or direct property: you are a creditor to a development project rather than an equity owner of a completed asset, which means your return profile, collateral position, and exposure to property cycles differ materially from those of a property investor.
Why Australian private credit ended up property-heavy
Australia’s leveraged-loan and corporate private lending markets are smaller and less developed than their US counterparts. That left real estate as the natural growth area for non-bank lenders.
This concentration is not a flaw. It is a structural feature of the market, and the ASX funds available to you reflect it directly. Knowing that upfront means you will not be caught off-guard when property sentiment moves and your fund’s price moves with it.
When big ASX news breaks, our subscribers know first
How listed funds changed who gets in, and what that change actually costs you
The access story is real and worth celebrating. Wholesale private credit historically demanded $5 million to $15 million minimum and wholesale investor status. The ASX-listed equivalents ask for a few hundred dollars and a brokerage account. That is a genuine democratisation of an income asset class.
Then comes the trade-off. The same exchange mechanism that opens the door introduces a price layer that unlisted investors never face.
Here is the core of it. Listed units trade at prices set by supply and demand, which may sit above or below the fund’s net tangible assets (NTA) per unit, the actual per-unit value of the underlying loan book. When the price is below NTA, the units trade at a discount. When above, a premium.
QRI shows both sides. At one point its units traded at roughly a 1.5% discount ($1.585 price against $1.6090 NAV). Later they traded at around a 1-1.5% premium ($1.620 against $1.6004 NAV). Same fund, different sentiment.
MA1 has recently traded at a discount, with a unit price of $1.95 against a NAV of $2.00, implying roughly a 2.5% discount as at mid-September 2026.
This is exactly why institutions often prefer unlisted structures for the same strategy. Qualitas runs both QRI and an unlisted senior debt fund, and the unlisted version is favoured by institutional investors precisely to avoid this mark-to-market price volatility, even when the underlying loans have not changed in value.
The advantages and the risks, side by side
What the listed format gives you:
- Daily pricing and ASX liquidity
- A very low minimum entry point
- Continuous disclosure obligations and governance requirements
What it also hands you:
- Price and NAV divergence, in both directions
- Mark-to-market volatility on units even when loan values are stable
- Forced-sale risk if you need to exit during a period of sector stress
The regulator has flagged where this bites. ASIC’s REP 820 raised the concern that discounts in listed trusts can cause real investor harm when people treat these products as capital preservation vehicles and then hit a meaningful drawdown.
ASIC identified products described as “low risk” or “capital preservation” despite higher-risk, illiquid strategies with the potential for significant price discounts under stressed conditions.
A 2.5% discount sounds modest. But remember you are buying these funds for income, not growth. A forced sale at a discount can eat several months of distributions in a single transaction, so understand that asymmetry before you size a position.
When the discount becomes a real cost
Discounts tend to widen during sector-wide worry, and the trigger does not need to touch your fund directly. The original source discussion referenced negative sentiment around the Bathla Group collapse affecting listed private credit prices at the time.
Treat that as an illustration of the mechanism, not a confirmed event. The specific exposures of QRI and MA1 to that situation are not publicly confirmed. The instructive point is simple: an external credit event can drag the listed price of a fund that has no direct exposure to the troubled borrower, purely on sentiment.
The Bathla Group collapse, which saw $3.4 billion in debt spread across 542 related entities enter voluntary administration in August 2026, illustrates concretely how retail private credit risks can materialise through concentration in property development lending, the exact segment that dominates the Australian market.
The metric that actually matters: evaluating private credit funds on net-of-fees income
Your instinct is probably to shop by management fee or by the biggest headline yield. Both instincts will lead you astray.
A high gross yield from a concentrated, higher-risk loan book is not the same as a slightly lower yield from a diversified, conservatively underwritten portfolio. And a low management fee tells you nothing about what actually lands in your account.
NAV erosion mechanics, including gradual loan markdowns, return-of-capital distributions disguised as income, and PIK interest that inflates a reported yield without any cash being received, can make a fund appear to be generating income while the investor’s real economic position quietly deteriorates.
The number that matters is net-of-fees income: what you receive as distributions, expressed as a yield on the price you paid, after every fee is deducted. That is the like-for-like basis.
Some managers frame it more honestly than others. MA1 states a target return of RBA cash rate + 4.25% p.a., expressing the income as a spread over cash rather than a fixed number. That framing is more transparent about how the return moves with interest rates.
| Feature | QRI | MA1 |
|---|---|---|
| Asset focus | Real estate-backed lending | Direct corporate lending |
| Distribution yield | 7.24% p.a. on NAV (12-month, 24 Aug 2026) | 8.39% (Performance Report, 15 Sep 2026) |
| Target return structure | Not stated as a spread target | RBA cash rate + 4.25% p.a. |
| Underlying loan pool | ~60 loans | Larger diversified credit book |
| Management fee / frequency | ~1-1.5% / monthly | ~1-1.5% / monthly |
QRI also carries a forward dividend yield of 7.61% with a forward annual dividend of $0.12 per unit as of 15 September 2026. MA1’s last distribution per unit was $0.0143, dated 14 September 2026.
Here is a three-step way to apply the net-of-fees lens:
- Confirm the quoted distribution yield is stated net of all fees, not gross.
- Check the price you paid against NAV, then adjust the effective yield for the discount or premium.
- Weigh the underlying loan book concentration against the yield premium on offer. A higher yield from a concentrated book is not free.
This is the same approach experienced advisers use.
Dan Kelly of Viola Private Wealth advised investors to prioritise net-of-fees income rather than fixating on management fee levels, arguing that active management expertise can justify higher costs when the net income delivered is superior.
Kelly’s own three-fund portfolio makes the point in practice. Alongside QRI and MA1, he holds PGI2 (Plato Global Shares Income Fund), an equity income fund with capital growth potential, blending to roughly a 7.4% combined yield at equal weightings. The difference between evaluating on net-of-fees income versus headline yield is the difference between knowing what you will actually receive and being drawn to a number that ignores the cost of getting it.
What ASIC is watching, and what that tells you about the risks
ASIC’s REP 814 (22 September 2025) and REP 820 (5 November 2025) are not dry filings to skip. Read together, they are a diagnostic of exactly where retail investors in listed private credit are most likely to lose money in ways the marketing did not spell out.
ASIC REP 820 private credit surveillance findings identified material deficiencies in fee disclosure, governance, conflicts of interest, and valuation practices across both retail and wholesale funds, giving you a precise map of where oversight gaps are most likely to affect investor outcomes.
Five risk categories sit at the top of the regulator’s list. Each describes a real scenario, not an abstraction.
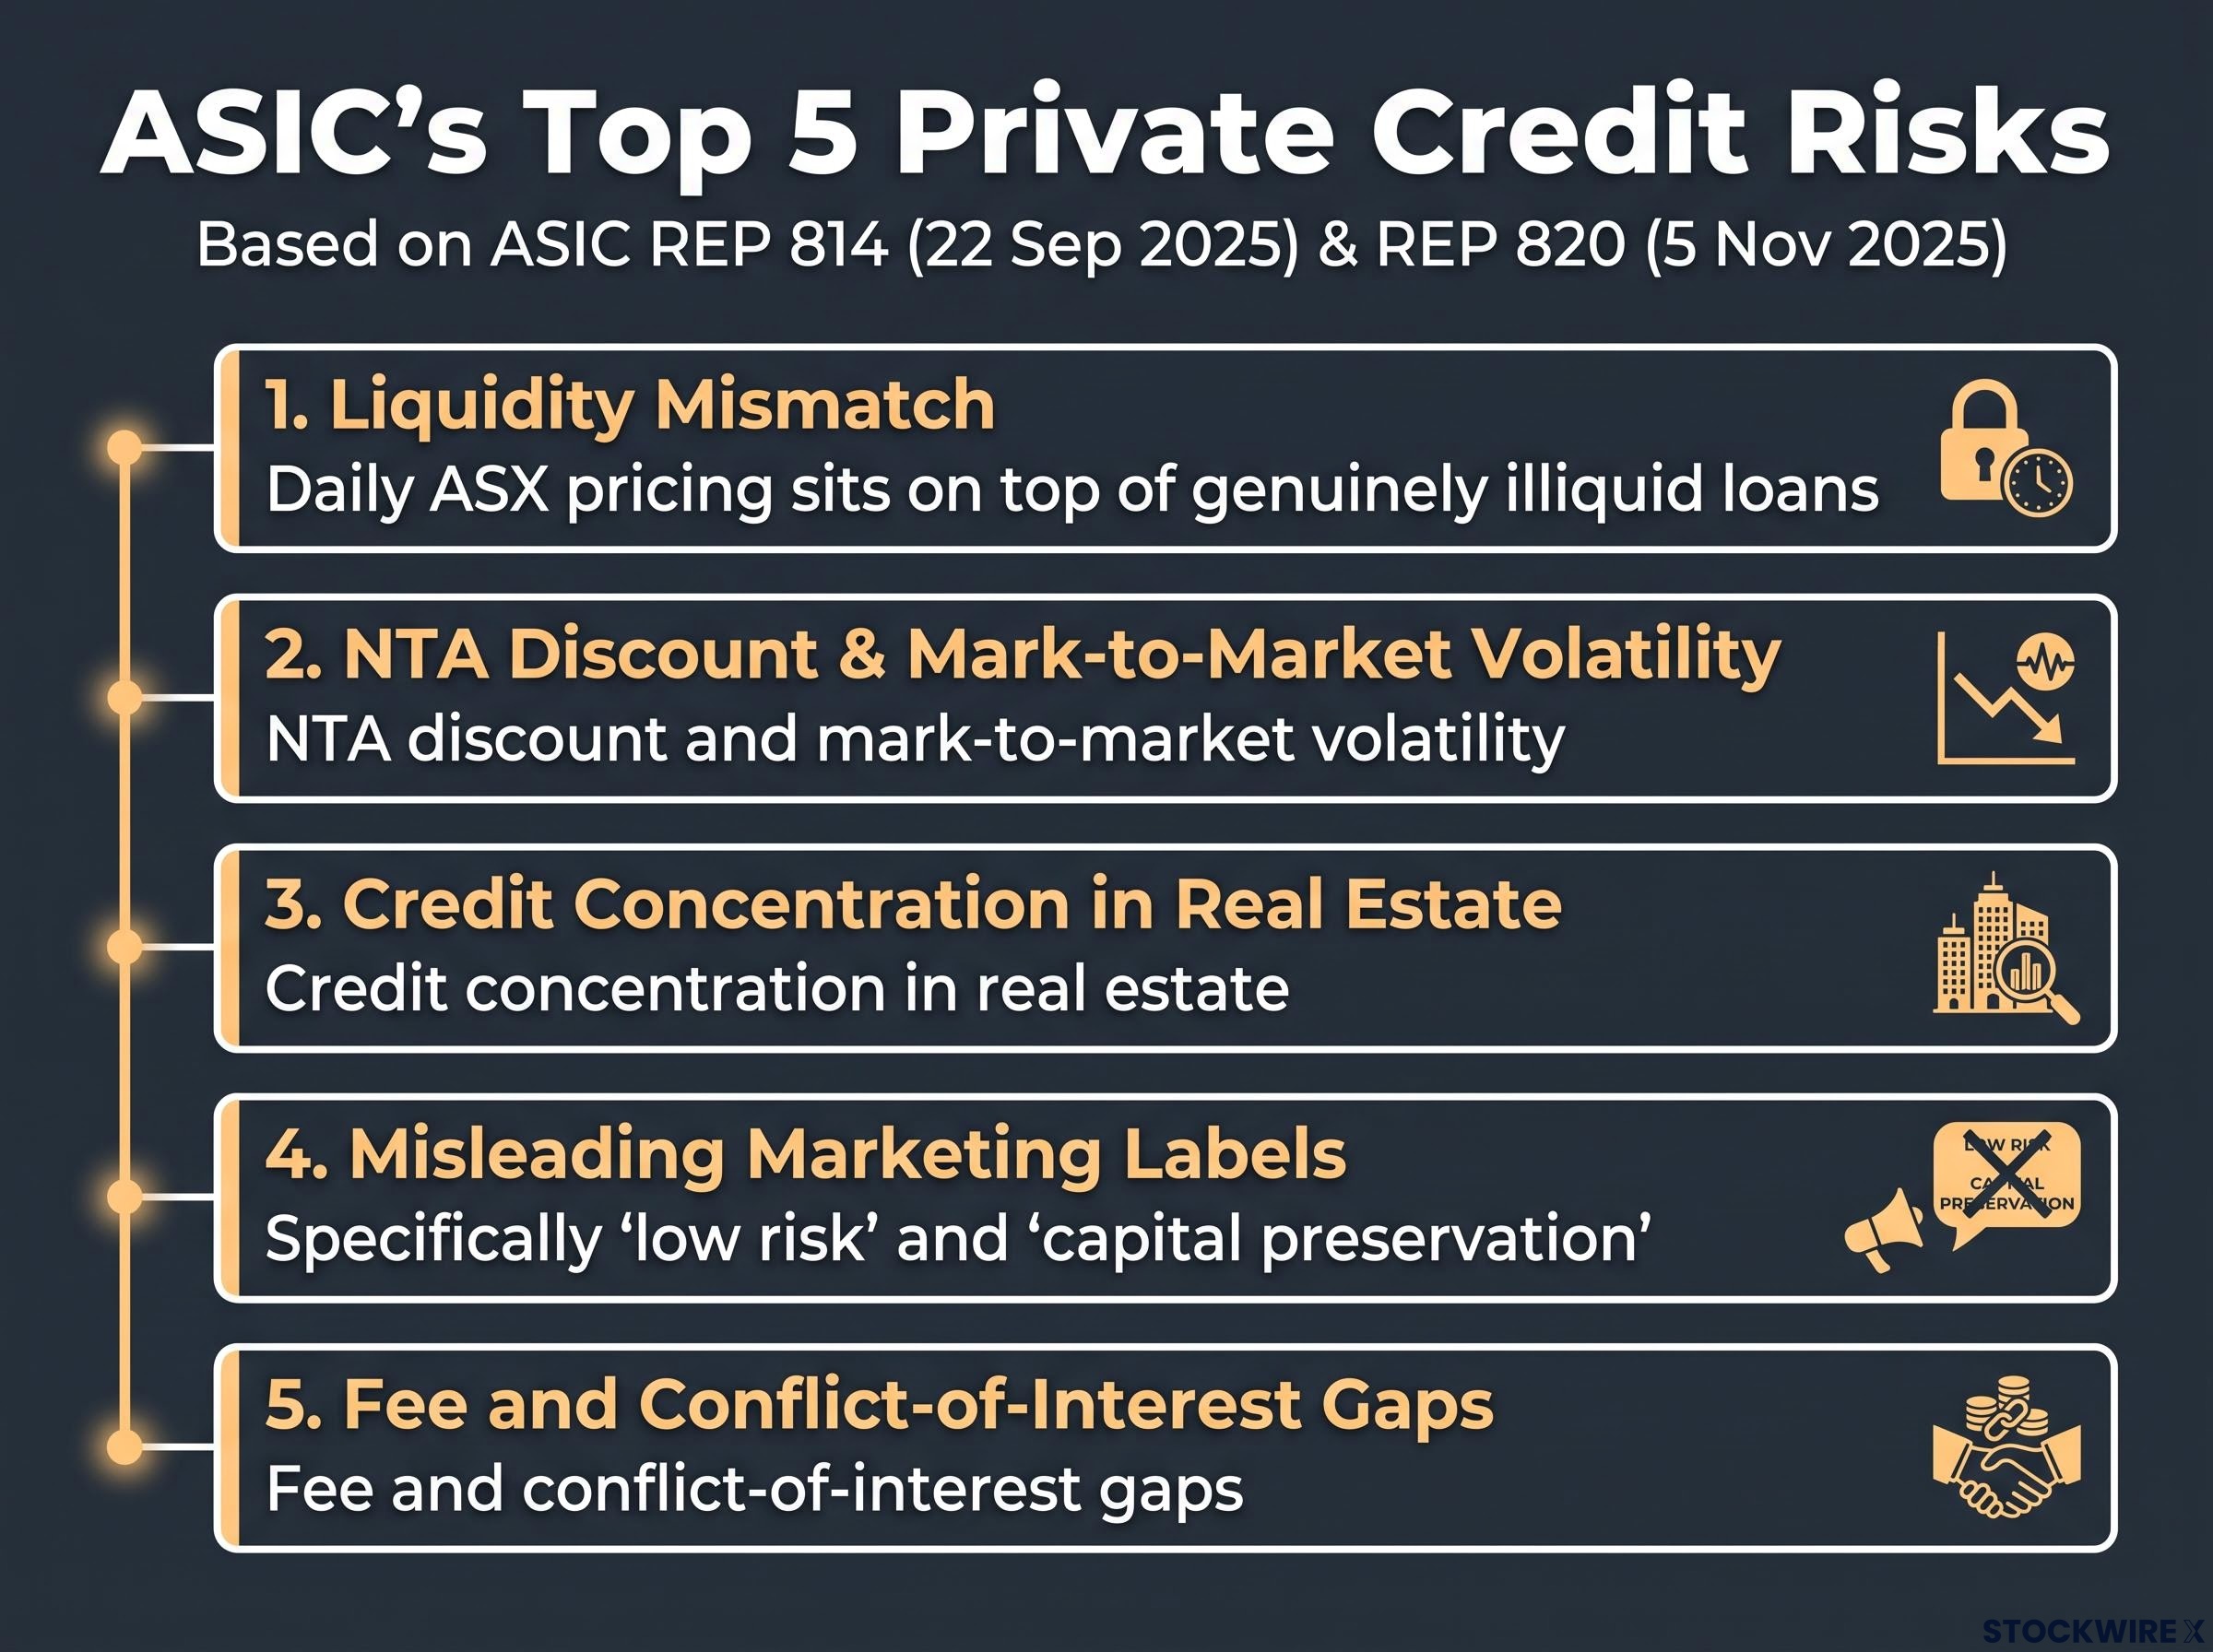
- Liquidity mismatch: daily ASX pricing sits on top of loans that are genuinely illiquid
- NTA discount and mark-to-market volatility: units can trade well below asset value when sentiment turns
- Credit concentration in real estate: exposure to property cycles and project-specific outcomes
- Misleading marketing labels: “low risk” and “capital preservation” applied to illiquid credit strategies
- Fee and conflict-of-interest gaps: margins, performance fees, and conflicts between managers, originators and borrowers
The suitability finding is the one that should give you pause. In REP 820’s sample of 28 funds, 16 of the retail funds used the advised channel, but only 2 required clients to receive personal advice as a condition of investing, and just 7 required a questionnaire.
ASIC flagged products described as “low risk” or “capital preservation” despite higher-risk strategies and limited liquidity, alongside yield comparisons that emphasise high income versus term deposits without adequately explaining credit and liquidity risk.
ASIC’s 2026 roadmap continues this focus on fees, distribution practices, and real-estate-focused wholesale funds. Notably, the regulator consistently acknowledges that well-run funds with strong governance and accurate disclosure can play a legitimate role in diversified portfolios for investors who understand illiquidity.
What this means for you is direct. Because most retail investors can buy these funds without any formal suitability check, the burden of understanding the risk falls on you. ASIC’s surveillance is effectively a list of what to examine first.
A practical pre-investment checklist drawn from ASIC’s findings
Before you commit capital, make sure you can answer these:
- Does the target market determination (TMD) actually match your investor profile?
- Is the distribution yield quoted net of all fees, or gross?
- Is the underlying loan book diversified, or concentrated in a few borrowers or one property segment?
- Does the marketing call this “capital preservation” or “low risk,” and if so, does that label survive the actual risk disclosures?
- Have you read the product disclosure statement (PDS), not just the tidy product page?
A fund that addresses these clearly in its disclosure documents is better governed than one that leaves you guessing.
Sizing private credit within a portfolio that still has room to grow
The real decision you face is not whether private credit is good or bad. It is how much of it belongs in a portfolio that still wants capital growth alongside income.
Dan Kelly’s three-fund construction gives you a concrete example. One-third each in QRI, MA1, and PGI2, blending to an estimated 7.4% combined yield.
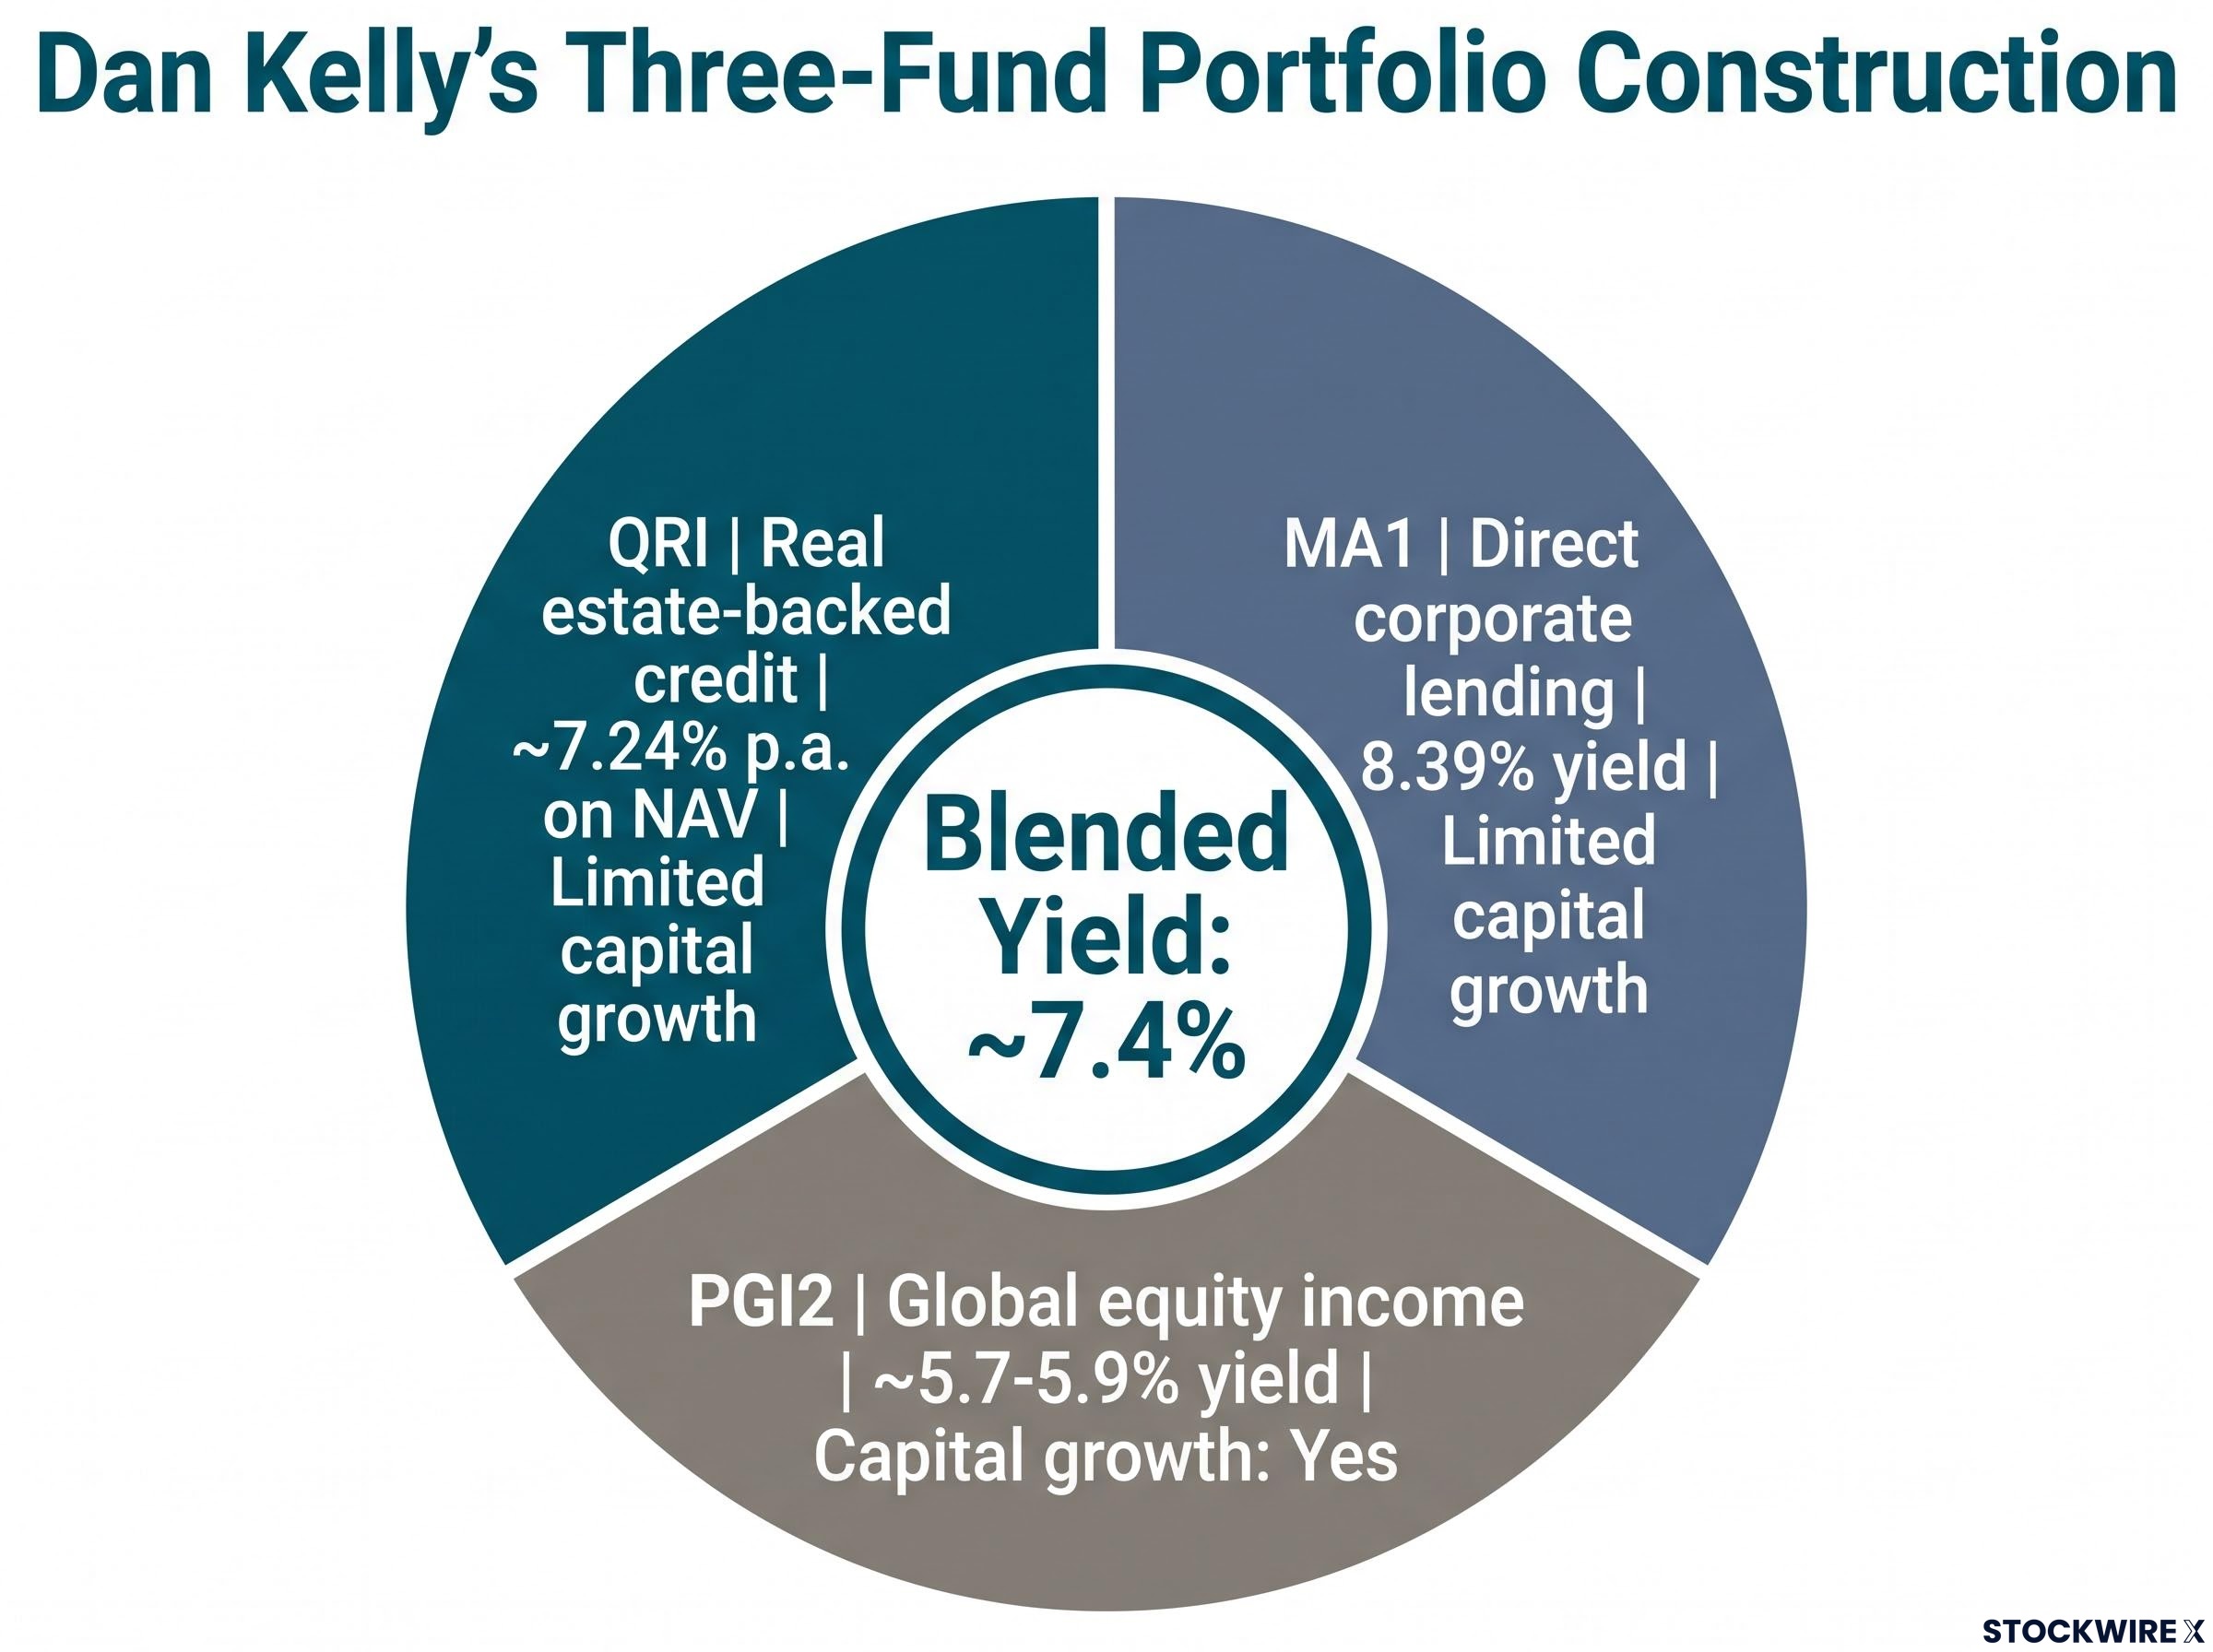
Each fund plays a defined role. QRI (7.24% p.a. 12-month distribution return on NAV) and MA1 (8.39% distribution yield) are income generators with limited expected unit price appreciation. PGI2 is the counterpart that adds capital growth potential, with roughly a 5.7-5.9% dividend yield.
| Fund | Strategy type | Est. income yield | Capital growth | Weighting |
|---|---|---|---|---|
| QRI | Real estate-backed credit | ~7.24% p.a. on NAV | Limited | One-third |
| MA1 | Direct corporate lending | 8.39% | Limited | One-third |
| PGI2 | Global equity income | ~5.7-5.9% | Yes | One-third |
The research references a 12-month total return of roughly 16% for PGI2, but that figure is unverified, so treat it as illustrative context rather than confirmed data.
A few principles worth holding onto:
- Keep income and growth roles separate, and know which each fund is doing
- Diversify within private credit itself: QRI’s real estate exposure and MA1’s corporate lending reduce concentration in the income sleeve
- Judge the blended yield across your holdings, not any single fund’s number in isolation
Understand the label honestly. Pairing two private credit income streams with one equity income fund is not a conservative portfolio. It is an income-optimised portfolio with a growth kicker, and you should decide whether that matches your own goals before committing.
What the regulator’s focus and the market data together tell you about where to go from here
The access barrier is genuinely gone. The tools to evaluate these funds are now in your hands. The remaining work is calibration: how much of this asset class belongs in your specific portfolio, given your income needs and risk tolerance.
Two threads run through everything above. The structural shift made listed private credit accessible to you. The evaluation framework, net-of-fees income, NAV discount awareness, and risk-category alignment, is what lets you buy well rather than simply buy.
Take ASIC’s ongoing surveillance the right way. It is not a reason to avoid the asset class. It is a signal that the sector is maturing, and the funds that come through scrutiny with strong governance and accurate disclosure are better products for it.
The tools you now hold:
- Definition clarity: know it is largely real estate-backed here, not US-style corporate lending
- Net-of-fees income: the single metric for like-for-like comparison
- NAV discount and risk checklist: the questions ASIC’s findings tell you to ask
Private credit can play a legitimate income role in a diversified portfolio, but only for investors who accept that it is not a term deposit substitute, that the underlying assets are illiquid, and that listed prices can drift from asset values in ways that demand patience. You can now have a substantively different conversation with an adviser than someone armed only with a marketing brochure.
For investors curious about how the ASX-listed structure is being applied beyond credit into private equity and venture, our full explainer on ASX-listed private market vehicles examines how co-investment mechanisms and defined fund lifecycles are used to give retail investors exposure to pre-IPO companies that would otherwise require institutional accreditation.
This article is for informational purposes only and should not be considered financial advice. Investors should conduct their own research and consult with financial professionals before making investment decisions. Past performance does not guarantee future results, and financial projections are subject to market conditions and various risk factors.