In the six months to mid-2026, US geared ETF assets climbed 55% to reach nearly $198 billion. That number alone would be enough to pay attention to. But it does not capture what is happening in South Korea, where single-stock leveraged products launched in April 2026 came to represent close to half of daily turnover in major individual stocks within a matter of weeks.
Most investors in these markets do not hold any of these products. The consequences of how they behave, however, will reach them anyway. Geared exchange-traded funds have crossed a threshold: they are no longer a niche corner of the market. They are now large enough, concentrated enough, and mechanically distinctive enough to change how prices move for everyone transacting alongside them.
Here is a framework for understanding what the current geared ETF boom tells you about aggregate risk appetite, what the mechanics of these products mean for how a market downturn could unfold, and what specific signals to track if you want to know when the amplification risk shifts from potential to active.
From niche instrument to systemic force: how big has this market become?
Morningstar data shows that US geared ETF assets grew by 55% over six months to reach around $198 billion at mid-2026. Since January 2025, 275 single-stock geared ETFs have launched. The total count now exceeds 400 levered single-stock ETFs across roughly 700 leveraged and inverse exchange-traded products.
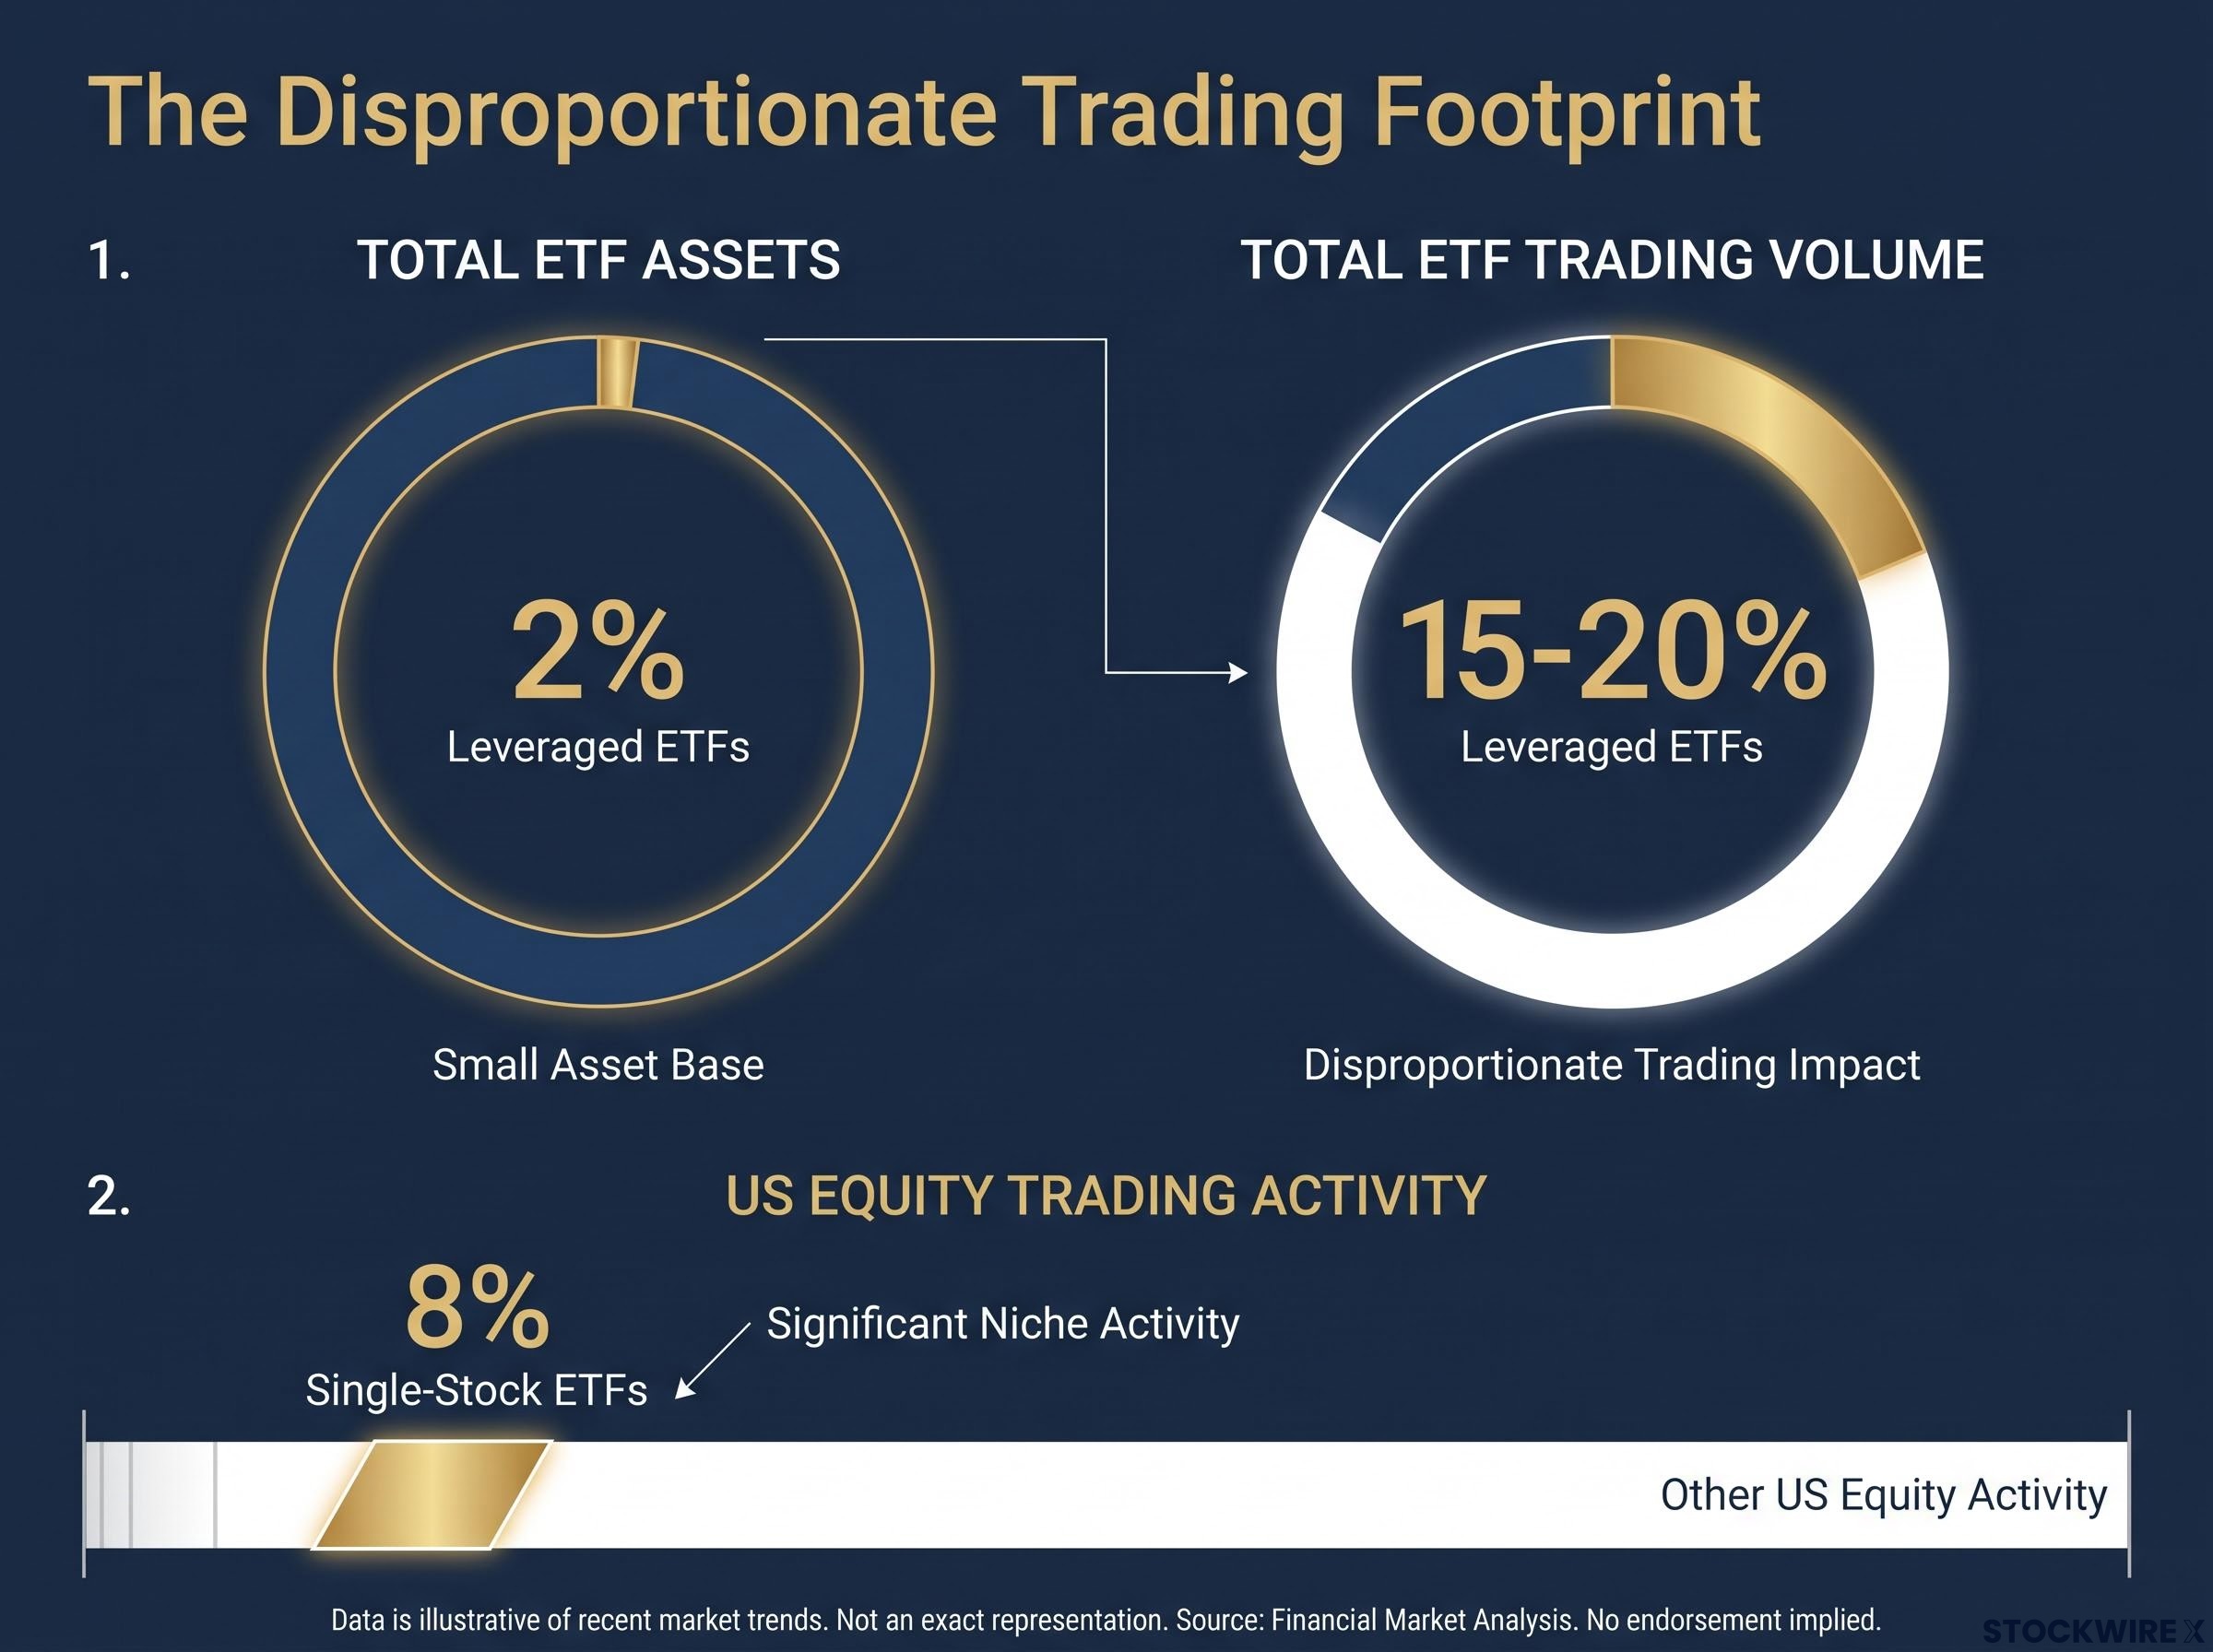
The asset figure, though, understates their market footprint. Leveraged ETFs represent approximately 2% of total ETF assets. On active trading days, they generate 15-20% of total ETF trading volume. Reuters and Morningstar data indicate that single-stock ETFs alone are responsible for around 8% of all US equity trading activity.
That gap between asset share and volume share is the number that matters most if you hold zero geared ETFs. You are transacting in a market where 15-20% of ETF activity on a given day is mechanically amplified, and that changes the character of the price moves you observe.
| Metric | Figure | Source |
|---|---|---|
| US geared ETF AUM (six months to mid-2026) | ~$198 billion (+55%) | Morningstar |
| Single-stock geared ETFs launched since Jan 2025 | 275 | Morningstar |
| Total leveraged/inverse ETPs in US | ~700 products / ~$200B AUM | Cross-industry estimates |
| Leveraged ETF share of ETF trading volume | 15-20% on given days | Research estimates |
| APAC leveraged ETF AUM growth | $12-13B → ~$50-55B | Research estimates |
Beyond US borders: the global leverage surge
This is not a US-only story. Asia-Pacific leveraged ETF assets jumped from $12-13 billion to approximately $50-55 billion in a matter of months. Leveraged and inverse products accounted for an estimated 31% of all US-listed ETF launches in the first half of 2026, up from 22% in 2025 (though this figure has not been independently confirmed).
South Korea offers the sharpest proof of how quickly these products can achieve market-moving scale. When single-stock ETFs were rolled out there in April 2026, their uptake was immediate and dramatic: within a few weeks, these products accounted for close to half of the average daily turnover in shares such as Samsung and SK Hynix. That is not gradual adoption. That is a market structure shift in real time.

When big ASX news breaks, our subscribers know first
What makes single-stock geared ETFs structurally different from their predecessors
The instinct is to treat single-stock leveraged ETFs as a more aggressive version of the index-tracking leveraged products that have existed for over a decade. That instinct is wrong on three dimensions that matter.
- Concentration: A leveraged index ETF spreads amplified exposure across hundreds of securities. A single-stock geared ETF concentrates it on one company, often in a tightly correlated cluster of AI and semiconductor names. Stress in one product can transmit across related names in the same sector almost instantly.
- Return path behaviour: Index leveraged products experience path dependency too, but diversification dampens the effect. Single-stock products amplify it. The trajectory of prices between your entry and exit determines the outcome, not just the start and end points. A 3x single-stock ETF held for six weeks in a volatile market will not produce three times the underlying stock’s return over that period. The difference can run against you even if the stock finishes higher.
- Price discovery distortion: When single-stock leveraged products represent a significant share of trading in the underlying, short-term amplified flows can drive price action rather than the company’s actual business performance.
The daily reset mechanism is the structural feature that separates geared ETFs from every other leveraged instrument: because positions are rebalanced each evening to restore the target multiple, the path prices take through time shapes final returns as much as the start and end points do.
Morningstar’s guidance on geared ETFs explicitly warns that path dependency and volatility compounding can cause outcomes that surprise investors who assume simple linear multiplication. The path of prices matters as much as the destination.
Bloomberg Intelligence estimates that more than 450 leveraged and inverse single-security ETFs have launched since 2022, concentrated overwhelmingly on AI and semiconductor names, with the category surpassing $150 billion (though this figure has not been independently confirmed). The compounding mechanic is the single feature most retail investors in these products demonstrably do not price in when they buy. Understanding that gap between expectation and mechanical reality is the starting point for evaluating whether your assumptions about these products are accurate.
Three signals that place this boom in a late-cycle context
No single one of these signals is conclusive on its own. Taken together, investors who have lived through prior late-cycle periods will recognise the combination.
- Margin debt at record highs. US margin debt reached approximately $1.5 trillion as of June 2026, representing more than 51% year-on-year growth according to FINRA data reported in July 2026. Margin debt is not the same as geared ETF exposure, but it is a correlated indicator. When both leverage channels are expanding simultaneously to record levels, the system is carrying more amplified risk than at any point in the current cycle.
The margin debt trajectory has now breached both Leuthold Group warning thresholds simultaneously, a configuration that previously preceded the dot-com crash, the global financial crisis, and the 2021-2022 cycle, making it one of the more consequential corroborating inputs alongside the geared ETF expansion data.
US margin debt: approximately $1.5 trillion as of June 2026, representing more than 51% year-on-year growth (FINRA).
- Regulatory friction lagging product innovation. The SEC has halted or warned against proposals for 3x-5x leveraged ETFs, citing risk exposure to retail investors. This pattern, where regulators respond after complexity has already scaled, is consistent with prior late-cycle phases. Reuters reported nearly 800 new ETFs launched in the first nine months of 2025 alone, surpassing all of 2024.
- The behavioural feedback loop. Past gains condition investors to accept more complexity and more leverage. Providers race to meet that demand with increasingly specialised products. The result is a product launch acceleration that outpaces the market’s ability to absorb complexity prudently. That cycle tends to peak, not begin, late in a bull market.
The convergence matters more than any individual metric. Record margin, regulatory lag, and a product launch surge that is running ahead of investor comprehension: this combination has preceded sharper, more nonlinear moves when sentiment eventually turns.
How the rebalancing mechanism turns a selloff into something larger
The amplification risk in geared ETFs is not theoretical. It is a mechanical consequence of how these products are required to operate.
When a leveraged ETF’s underlying asset falls, the fund must reduce its exposure to maintain its target leverage ratio. That means selling into a falling market. That additional selling pushes prices lower, which can trigger further selling from other market participants, which pushes prices lower again. The mechanism is automatic, not discretionary.
When amplification becomes contagion: the behavioural layer
The scale of assets now involved means this effect is no longer marginal. JPMorgan estimated that in April 2026, approximately $100 billion in leveraged ETF rebalancing flows contributed to the S&P 500’s strongest month in over five years, with total net equity flows reaching approximately $190 billion (this figure has not been independently confirmed). Strategists described these flows as a “strong amplification force” in the rally.
The same mechanism works with equal force in the opposite direction. Barclays estimates that leveraged funds have accumulated roughly $300 billion in derivatives tied to single stocks and indices (this figure has not been independently confirmed). Record-high daily rebalancing demand has exceeded $50 billion on certain days.
Correlated automated de-risking compounds the forced rebalancing channel: when AI trading models trained on overlapping data encounter stress simultaneously, their exits can amplify the same price moves that geared ETF rebalancing is already accelerating, layering two mechanical amplifiers on top of each other.
Analysts have explicitly warned that $200+ billion in leveraged ETF assets could amplify the next selloff, particularly through forced rebalancing and rapid de-risking.
The April episode is the clearest available evidence that these products are already large enough to move markets in their current form. A reader who treats the rebalancing risk as an edge case is underestimating what is now a documented market-moving mechanism.
The behavioural channel compounds the mechanical one. Morningstar’s Mind the Gap research, analysed by Mark LaMonica CFA and Shani Jayamanne, tracked how the investor return gap (the difference between fund returns and the returns investors actually earn through their timing decisions) shifted with market conditions, finding it rose from roughly 1% in 2019 to roughly 2% in 2020 as COVID-driven volatility took hold. Higher-volatility products are associated with wider return gaps. Geared ETFs maximise both volatility and complexity. Faster losses generate panic selling, which generates more price pressure, which generates more panic selling. At scale, this is not irrational behaviour in isolation; it is a mechanical amplifier layered on top of an already mechanical amplifier.
Using geared ETFs prudently if you hold them
The systemic risk framing does not mean these products have no legitimate use. It means using them requires four specific disciplines, each designed to counteract a documented failure mode:
- A defined short-term objective. Geared ETFs are tactical tools. Holding one without a specific thesis and time horizon is the failure mode. Define what you are trying to capture and when you expect to exit before you enter.
- A genuine understanding of daily compounding. The failure mode here is assumption: believing a 3x ETF will deliver three times the underlying’s return over your holding period. It will not, particularly in volatile markets. Because of how compounding works, the route prices take through time shapes the outcome just as much as where they end up.
- Position sizing calibrated to elevated volatility. A 3x single-stock ETF will typically move far more than the underlying share. The failure mode is sizing a geared position the way you would size a direct equity holding. Morningstar’s guidance is explicit: treat these as high-volatility instruments, not amplified equivalents of a core holding.
- Pre-set exit conditions that override emotional responses. The Mind the Gap evidence demonstrates that investors in volatile products consistently sell at the worst possible moment when decisions are made reactively. The failure mode is reacting to a 15% intraday move without a pre-defined plan. Set your exit criteria before you enter.
Morningstar frames geared ETFs as tools, not core holdings. They may be appropriate for investors with a specific short-term view, high risk tolerance, and a genuine understanding of how daily compounding works.
Every one of these disciplines directly addresses a documented way investors have historically misused high-volatility products. The framework is not abstract; it is diagnostic.
What the current pattern tells investors who do not hold these products
The risk does not end when you confirm you own zero geared ETFs. The scale of this market changes the risk environment for all participants.
The picture the article has built has three layers. First, the scale is now systemically relevant: $200 billion in leveraged ETF assets, $1.5 trillion in margin debt, an estimated $300 billion in derivatives accumulated by leveraged funds (unverified), and 15-20% of ETF trading volume on active days. Second, the mechanics are inherently amplifying in both directions. Third, this expansion has occurred at a point in the market cycle where the late-cycle indicators, record margin, regulatory lag, product complexity acceleration, suggest the downside scenario is more plausible than it would be at the start of a bull run.
The specific scenario worth preparing for: a market decline of sufficient magnitude to trigger coordinated selling among geared ETF holders, producing forced rebalancing flows that push prices further than fundamentals justify. That scenario could create both defensive urgency and potential entry opportunities that would not exist in a market without this mechanical amplifier.
For investors wanting to understand the structural preconditions for a cascading selloff in detail, our full explainer on Nasdaq forced selling risk examines how loss-making long positions, margin calls, and institutional VaR constraints interact to convert crowded trades into self-reinforcing liquidation events.
Rather than a prediction, the actionable output is a monitoring framework. Three variables will tell you when the amplification risk is activating rather than merely potential:
- AUM growth in leveraged products. Continued rapid expansion means the mechanical amplifier is still building. A plateau or contraction signals a shift.
- Daily rebalancing demand levels. When daily rebalancing flows consistently exceed $50 billion, the scale of forced trading is large enough to move prices independently of fundamentals.
- Margin debt trajectory. Any evidence that margin debt is beginning to contract suggests the leverage cycle may be turning, and that the mechanical amplifiers could begin working in reverse.
Track those three signals. They will not tell you when markets will fall, but they will tell you when the infrastructure for an amplified decline is fully in place, and when it begins to unwind.
This article is for informational purposes only and should not be considered financial advice. Investors should conduct their own research and consult with financial professionals before making investment decisions. Past performance does not guarantee future results. Financial projections and forward-looking statements referenced in this article are subject to market conditions and various risk factors.