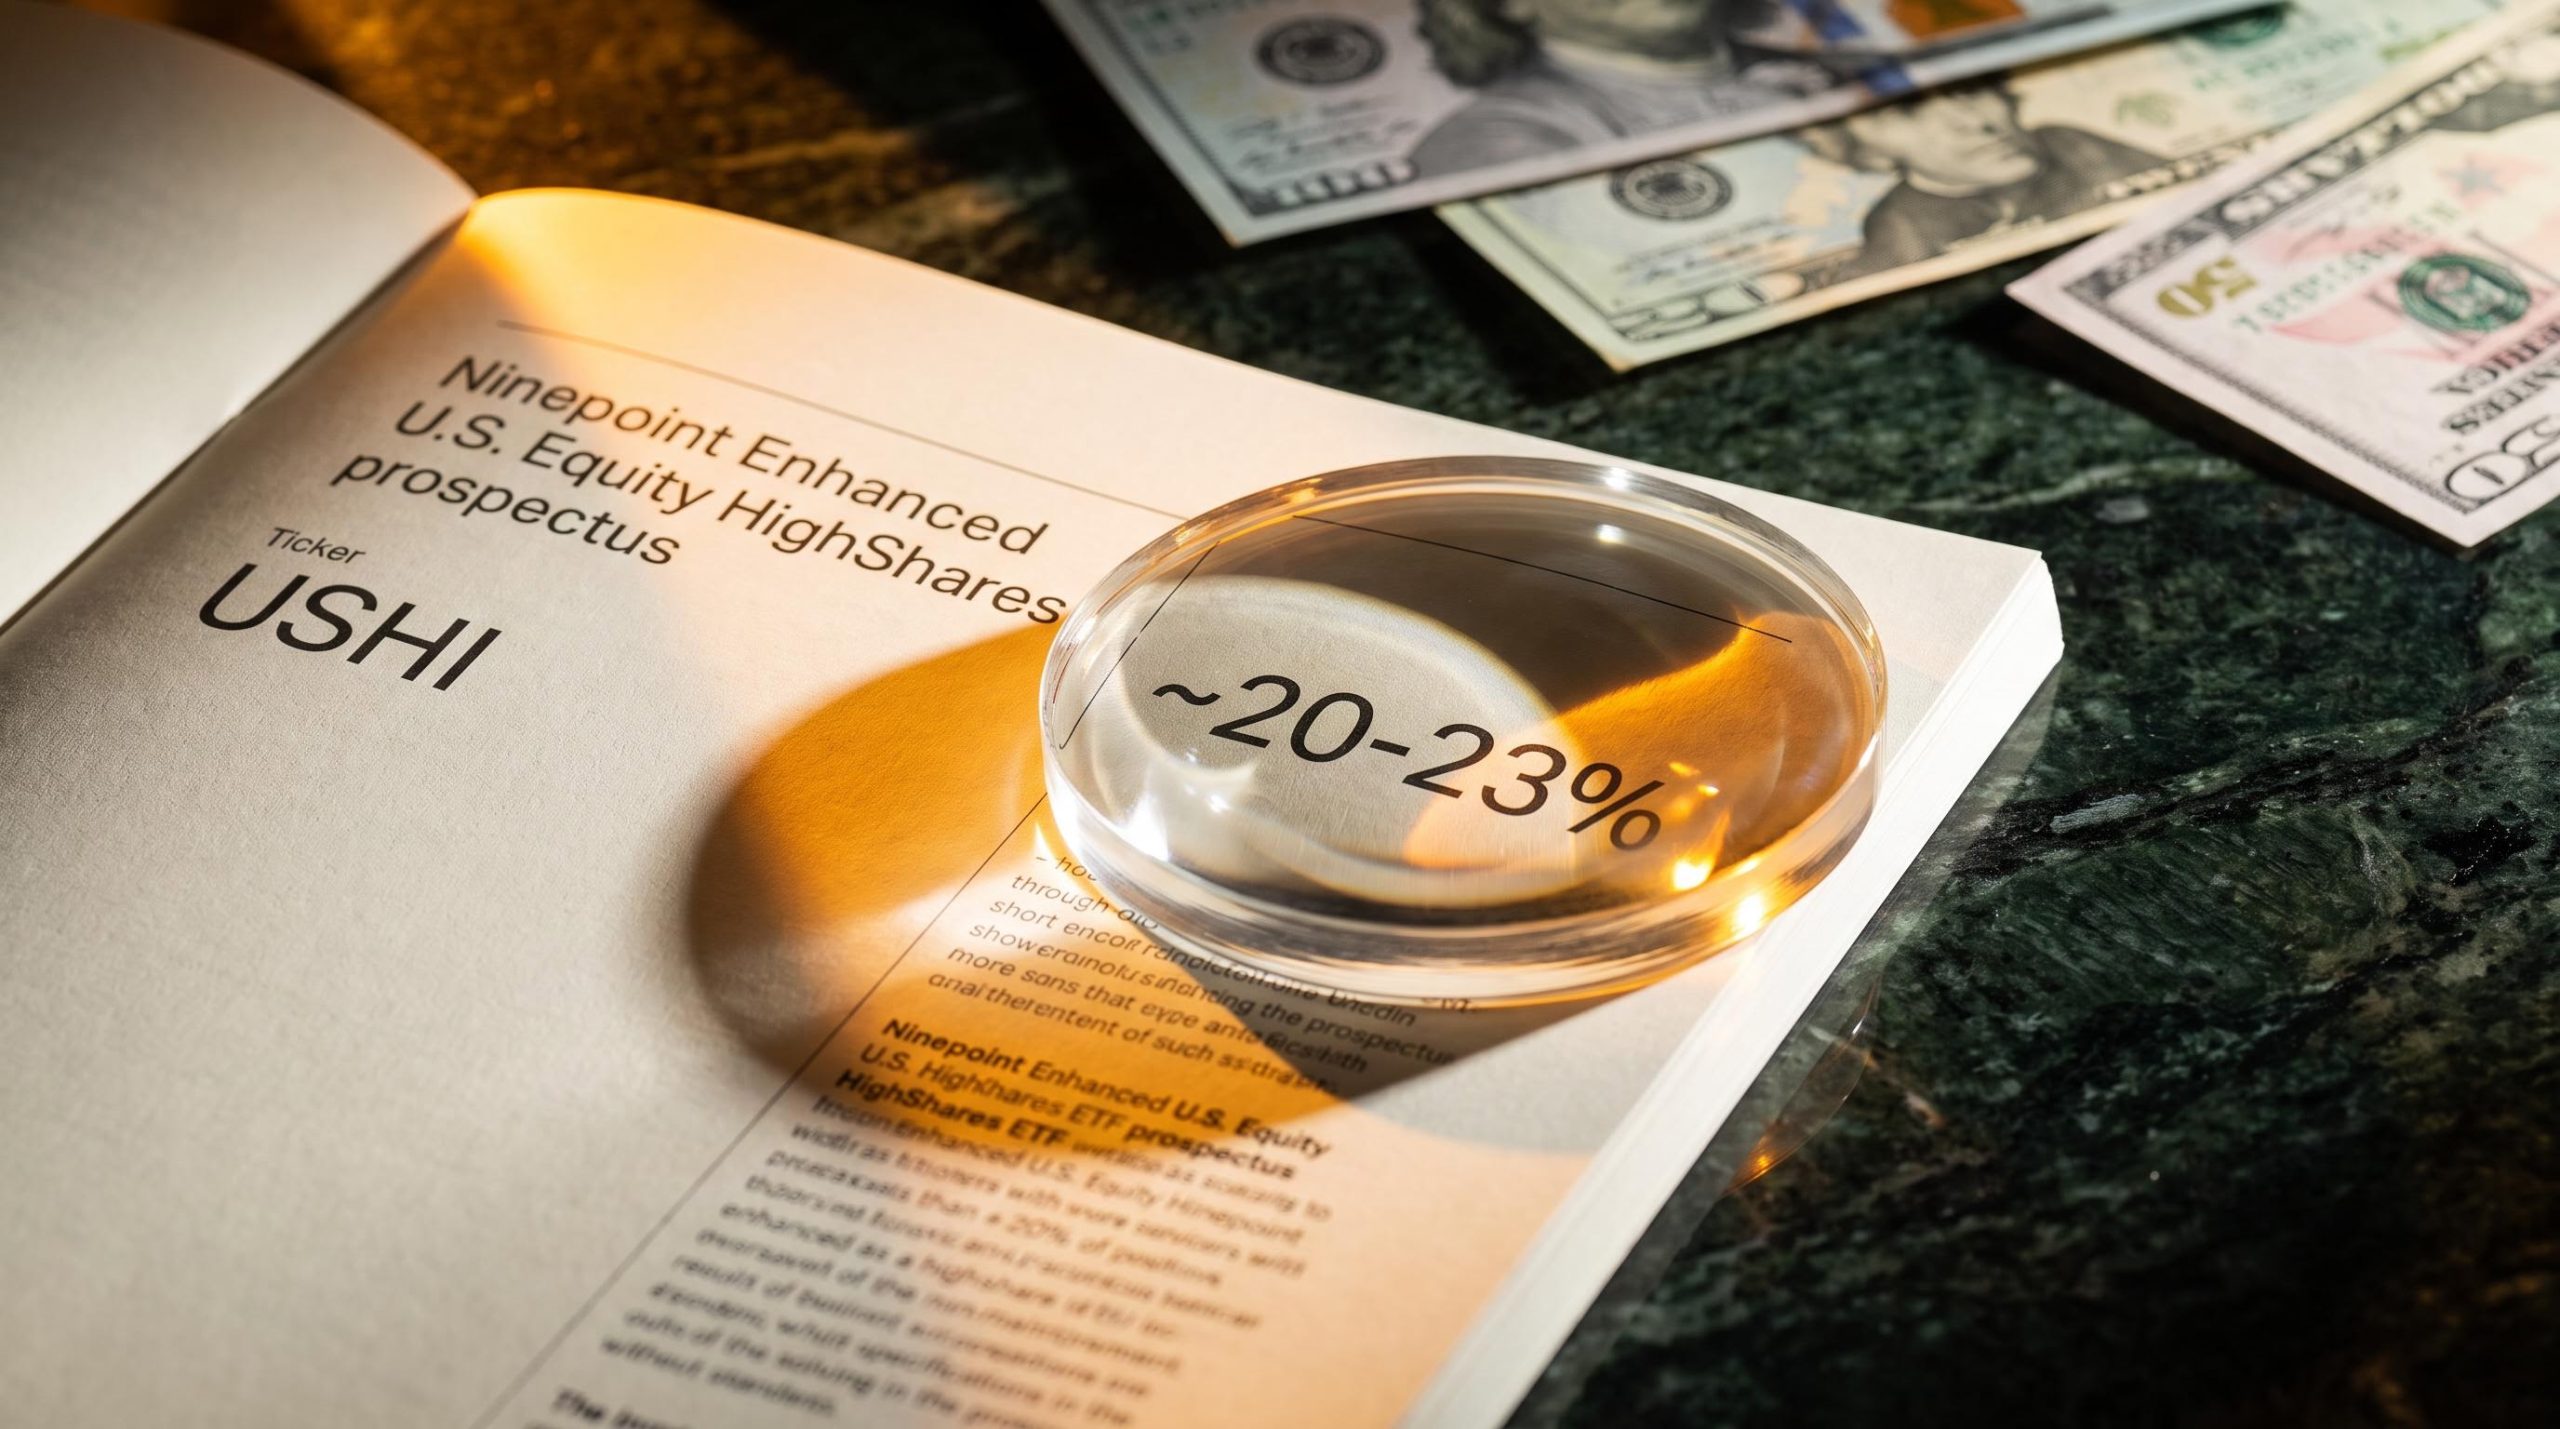
The Ninepoint Enhanced U.S. Equity HighShares ETF (TSX: USHI) began trading only days ago, on 14 September 2026, and it is already advertising twice-monthly distributions at a pace that implies an annualised yield somewhere in the low-to-mid 20s percent range. That is a number designed to catch an income investor’s eye before it invites any hard questions.
Covered-call ETFs promising outsized yields have multiplied across the Canadian market, and USHI enters that crowded field with a very specific structural bet. It pairs a diversified portfolio of roughly 20-25 U.S. large-cap stocks with an unhedged currency position, a modest leverage allowance, and an actively managed covered-call overlay.
Each of those design choices quietly shapes the gap between what the headline yield promises and what an investor will actually receive.
Here is what the analysis covers: a clear structural map of how USHI works, a realistic yield calibration anchored to what comparable peer funds have actually delivered, and an honest accounting of the risks the distribution rate does not surface on its own.
How USHI is built: portfolio, leverage, and covered-call mechanics
Every parameter inside USHI is a deliberate trade-off, and understanding them in sequence is the only way to read the yield figure honestly rather than at face value.
Start with the portfolio. USHI holds approximately 20-25 high-conviction U.S. large-cap companies spanning technology, financials, health care, energy, and utilities, and it launched at $10 per unit on 14 September 2026. That breadth is a choice: a wider, steadier portfolio smooths volatility but, as the yield section will show, that same steadiness caps the income the fund can generate.
The covered-call overlay is where much of the income comes from. A covered call means the fund sells another investor the right to buy its shares at a set price, collecting a cash premium for taking on that obligation. USHI may write these calls on up to 50% of net asset value, but that ceiling is not the operational reality.
Based on how comparable funds behave, the actual overwrite ratio is estimated to sit in the high-30s to low-40s percent range, though this is an analyst estimate rather than an officially disclosed figure.
That gap matters. By keeping the overlay below its 50% ceiling, Ninepoint is preserving some upside optionality on the portfolio rather than squeezing out every last dollar of premium, and that restraint directly limits how high the yield can realistically climb.
Here are the six structural parameters that define the fund:
- Portfolio size: 20-25 U.S. large-cap companies
- Covered-call maximum: up to 50% of NAV
- Estimated actual covered-call ratio: high-30s to low-40s percent (analyst estimate)
- Leverage permitted: up to 33%
- Management fee: 0.40%
- Risk rating: medium-to-high
One more distinction worth naming: USHI holds no cryptocurrency-related positions whatsoever, which separates it from some higher-octane competitors that lean on crypto-adjacent volatility to juice their premiums.
First distribution anchor USHI announced an initial bi-monthly distribution of $0.0625 per unit, payable on or about 6 October 2026 to holders of record on 29 September 2026.
What the 33% leverage provision actually does to income and risk
Leverage is permitted, not mandated. USHI can borrow to invest up to 33% on top of its base portfolio, but actual usage will vary with market conditions and management discretion.
The effect cuts both ways. Leverage amplifies the income the fund can distribute, but it equally amplifies drawdowns when the underlying stocks fall. Treat that 33% figure as a ceiling the fund can lean toward, not a fixed setting it operates at every day.
The combination of leverage and call-writing overlay has been tested across a live 20-month dataset in comparable Canadian-listed products, with one leveraged covered-call fund delivering total returns broadly matching an unleveraged benchmark equivalent while maintaining a 13.45% income yield, providing empirical context for what USHI’s own leverage allowance might produce over a similar horizon.
When big ASX news breaks, our subscribers know first
What yield to realistically expect, and why the estimate sits where it does
The headline number is tempting, but the achievable yield is built from the ground up, and the ground here is a diversified blue-chip portfolio that structurally limits how much premium the fund can collect.
The estimate lands in the 20-23% range, with 25% possible but unlikely. That is not a management projection; it is a figure that falls out of the volatility characteristics of what USHI actually holds.
Here is the mechanism. Covered-call premiums are a direct function of expected volatility, so the more a stock is expected to move, the more an option buyer will pay for the right to it. A diversified portfolio of steady large-cap names carries lower implied volatility than a concentrated basket of high-beta or single-stock exposures, which means the premiums USHI collects are structurally smaller.
The relationship is measurable. Premiums available when the VIX (the market’s expected-volatility index) sits near 25 are roughly twice those available when it sits near 13.
The single mechanism to internalise At a VIX of 25, collected option premiums are approximately double those available at a VIX of 13. Yield on a covered-call fund is not a fixed dial. It rises and falls with market volatility, and a calm market means thinner income.
That is precisely why USHI’s estimate sits below its highest-yielding peers. A steadier portfolio produces cheaper option premiums, and cheaper premiums produce a lower yield.
Then there is the part of the distribution that is not income at all. Covered-call ETF payouts frequently contain a large slice of return of capital, meaning the fund hands back a portion of your original investment rather than money the portfolio actually earned. In peer covered-call funds, 40-80% of distributions typically consists of this return of capital rather than genuine economic income.
For you, that reframes the entire proposition. A yield in the low-20s is genuinely high in absolute terms, but if a meaningful portion of each cheque is your own capital coming back, the real economics of holding USHI are more modest than the headline rate suggests.
The return of capital mechanics inside covered-call distributions are more consequential than most income investors initially appreciate: each ROC payment reduces your adjusted cost base rather than triggering immediate tax, deferring the obligation until units are sold but quietly reshaping the real economics of every cheque received.
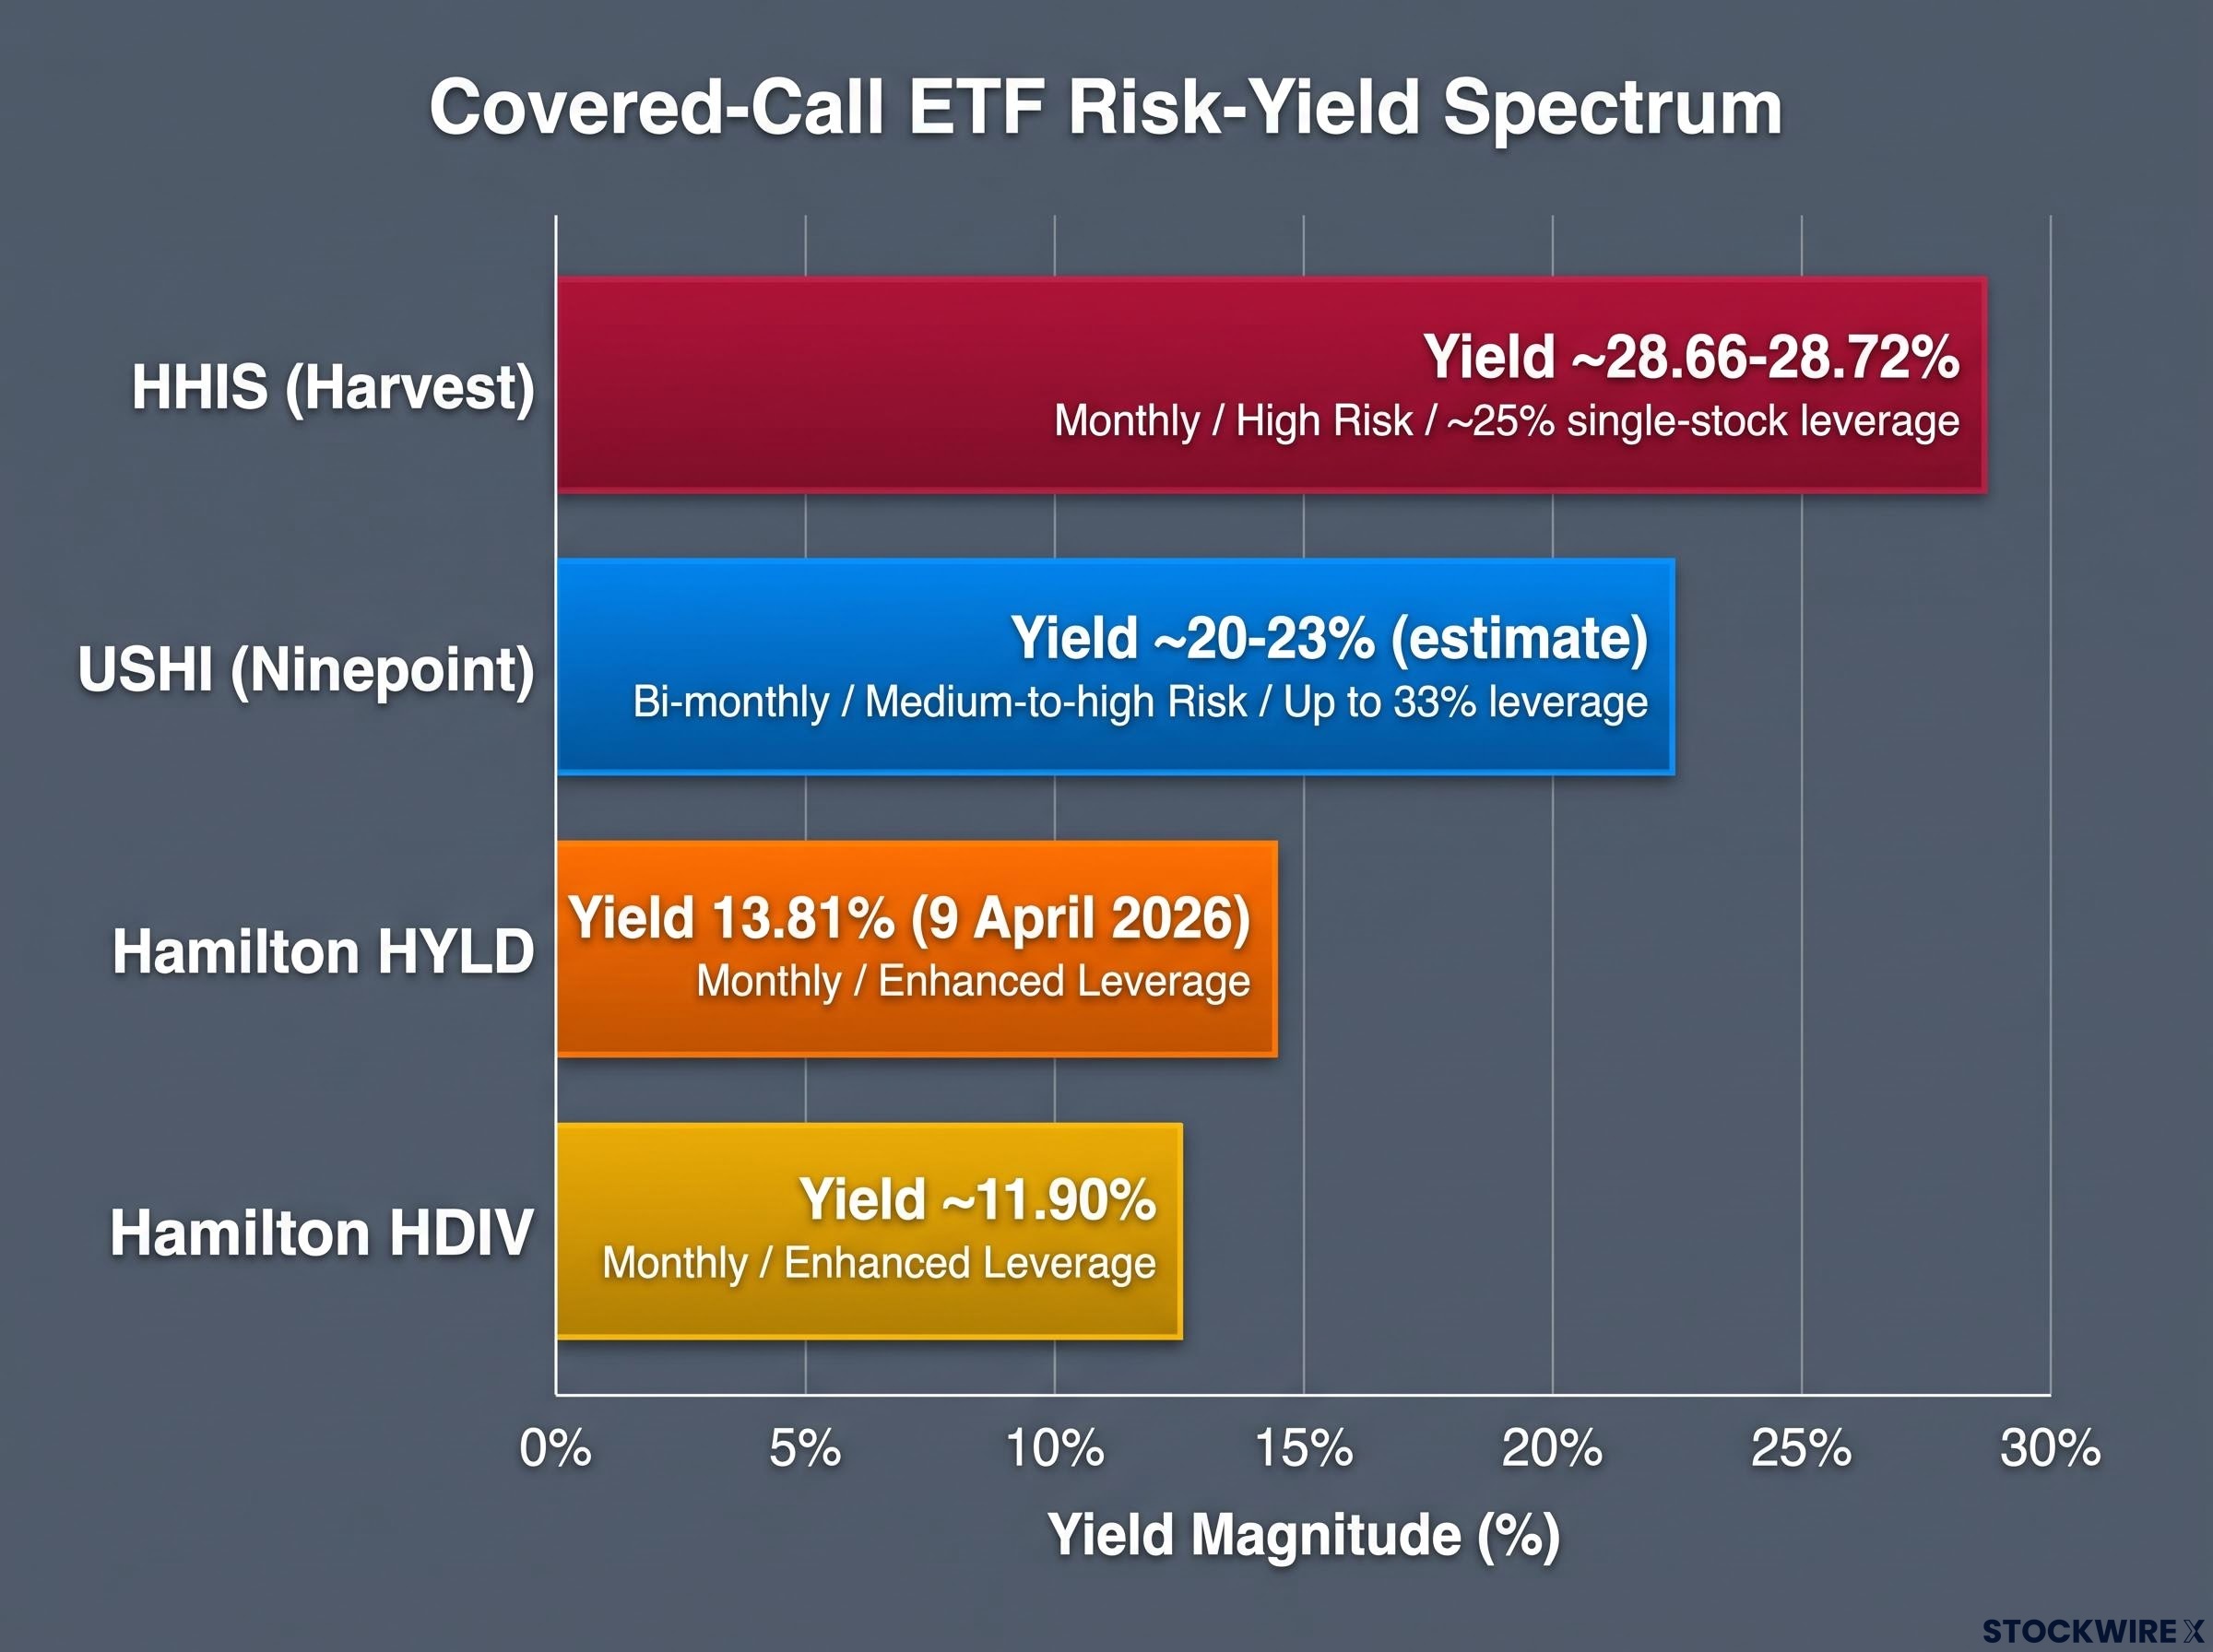
The table below places USHI alongside three established peers to show where it sits on the risk-yield spectrum.
| Fund | Estimated/Reported Yield | Distribution Frequency | Leverage | Risk Rating |
|---|---|---|---|---|
| USHI (Ninepoint) | ~20-23% (estimate) | Bi-monthly | Up to 33% | Medium-to-high |
| HHIS (Harvest) | ~28.66-28.72% | Monthly | ~25% on single-stock ETFs | High |
| Hamilton HYLD | 13.81% (9 April 2026) | Monthly | Enhanced | Not stated |
| Hamilton HDIV | ~11.90% | Monthly | Enhanced | Not stated |
HHIS reaches its higher 28.66-28.72% yield partly because it applies roughly 25% leverage to more volatile single-stock ETFs. USHI trades some of that yield for a broader, steadier base.
NAV erosion in concentrated strategies is a risk the yield table obscures: high-distribution funds relying on single-stock option premiums can see capital bases quietly eroded by 5-10% annually, a dynamic that makes the headline yield comparison between USHI and HHIS less straightforward than it first appears.
Currency exposure and the unhedged CAD/USD position
USHI is fully unhedged to the Canadian dollar, and that is neither a flaw nor a selling point. It is a decision with directional consequences that will help you in one scenario and cost you in another.
Being unhedged means every U.S.-dollar return the fund generates is converted at the prevailing CAD/USD exchange rate when you measure your results in Canadian dollars. The currency layer sits on top of the equity performance, entirely separate from it.
The logic is straightforward. A stronger U.S. dollar lifts your returns as those USD gains translate into more loonies, while a stronger Canadian dollar erodes them. This happens regardless of how well the underlying American stocks actually perform.
That last point is easy to underestimate. A rising Canadian dollar during a period of only modest U.S. equity gains can leave an unhedged holder with flat or even negative results measured in Canadian dollars, even when the portfolio itself did its job.
Ninepoint chose this path for a reason. Hedging CAD/USD exposure typically drags returns by 0.30-0.70 percentage points per year through hedging costs and tracking error, and over long horizons that persistent cost often outweighs the benefit of smoothing currency swings.
Matching currency stance to portfolio intent
Where you land depends on your own currency view:
- Expect USD strength: The unhedged structure works in your favour, adding a currency tailwind on top of the fund’s income.
- Expect CAD strength: The structure introduces a headwind that can meaningfully offset the headline yield, entirely independent of how Ninepoint manages the portfolio.
- No strong currency view: You accept currency noise in exchange for avoiding the annual hedging drag, which suits longer holding periods.
Before committing, check whether your other holdings are hedged or unhedged. If you already hold significant Canadian-dollar assets elsewhere, USHI’s full USD exposure can act as a useful diversifying counterweight rather than an unwanted risk.
How USHI compares to peer funds and who it is built for
The peer data does not flatten USHI into just another high-yield product. It sharpens the picture, showing exactly where the fund sits on the risk-yield spectrum and who it was actually designed for.
Start with the yield gap. USHI’s estimated 20-23% sits below HHIS’s confirmed 28.66-28.72%, and that is a structural consequence rather than a weakness. HHIS carries a high risk rating and applies roughly 25% leverage to volatile single-stock ETFs; USHI accepts a lower yield in exchange for a more diversified, medium-to-high risk base and its own leverage allowance of up to 33%.
That places USHI in a deliberate middle band. It offers more income than a plain covered-call index fund but less risk concentration than a single-stock or high-beta vehicle, and the question for you is whether that middle position matches your actual income needs and risk tolerance.
To anchor expectations, it helps to see what a comparable peer has actually paid out over a full year of operation.
What a peer has delivered Since its inception around January 2025, HHIS has distributed approximately $4.96 per unit, its monthly distribution rising from an initial $0.25 target to $0.27 over roughly its first 12 months.
The lower end of the covered-call spectrum sets the other boundary. Hamilton HYLD carried a trailing annualised yield of 13.81% as of 9 April 2026, and Hamilton HDIV runs an annualised distribution rate of roughly 11.90%. USHI’s estimate sits comfortably above both, reinforcing its middle-band position.
The investors most likely to benefit, ordered from best fit downward:
- The income-focused retiree supplementing cash flow, who prioritises regular distributions over capital growth and is comfortable with return-of-capital payouts.
- The USD-bullish investor seeking diversified U.S. equity income, who wants the currency tailwind that the unhedged structure can provide.
- The tactical income allocator balancing a growth-heavy portfolio, who uses USHI as a deliberate income counterweight rather than a core holding.
The clean way to frame the decision is a left-right axis. On one side sits a higher-yield, higher-risk concentrated fund like HHIS; on the other, a low-cost broad U.S. equity index ETF for total-return investors. USHI occupies the ground between them.
What the data still cannot tell you, and what to watch in the months ahead
With the structure assessed and the peers mapped, the honest position is that some of the most important numbers do not yet exist. The next few months will produce them.
Three data points will ultimately define USHI’s real investment case, and all three are confirmed unavailable as of 15 September 2026: its confirmed trailing yield, its official NAV trajectory, and the actual covered-call overwrite ratio the fund uses in practice.
The first 3-6 months of distributions form the critical evidence window. The initial $0.0625 bi-monthly distribution, with a record date of 29 September 2026 and payment on or about 6 October 2026, is a commitment rather than a guarantee, and it can shift as market conditions evolve.
Peer history shows why the launch figure is a poor guide to the 12-month average. HHIS started at a $0.25 monthly target and climbed to $0.27 as conditions supported it. Hamilton HYLD ran the opposite way, with early distributions around $0.199 normalising down to a $0.153-$0.164 range over time.
The total cost of ETF ownership across a covered-call fund like USHI extends well beyond its 0.40% management fee: bid-ask spreads, securities lending pass-through rates, and rebalancing friction each contribute incremental costs that only become visible once the fund has accumulated enough trading history to compare its NAV trajectory against its theoretical benchmark.
For you, the takeaway is to hold expectations loosely. A covered-call fund’s first distribution can either rise or compress, and locking in an assumption based on the launch cheque risks a surprise in either direction without any understanding of why.
How to read the first year of USHI distribution announcements
Each Ninepoint distribution press release will confirm the per-unit amount and the record and payment dates. It will not confirm the split between return of capital and genuine income until tax reporting season, so the true economic quality of each payout stays hidden for months.
Track these three signals over the first six months:
- Per-unit distribution stability: Watch whether the amount holds, rises, or falls across the first three bi-monthly announcements rather than reading any single one as steady-state.
- Official NAV trend: Compare the published NAV against the $10 launch price to see whether capital is being preserved or quietly eroded.
- CAD/USD movement: Monitor the exchange rate alongside distributions, since currency swings will move your total return in ways the distribution notices alone will never capture.
Placing USHI in a portfolio with realistic expectations
Pulled together, USHI is a legitimate income tool with a clearly defined shape: 20-25 U.S. large-cap stocks, leverage of up to 33%, an estimated 20-23% yield, a medium-to-high risk rating, full USD exposure, and a 0.40% management fee. Whether it belongs in your portfolio depends on how honestly you can accept those terms.
USHI makes sense as a holding when the following conditions hold:
- You prioritise cash flow over capital growth.
- You understand that 40-80% of covered-call distributions can be return of capital, which lowers your adjusted cost base over time.
- You hold a neutral-to-bullish view on the U.S. dollar against the loonie.
- You are comfortable with medium-to-high risk.
It is the wrong tool if any of these describe you:
- You need capital preservation above all.
- You expect the Canadian dollar to strengthen meaningfully.
- You benchmark against broad equity indices and expect total-return growth.
The investor who enters knowing the yield is partly their own capital returning, that currency moves affect real return independently of stock performance, and that the call structure caps upside, is the investor who can use this fund on its own terms rather than being disappointed by what it was never built to do.
Revisit the case after three to four distribution cycles, starting with the first payment on 6 October 2026, when actual yield, NAV trajectory, and currency impact become observable rather than estimated.
This article is for informational purposes only and should not be considered financial advice. Investors should conduct their own research and consult with financial professionals before making investment decisions.
Past performance does not guarantee future results. Yield estimates and financial projections referenced here are analyst estimates subject to market conditions and various risk factors, and are not official figures disclosed by Ninepoint.