A drone strike in the Saudi desert, roughly 7,000 miles from Wall Street, just pushed the yield on the 10-year US Treasury note above 5% for the first time since October 2023.
That is the reality investors woke up to. A physical attack on foreign energy infrastructure has landed directly in the American bond market, and the connection is anything but abstract.
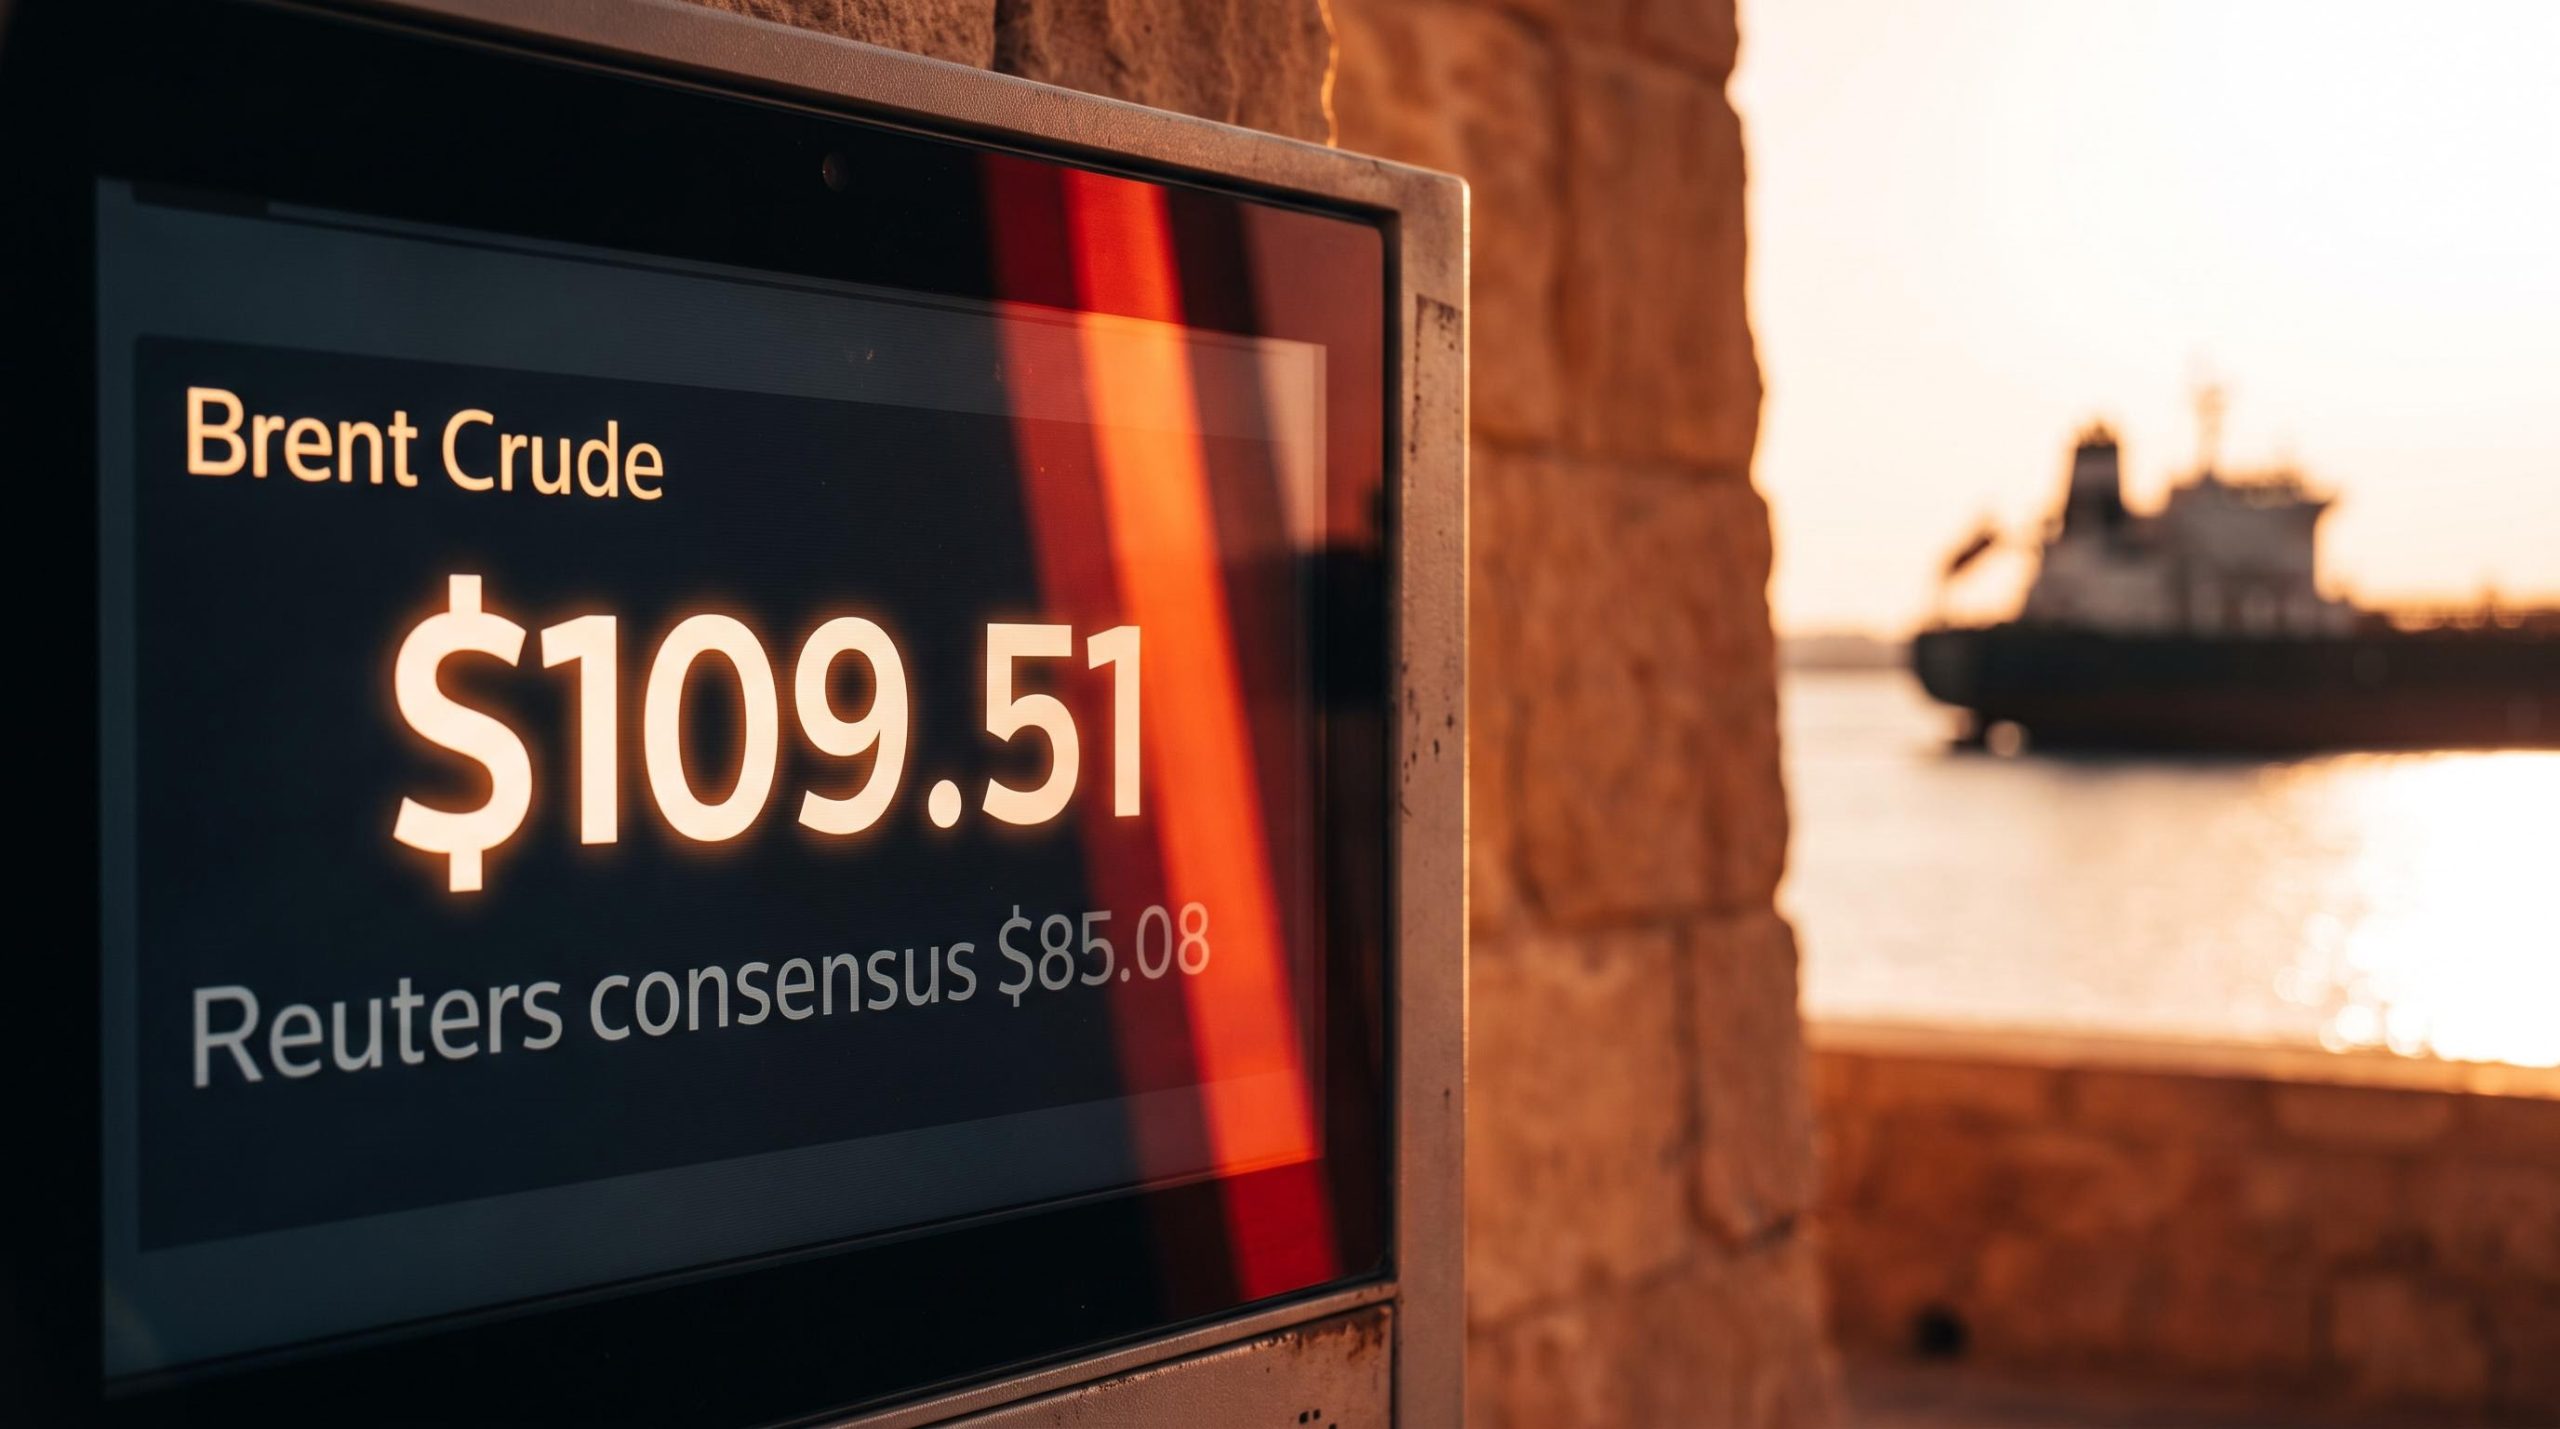
Here is what happened on the ground. Saudi Arabia’s East-West crude pipeline, the artery known as the Petroline, is offline under a temporary precautionary shutdown after drone attacks struck pump stations in mid-September 2026. Brent crude spiked more than 8% in a week to cross $108 per barrel.
The timing could hardly be worse for US investors. The Federal Reserve meets on 16 September, and this oil shock is colliding with a rate decision that markets were already nervous about.
This piece gives you a clear, step-by-step framework for understanding exactly how a commodity supply shock feeds into bond yields, and how those yields then ripple outward across equities, currencies, and credit. Once you can trace that chain, a headline about a foreign pipeline stops being noise and starts being a signal you can act on.
The strategic vulnerability of the East-West pipeline
Start with the raw physical scale. The Petroline runs roughly 1,200 km from the Abqaiq processing area in Saudi Arabia’s Eastern Province to the Red Sea export terminal at Yanbu. It carries crude from the Gulf side of the country to the coast, where it can be loaded onto tankers.
The numbers are large. The pipeline has a design capacity of approximately 7 million barrels per day, and pre-shutdown throughput was running at 4-5 million barrels per day, according to Reuters and multiple independent outlets. That is roughly 4-5% of global oil supply moving through a single corridor.
But capacity is only half the story. The real significance is where that crude would otherwise have to travel.
The Wall Street Journal has characterised the Petroline as a “crucial Hormuz bypass.” That phrase captures the strategic point precisely.
The Petroline’s role as a Hormuz bypass is what makes this shutdown structurally different from a standard production outage: VLCC daily hire rates, currently tracking near $110,000 per day, are the physical market signal that quantifies how much rerouting through the strait is already costing the system.
The pipeline lets Saudi Arabia move crude to the Red Sea without sending it through the Strait of Hormuz, the high-risk chokepoint at the mouth of the Gulf. It is, in effect, the kingdom’s safety valve for exports.
With the line down, that safety valve is closed. Saudi crude now has to lean more heavily on Hormuz itself, or take slower, costlier routes with lower capacity. Analysis from the Foundation for Defense of Democracies notes that Abqaiq, which stabilises around 7% of global crude, had been routing most of its output through this corridor to Yanbu.
The attacks themselves fit a broader pattern. A Reuters summary of an International Energy Agency assessment points to multiple strike points on Saudi infrastructure and regional shipping, framing the problem as systemic vulnerability rather than a single isolated hit.
Repairs are expected to take approximately 3-5 weeks, based on reporting from AP News and The Guardian.
Here is what the loss of that bypass means for you. The geopolitical risk premium built into your energy exposure is no longer a theoretical line item. It is a live vulnerability sitting inside the plumbing of global supply chains, and it explains why markets react so violently to a conflict that, on a map, looks a very long way away.
When big ASX news breaks, our subscribers know first
How a physical energy shock pushes bond yields higher
The link between a damaged pipeline and a US bond yield is not magic. It is a mechanical sequence, and once you see the steps, you can run the logic yourself the next time a supply shock hits.
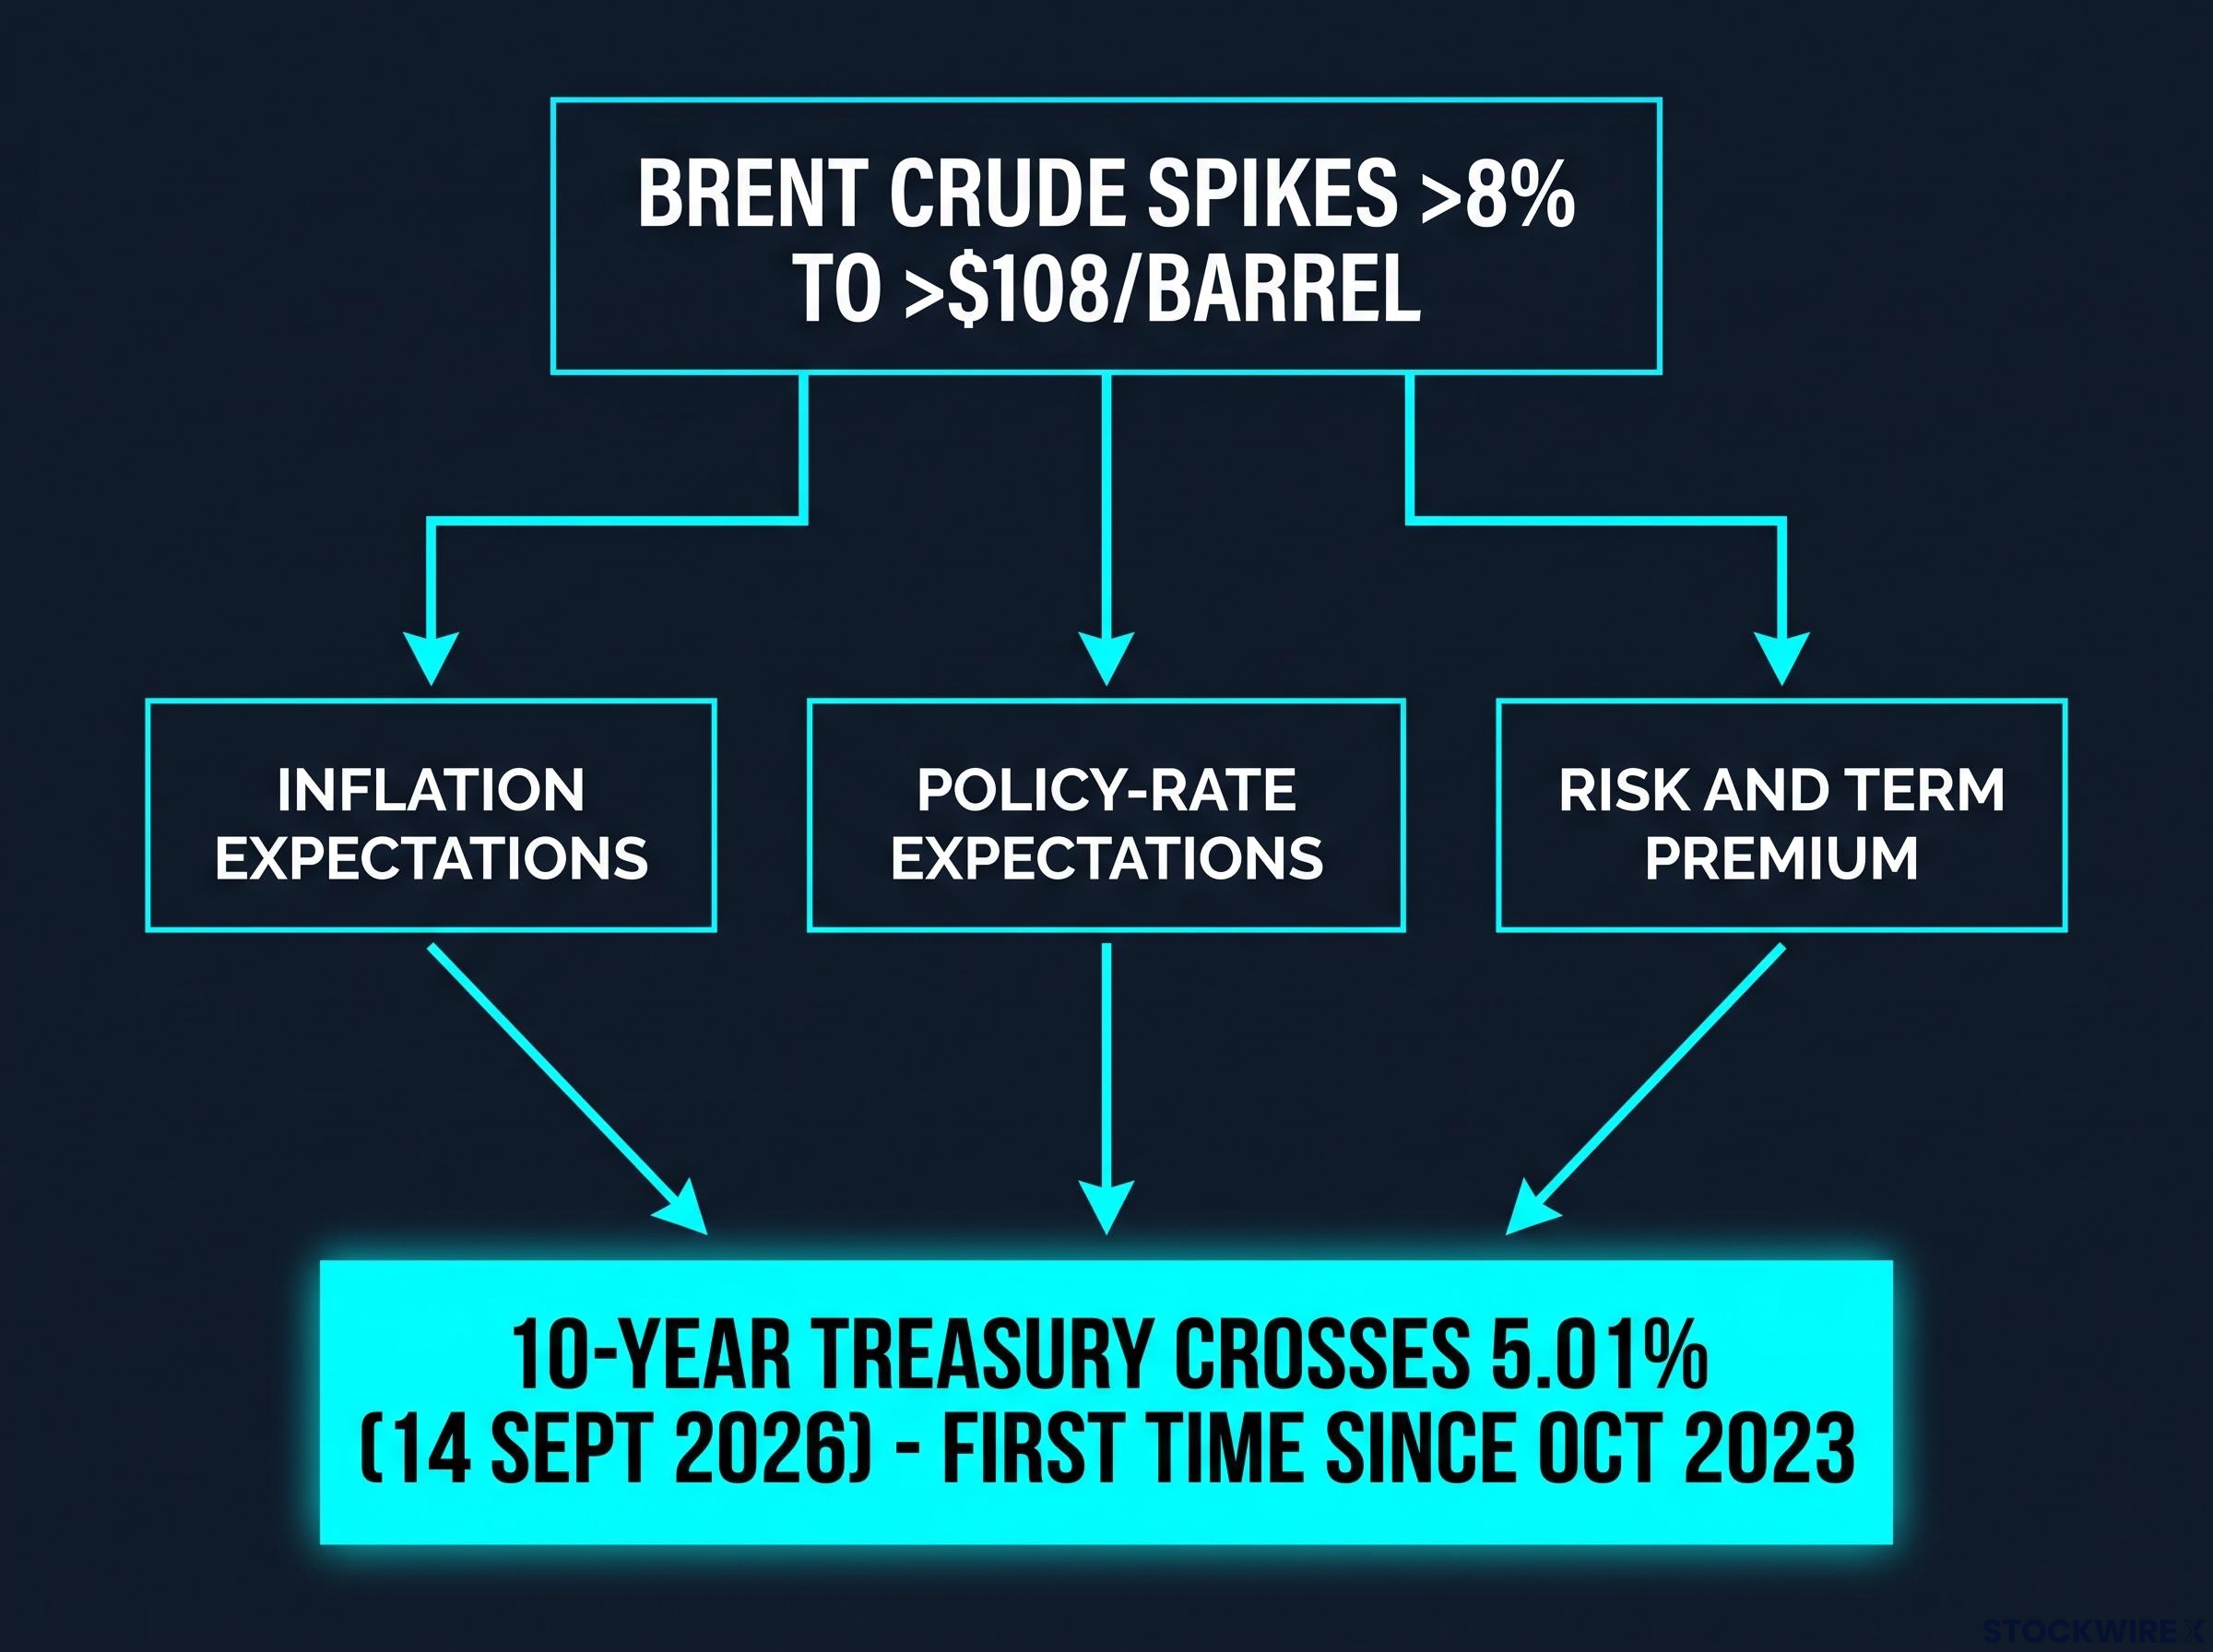
The 10-year Treasury yield crossed 5.01% intraday on 14 September 2026. Three separate channels pushed it there.
- Inflation expectations. A sharp jump in oil prices raises expected headline inflation over the coming quarters. Bond investors demand extra compensation for that future inflation, so nominal yields (the stated yield before adjusting for inflation) rise. An oil move of more than 8% in a week is a meaningful inflationary signal.
- Policy-rate expectations. An oil-driven inflation scare strengthens the case that the Fed will need to tighten more, or hold rates higher for longer. That lifts the expected path of future short-term rates, and since long-term yields partly reflect where short rates are heading, the 10-year gets dragged upward.
- Risk and term premium. A more uncertain macro backdrop, especially one leaning toward stagflation, pushes investors to demand an additional cushion for holding long-dated bonds at all.
That third channel deserves its own explanation, because it is doing more work here than most headlines acknowledge.
The term premium driving the 10-year above 5% is primarily a fiscal risk and heavy Treasury supply story rather than a pure inflation-expectations move, which is why Fed Chair Warsh framed rising market yields at Jackson Hole as policy tightening happening on the market’s own initiative.
The term premium effect
The term premium is the extra yield you demand for locking your money into a long-dated bond instead of rolling over short-term ones. When the future looks predictable, that premium is small. When it looks murky, you want to be paid more to take the risk.
Stagflation is the murkiest scenario of all. It combines weak growth with high inflation, which is the one environment where bonds struggle to protect you: inflation erodes your fixed coupon while slowing growth threatens the economy behind it.
When an energy shock raises the odds of exactly that outcome, the term premium expands quickly. That is a large part of why the 10-year pushed through 5% rather than settling at a more modest level.
Now the important distinction. Nominal yields, the headline number you see quoted, rose sharply here. Real yields, which strip out inflation, rose more modestly, because much of the move reflects inflation compensation rather than a pure rise in the underlying cost of money.
This is the part that should change how you think about your holdings. The comforting assumption that government bonds always rally as a safe haven during a geopolitical crisis breaks down when the crisis is an inflation shock. In that case, your bonds can lose value at precisely the moment you expected them to protect you.
Colliding with the Federal Reserve rate path
An external oil shock is difficult enough on its own. This one is crashing straight into one of the most sensitive domestic policy decisions of the year.
The pipeline shutdown lands days before the Fed’s 16 September meeting, and it hardens an inflation narrative that was already building. Earlier in the month, the picture looked far less certain.
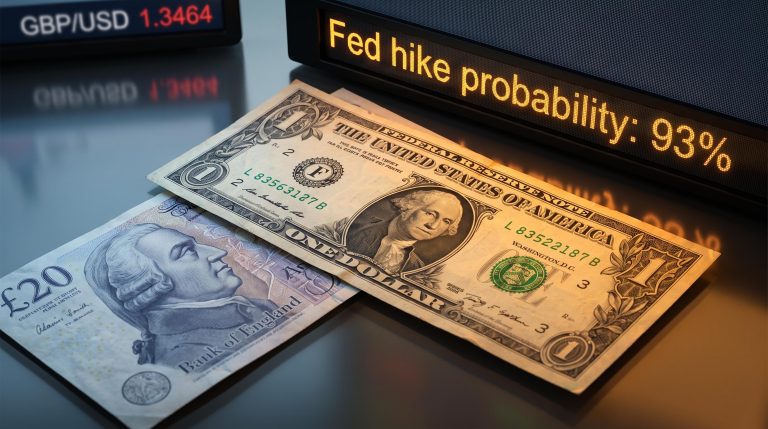
On 1 September 2026, the CME FedWatch tool showed a 66.4% probability of a 25-basis-point hike, according to market commentary from Hiroki Miyano. By the days before the meeting, that figure had surged to 93%, per Prime Terminal data, leaving only a 7% chance of no move at all.
The oil-to-Fed transmission loop became active quickly in this cycle: after the Jackson Hole keynote in late August 2026, September hike odds shifted roughly 25 percentage points in a single session, concrete evidence that commodity prices and rate expectations are repricing on the same clock.
| Date | Probability of 25bp hike | Implied benchmark rate range |
|---|---|---|
| 1 September 2026 | 66.4% | 3.50% – 3.75% (current) |
| Days before meeting | 93% | 3.75% – 4.00% (expected) |
The expected move would lift the benchmark rate from the 3.50%-3.75% range to 3.75%-4.00%.
Here is why that cascade matters for the bond market. Higher expected short-term rates feed directly up the yield curve, because long-term yields are built partly on the market’s forecast of where short rates are going. Firmer hike odds therefore help cement the 10-year above 5%.
The lesson for you is about speed. The jump from a roughly two-in-three chance of a hike to a near-certainty shows how fast a single external event can invalidate the interest rate assumptions your portfolio was built on. Watching Fed funds futures probabilities during a crisis is not a spectator sport: they are the bridge between a raw commodity shock and the actual borrowing costs that will shape your returns over the next year.
Mapping the cross-asset ripple effects
Once the yield moves, the shock does not stay contained in the bond market. It fans out, and knowing the pattern lets you survey your whole portfolio at a glance rather than reacting asset by asset.
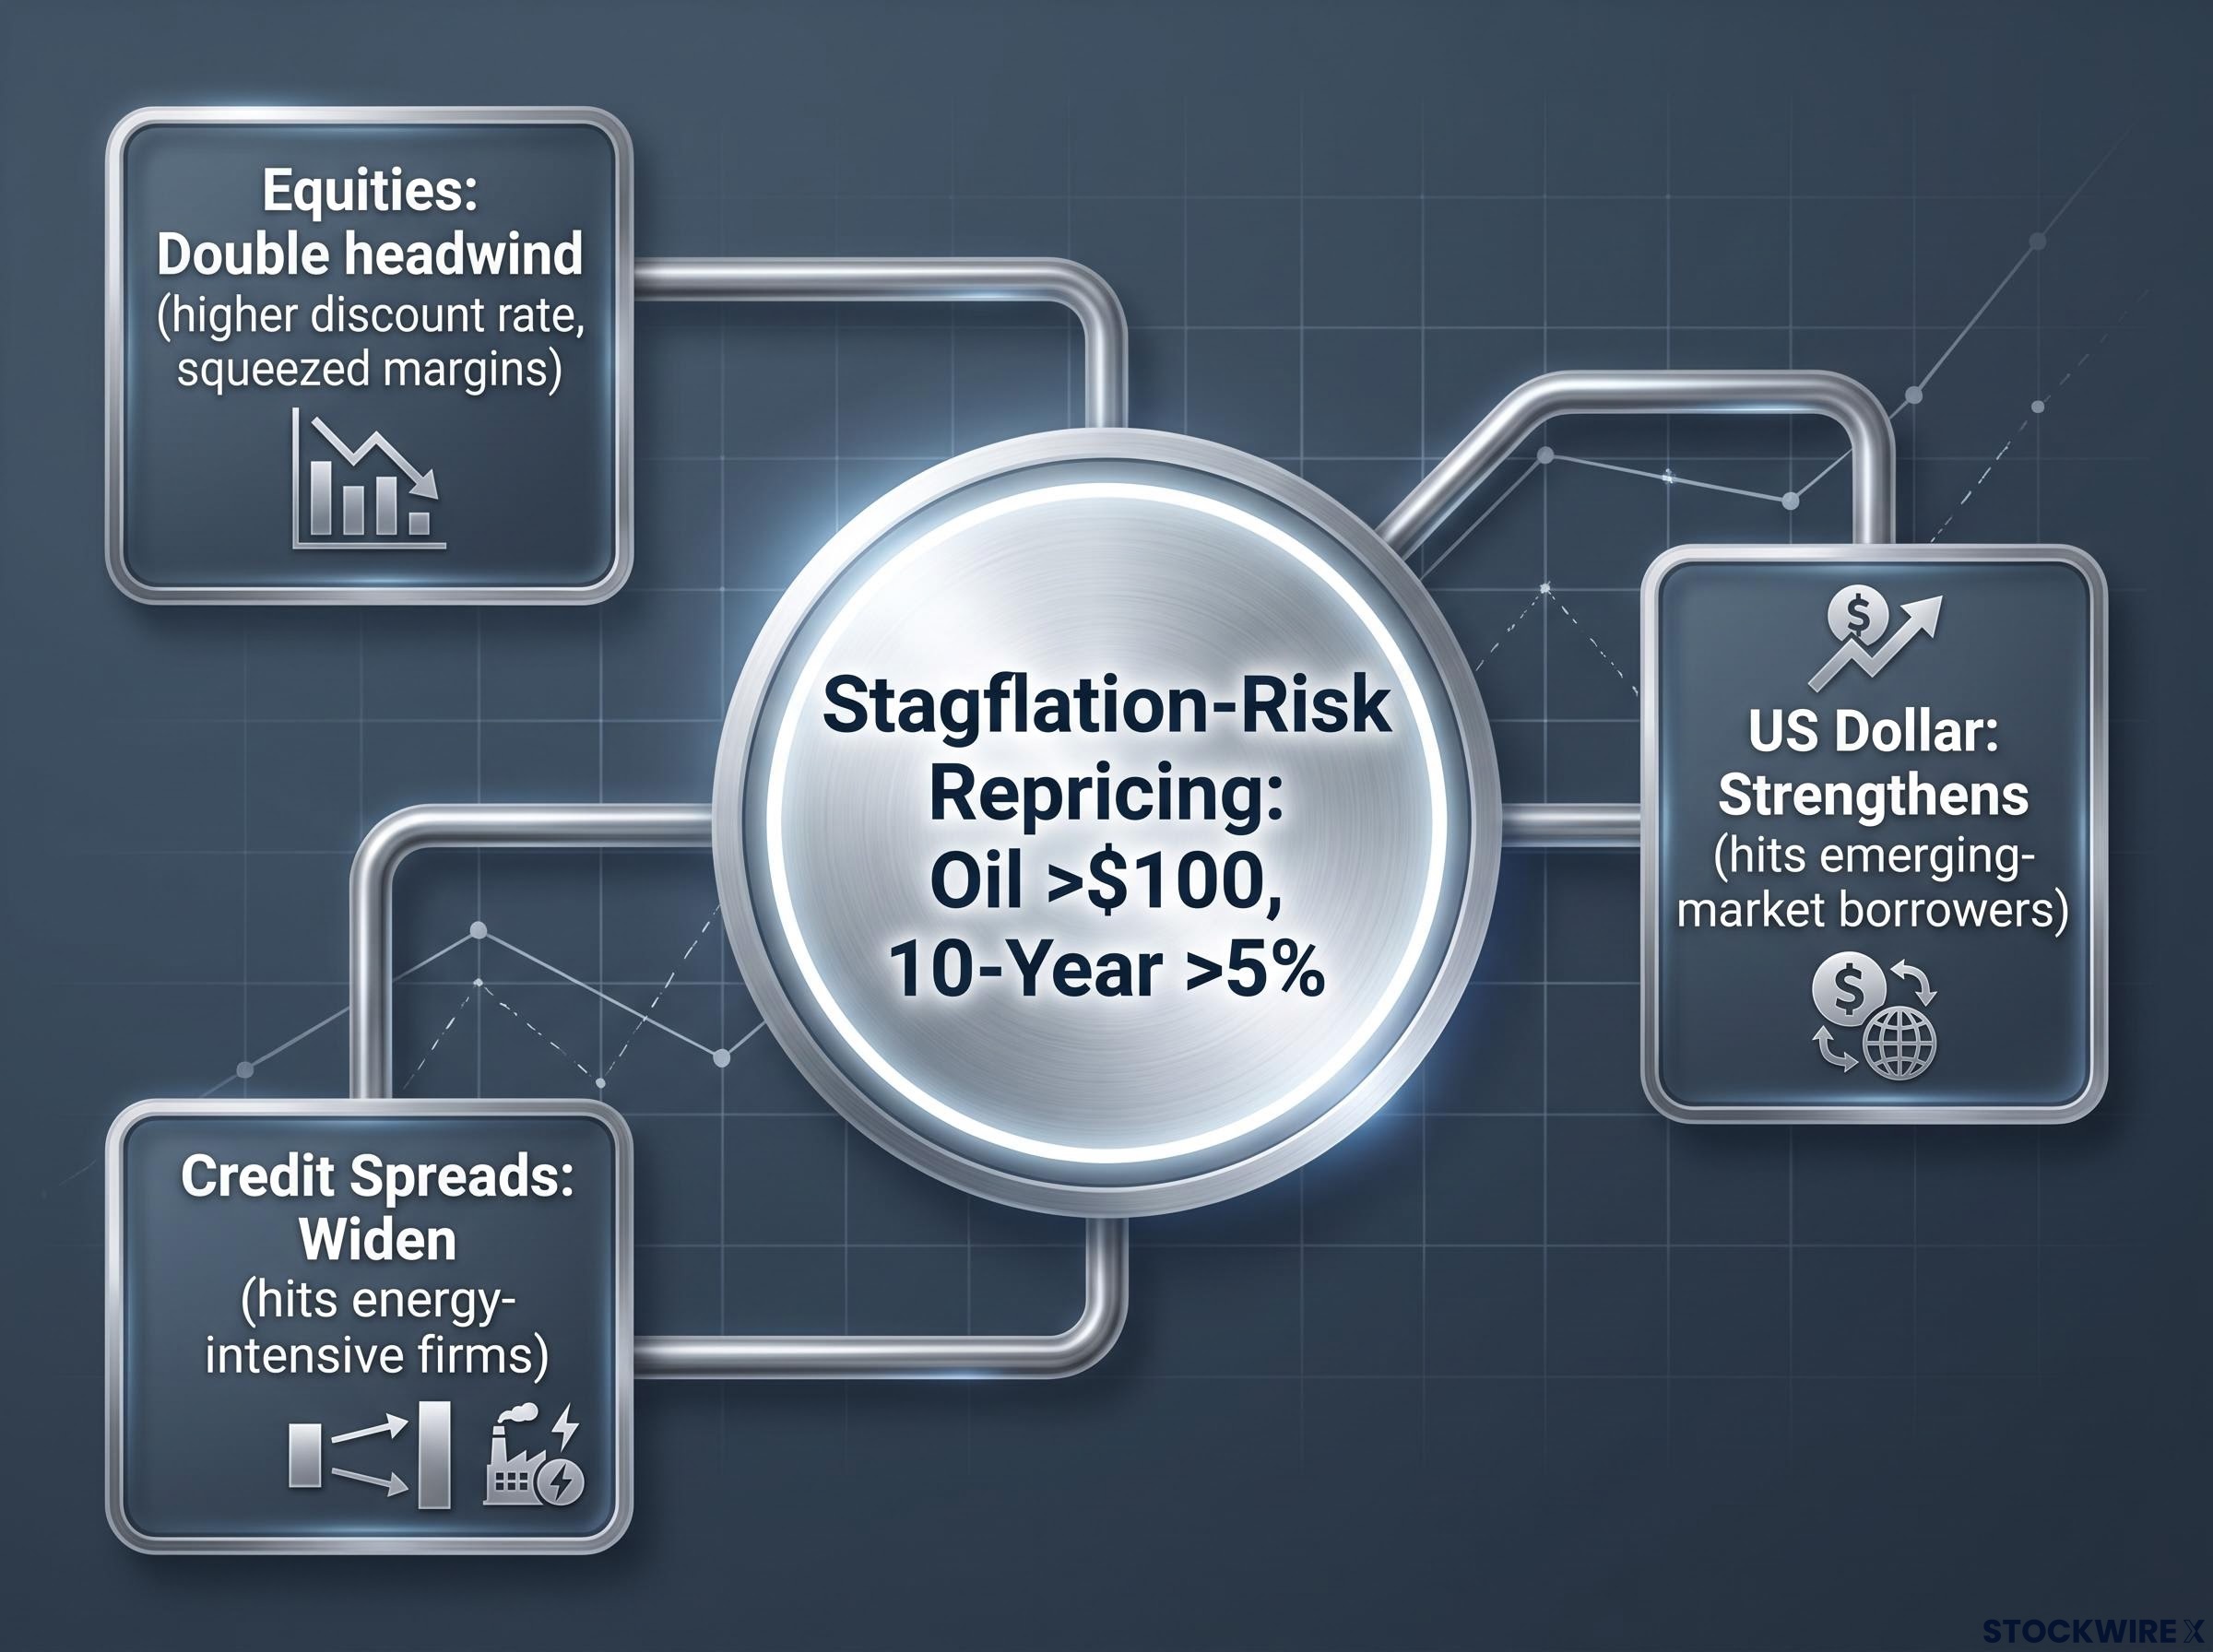
With oil above $100 per barrel and the 10-year above 5%, three effects tend to move together:
- Equities face a double headwind. Higher yields raise the discount rate used to value future earnings, which compresses valuations, while higher energy input costs squeeze margins for firms that cannot pass those costs on. Expensive capital and expensive inputs at the same time is a difficult combination for stocks.
- The US dollar strengthens. Higher US yields relative to other advanced economies pull capital into dollar assets, and Middle East geopolitical risk adds a safe-haven bid on top. A stronger dollar softens imported inflation for the US but tightens conditions for emerging-market borrowers holding dollar debt.
- Credit spreads widen. Investors demand more compensation for default risk in an energy-constrained, slower-growth environment, so the gap between corporate borrowing costs and risk-free yields expands, hitting energy-intensive and demand-sensitive firms hardest.
There is a nuance worth holding onto. The traditional flight to safety, where money floods into Treasuries during a crisis, is partly offset here because the crisis is inflationary. Investors want safety, but they are wary of the very bonds that safety usually lives in.
This is a stagflation-risk repricing: higher yields, a firmer dollar, softer equities, wider spreads. Recognising the pattern tells you which holdings are most exposed to margin compression and which, like dollar-linked assets, might actually benefit.
Navigating a portfolio through the disruption window
The open question is whether this is a passing disruption premium or the start of a structurally tighter energy market. The evidence points both ways, and the distinction should shape how you weight your risk.
The case for temporary rests on precedent. Saudi Aramco has a track record of rapid repairs and flexible export management, and AGBI’s analysis of earlier strikes on Yanbu and Jazan found “no evidence of shipment disruption” in those episodes. On that reading, the 3-5 week repair timeline suggests the premium could compress as physical flows stabilise.
The case for sustained impact rests on the pattern. The IEA framing of multiple simultaneous strike points, and Politico’s warning that significant damage could remove much of the corridor’s volume, both suggest a more fragile system than a single incident implies.
A practical way to weight this: treat the repair timeline as your base case, but recognise that each fresh attack on regional infrastructure raises the odds of the sustained scenario and justifies holding some defensive slack over the coming weeks.
The larger takeaway sits above any single trade. The baseline geopolitical risk premium priced across bonds, equities, currencies, and credit has just been reset higher, and that reset is unlikely to fully reverse even after the pipeline flows again.
For readers wanting to stress-test their portfolios against the full range of macro outcomes this environment could produce, our comprehensive walkthrough of debt scenarios for stocks, bonds, and gold covers the three plausible resolutions, from soft landing to debt monetisation, with MSCI scenario modelling on portfolio impact for each.
This article is for informational purposes only and should not be considered financial advice. Investors should conduct their own research and consult with financial professionals before making investment decisions.
Past performance does not guarantee future results. Financial projections are subject to market conditions and various risk factors, and forward-looking scenarios here are speculative and may change as events develop.