
Crude surged, equities dropped, silver fell roughly 3%, gold slid toward a technical inflection point, and Bitcoin held firm. On the same day. If you assumed that safe-haven assets move in the same direction, this particular session just contradicted you.
That contradiction is not a one-day curiosity. It surfaces a structural question that finance-literate investors increasingly face: when gold and silver are weakening while Bitcoin holds, do you read that as a rotation signal, a temporary dislocation, or a genuine change in how these assets relate to one another? The answer shapes both your entry timing and your portfolio construction.
What follows unpacks why gold, silver, and Bitcoin are moving differently right now, how durable that divergence is likely to be, and what a grounded portfolio response actually looks like. The goal is decision-making clarity, not another cross-asset headline that tells you the metals fell without telling you what to do about it.
Why gold and silver are sliding right now
Start with the mechanics, because the mechanics explain almost everything. Gold and silver pay you nothing to hold them. When real yields (the return on government bonds after inflation) rise, the cost of holding an asset that produces no income goes up with them. That is the primary headwind pressing on both metals at the moment.
The connection between real yields and gold prices runs deeper than the headline rate decision: what actually moves gold is the gap between nominal Treasury yields and inflation expectations, a relationship that held even through the fastest rate-hiking cycle in four decades.
The trigger this time is U.S. inflation data and oil. Reuters reports that gold has repeatedly dropped 1% or more when producer-price index (PPI) prints and rising crude prices lift expectations for further Federal Reserve rate hikes. Higher rate expectations push real yields up, and higher real yields pull gold and silver down. It is a direct chain, not a coincidence.
As of 14 September 2026, spot gold traded around $4,329-$4,340/oz, down roughly 0.47% on the day, according to Kitco and TradingEconomics. That places it well off its recent peak above approximately $4,700, a pullback of around 400 points. Silver fell harder, down approximately 3% on the day.
Here is the distinction that matters for you. Central bank gold buying, which CoinDesk described in January 2026 as an unprecedented source of structural demand, has not vanished. It is simply being overwhelmed for now by speculative outflows and yield-driven repositioning. That tells you the current weakness is a mathematically predictable response to a specific macro condition, not a sign that gold’s core function has broken. Understanding that difference is what separates a panic exit from a disciplined wait.
The IMF guidance on central bank gold reserves, published in June 2026, confirms that institutional accumulation has been driven by valuation gains and strategic reserve diversification, a structural demand dynamic that persists independently of short-term speculative flows or yield-driven repositioning.
Where the technical support levels sit
When analysts say a price is “approaching support,” they mean it is nearing a level where buyers have historically stepped in, which tends to slow or stall a decline. These levels are not guarantees, but they are where the balance of buying and selling has previously shifted.
For gold, the layered zones look like this:
- $4,200: the near-term level where buyers are expected to defend first
- $3,953: a deeper support band per an October 2025 TradingView analysis
- $3,675: a further structural zone below that
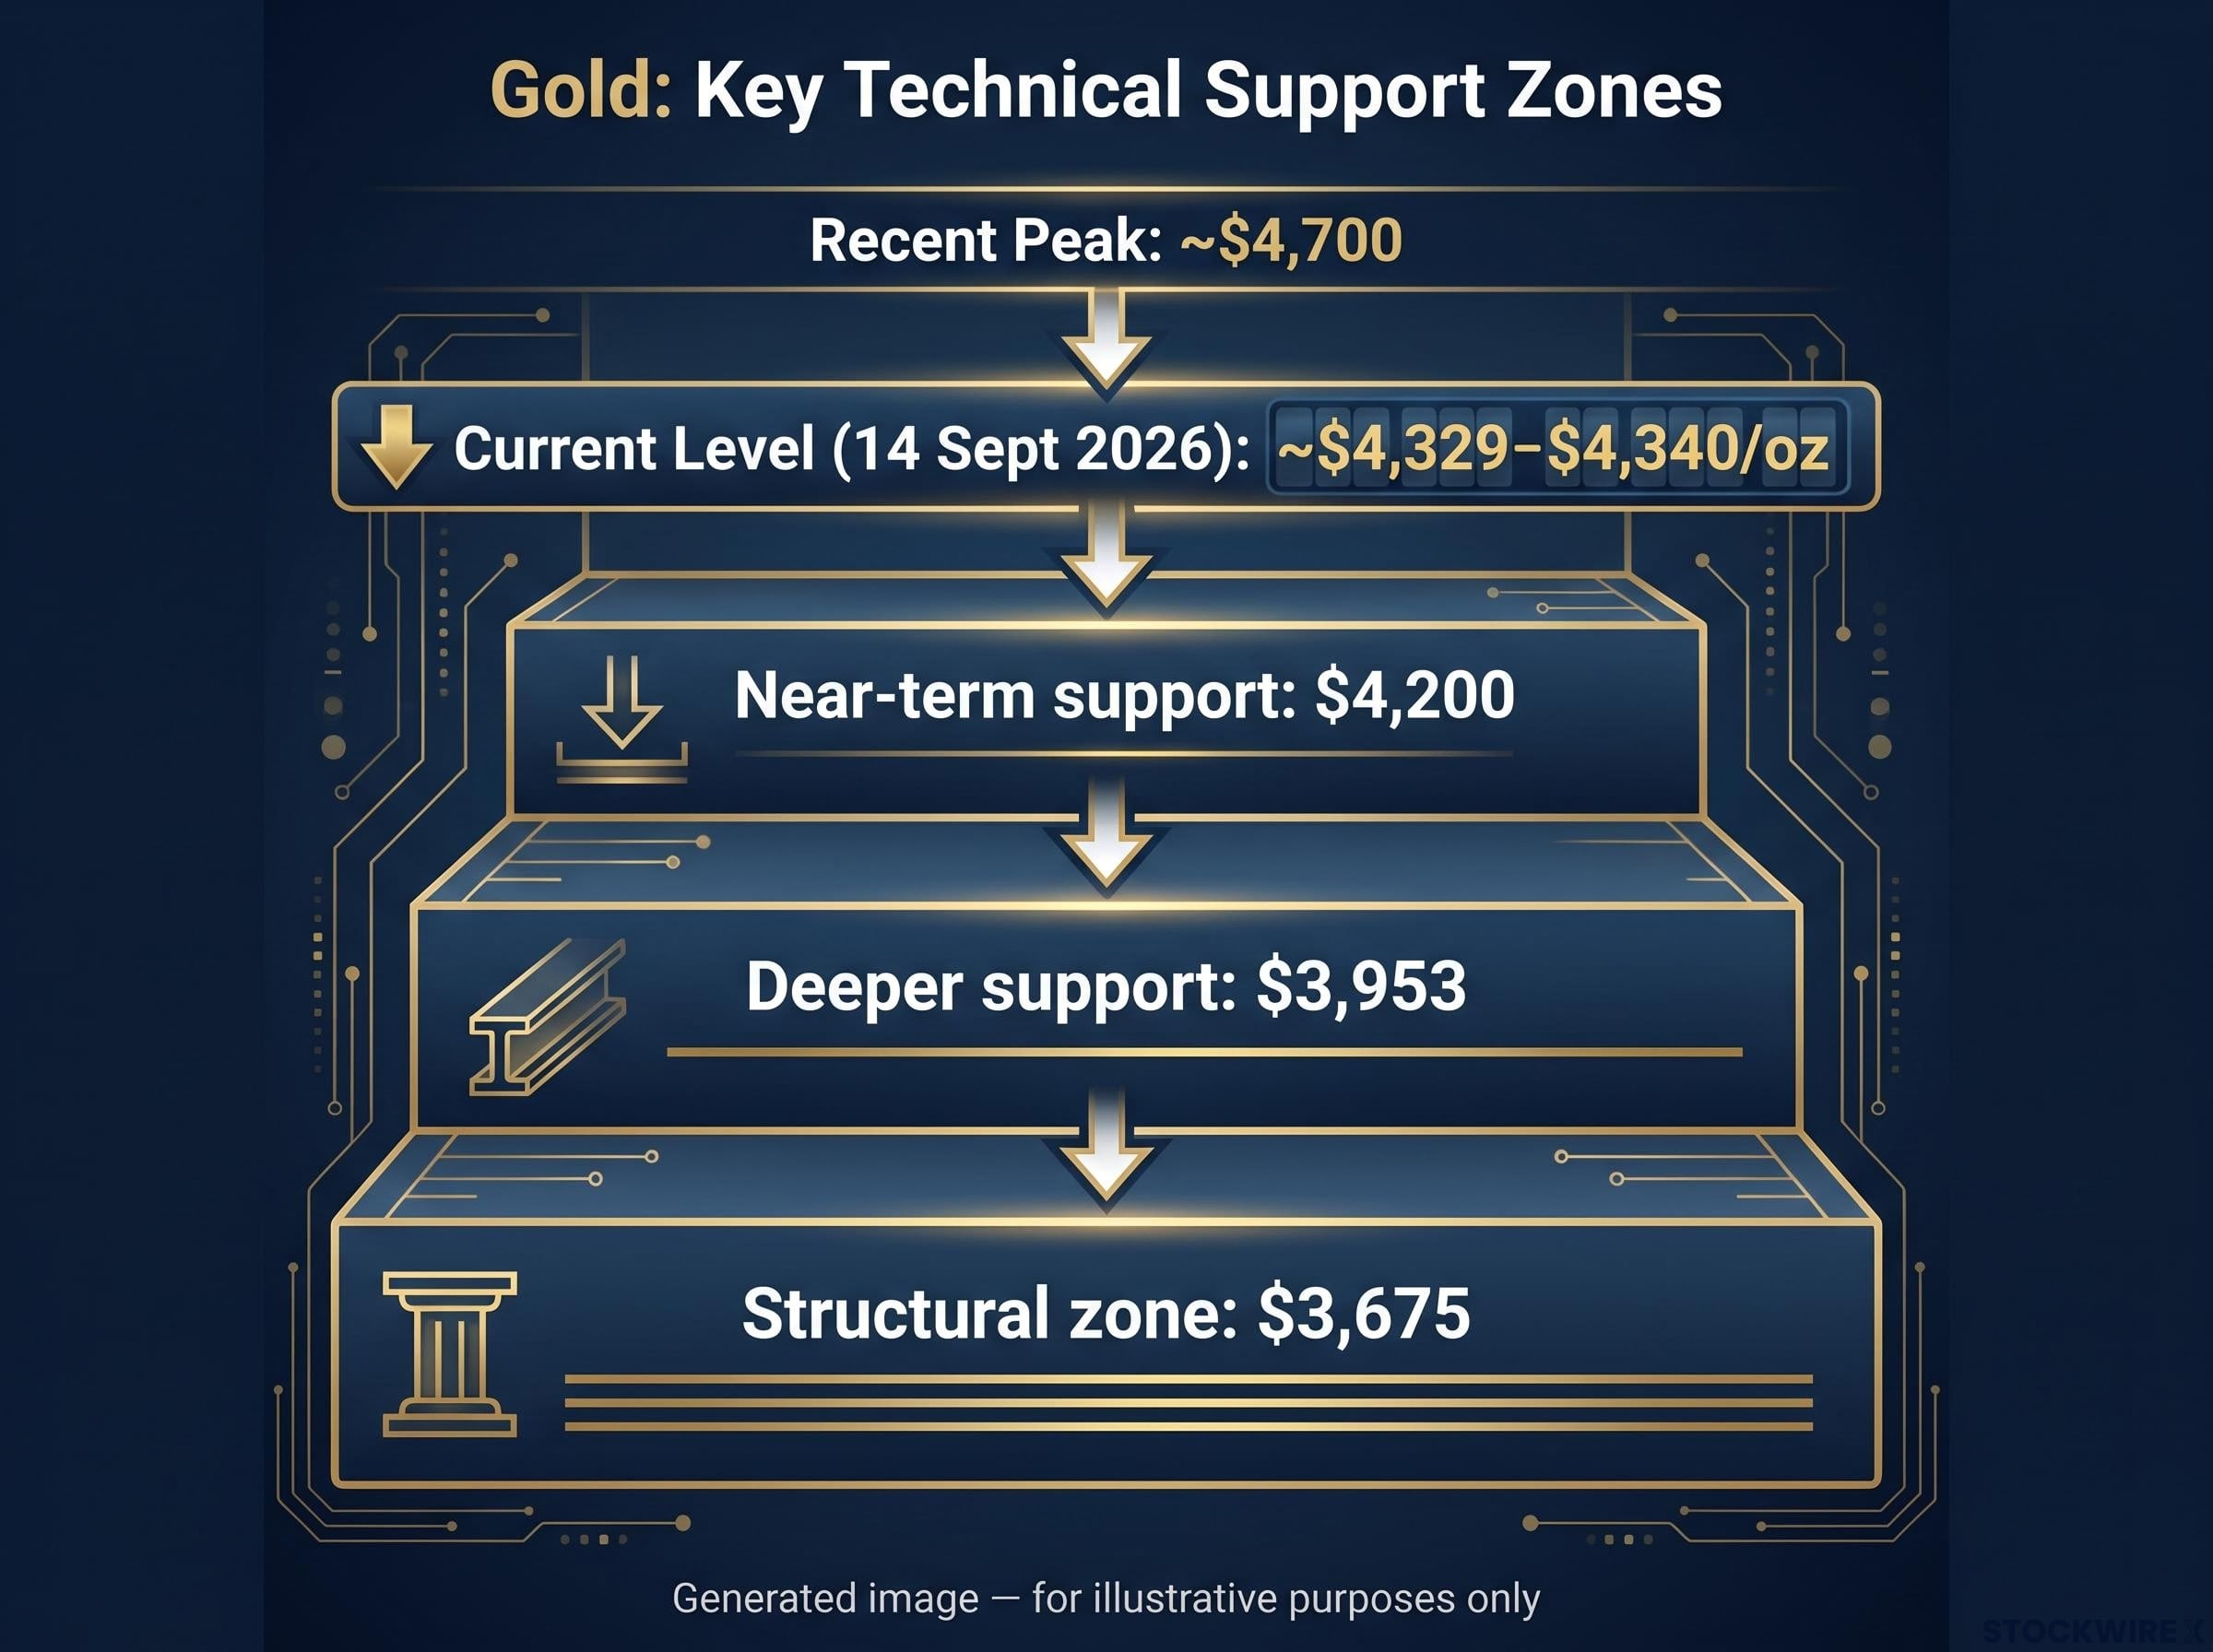
For silver, the original analysis flagged support near the $61 zone, though it is worth noting that widely cited, clearly defined silver support levels are harder to source than gold’s. The practical read: $4,200 on gold and roughly $61 on silver are the levels where the patience thesis either holds or starts to break.
When big ASX news breaks, our subscribers know first
What Bitcoin’s decorrelation actually means (and what it does not)
The signal drawing attention is simple. Everything moved against risk assets, and Bitcoin stayed firm. As of mid-September 2026, Bitcoin traded in the upper $70,000s, around $78,374 on 12 September 2026 per Yahoo Finance, up roughly 30% in recent weeks according to Reuters, and up 23.15% since 7 August 2026.
It is tempting to read that resilience as proof Bitcoin has become the new safe haven. The evidence does not support that reading.
Bitcoin is behaving here exactly as a risk-on, high-beta asset should. MantraMint’s 2026 safe-haven research found that Bitcoin appreciates on inflation-expectation shocks but falls during financial-uncertainty shocks, concluding it functions as a risk-on asset rather than a classical safe haven. EasyEquities data from March 2026 backs this up, citing a roughly 0.72 correlation between Bitcoin and the S&P 500. Bitcoin is not moving defensively. It is moving on different sensitivities.
The 2022 record tested Bitcoin as an inflation hedge more severely than any prior episode, and the result was unambiguous: Bitcoin lost approximately 77% of its value while gold held broadly stable, a contrast that anchors the classification of Bitcoin as a risk-on asset rather than a crisis refuge.
The correlation numbers show just how unstable this relationship is:
Bitcoin’s rolling correlation with gold peaked near 0.289 in October 2025, then plunged to -0.88 by spring 2026, according to Bitsgap.
| Metric | Bitcoin | Gold |
|---|---|---|
| 12-month return (to Aug 2026) | Approx. -22% | Approx. +41% |
| Recent short-term return | Approx. +30% (recent weeks) | Down approx. 0.47% on the day |
| Correlation to S&P 500 | Approx. 0.72 | Weak / inverse |
| BTC-gold 90-day correlation | Approx. 0.5 (second-highest on record) | |
| Typical crisis behaviour | Falls with equities | First-line refuge |
The 90-day correlation reaching approximately 0.5 in late August 2026, per Yahoo Finance, was its second-highest on record. A 60-day figure spiked to roughly 0.636 in early September, according to KuCoin. Yet the long-run correlation between the two remains near zero and has repeatedly snapped back.
That instability is the whole point. The current divergence is a recurring, episodic pattern, not a structural break. Treating it as evidence that Bitcoin has permanently replaced gold’s role in a portfolio exposes you to a reversion that history shows tends to arrive abruptly.
How durable is this kind of divergence? Lessons from past dislocations
The best way to calibrate the current moment is to look at what happened the last few times these two assets came apart. The pattern speaks for itself.
- 2017 bull run: The Bitcoin-to-gold ratio surged to all-time highs as Bitcoin exploded and gold held steady, per a May 2026 NewHedge analysis. Bitcoin then corrected sharply, and gold outperformed through the aftermath.
- March 2020 COVID shock: Both assets fell together in the initial panic. Gold then rallied steadily over the following months while Bitcoin oscillated before eventually launching its major bull run.
- 2025-2026 extreme decorrelation: The correlation ran from near 0.289 in October 2025 to -0.88 by spring 2026, per Bitsgap and corroborated by Spark.money using ARK Invest and CryptoQuant data. The weekly correlation from 2020 to 2026 averaged just 0.14.
KuCoin noted that prior correlation spikes in December 2018, October 2022, and September 2024 were each followed by significant regime shifts. Benzinga observed that some past spikes preceded Bitcoin rallies of 172% and 350%, but with a catch that matters enormously: those rallies only began after Bitcoin had decorrelated from gold again. The spike itself was never the entry signal.
What the pattern implies for the current moment
Put the history against September 2026 and a clear read emerges. Correlation is elevated but not at an extreme, and elevated-but-not-extreme is historically the setup that precedes a regime shift rather than one that confirms one is already underway.
The direction of that shift is not predetermined. If macro conditions tilt toward risk appetite, liquidity, and falling real yields, the shift can favour Bitcoin upside. If renewed stress arrives instead, gold and Bitcoin can reconnect and move together again.
For you, that means the current divergence is a moment for heightened attention and scenario-planning, not a directional trade signal in either asset. The same setup has preceded both dramatic Bitcoin upside and abrupt reversals, depending entirely on which macro variable moved first.
A practical framework for positioning across both assets right now
Cross-asset divergence coverage tends to push you toward an either/or choice: gold or Bitcoin. That framing is the mistake. The more useful question is how much of each, for what purpose, at what level of conviction.
Start with role-based sizing. Coinbureau, EasyEquities, and Stakemygold all frame gold as portfolio ballast, meaning wealth preservation and a risk-off hedge against macro stress. Bitcoin plays a different role entirely: high-volatility convexity, an asymmetric bet on large upside. Because Bitcoin’s annualised volatility runs several multiples of gold’s, and its worst drawdowns have been far deeper, it demands a much smaller position size and stricter risk controls.
Then layer in the crisis lifecycle. AInvest’s research describes gold as the first-line refuge during acute stress, whether geopolitical risk, credit events, or sudden inflation scares. Bitcoin is a recovery asset, historically performing when conditions normalise and risk appetite returns. Knowing which part of that cycle you are in tells you which asset the current environment favours.
For gold entry timing, the S&P 500-to-gold ratio is a useful context gauge. Per an Investing.com analysis from 12 August 2026, the ratio rebounded from roughly 1.27 to about 1.79, a move of around 40%. A high ratio means equities have outrun gold, which puts gold at more attractive relative value. Compare that with early 2026, when TradingKey noted the ratio near 1.3, a period when gold had clearly outperformed stocks.
The S&P 500-to-gold ratio compressing from approximately 1.66 in mid-November 2025 to roughly 1.34 by March 2026 confirmed that gold’s outperformance over equities was a sustained regime rather than a brief deviation, which is why the rebound toward 1.79 by August 2026 matters as a relative-value signal.
| Asset | Portfolio role | Crisis-cycle timing | Key entry signal | Primary risk to watch |
|---|---|---|---|---|
| Gold | Ballast / preservation | First-line refuge in acute stress | High S&P 500-to-gold ratio (approx. 1.79) | Rising real yields, stronger dollar |
| Bitcoin | Convexity / asymmetric upside | Recovery asset as risk returns | Decorrelation resuming after a spike | Leverage unwinds, regulatory shocks |
One caution on sizing. Bitcoin’s drawdown risk from leverage unwinds, regulatory shocks, or equity-driven correlation means it must be small enough to survive a deep correction without impairing the rest of your portfolio. The 12-month context sharpens this: gold returned approximately +41% while Bitcoin returned about -22% over the year to August 2026, per Bybit. On a longer horizon, gold has been the stronger risk-adjusted performer.
Position sizing for volatile assets like Bitcoin requires looking beyond the dollar allocation to the actual risk contribution each position makes to the whole portfolio, since a nominally small Bitcoin weight can represent a disproportionately large share of total portfolio risk given its annualised volatility.
Watch for the conditions that could flip the current divergence:
- Real yields fall, reigniting gold’s upside
- The dollar weakens, supporting both metals
- An equity drawdown deepens, pulling Bitcoin down while gold stabilises
- A regulatory shock hits Bitcoin directly
This article is for informational purposes only and should not be considered financial advice. Investors should conduct their own research and consult with financial professionals before making investment decisions. Past performance does not guarantee future results, and these correlation patterns are subject to change based on market developments.
What the divergence signals and what a grounded response looks like
Pull the threads together and the picture is coherent, even if it is not simple. Gold and silver are under real-yield and dollar pressure at technically significant levels, near $4,200 for gold and around $61 for silver. Bitcoin is showing short-term resilience as a risk-on asset. And the correlation environment tying them together is historically unstable.
None of that resolves into a clean directional call, which is exactly the point. The most actionable response to a cross-asset dislocation is not to pick a winner. It is to audit whether your current positioning reflects the roles you actually want gold and Bitcoin to play.
Three variables will tell you which way this resolves:
- Real yields direction: falling yields relieve pressure on gold; rising yields sustain it
- The S&P 500-to-gold ratio: a high level (around 1.79) points to gold’s improving relative value
- Bitcoin-to-S&P 500 correlation: if it re-tightens, Bitcoin’s independence from equities was temporary
The posture the evidence supports is patient rather than reactive. Treat the current dislocation as a potential relative-value opportunity in precious metals for patient capital, remembering that central bank buying still sits as a structural demand floor beneath the speculative pressure. Hold Bitcoin as speculative convexity sized for its worst-case drawdown. And resist reading episodic decorrelation as a permanent portfolio truth, because the 12-month gap of gold +41% against Bitcoin -22% is the reminder that time horizon changes the whole story.