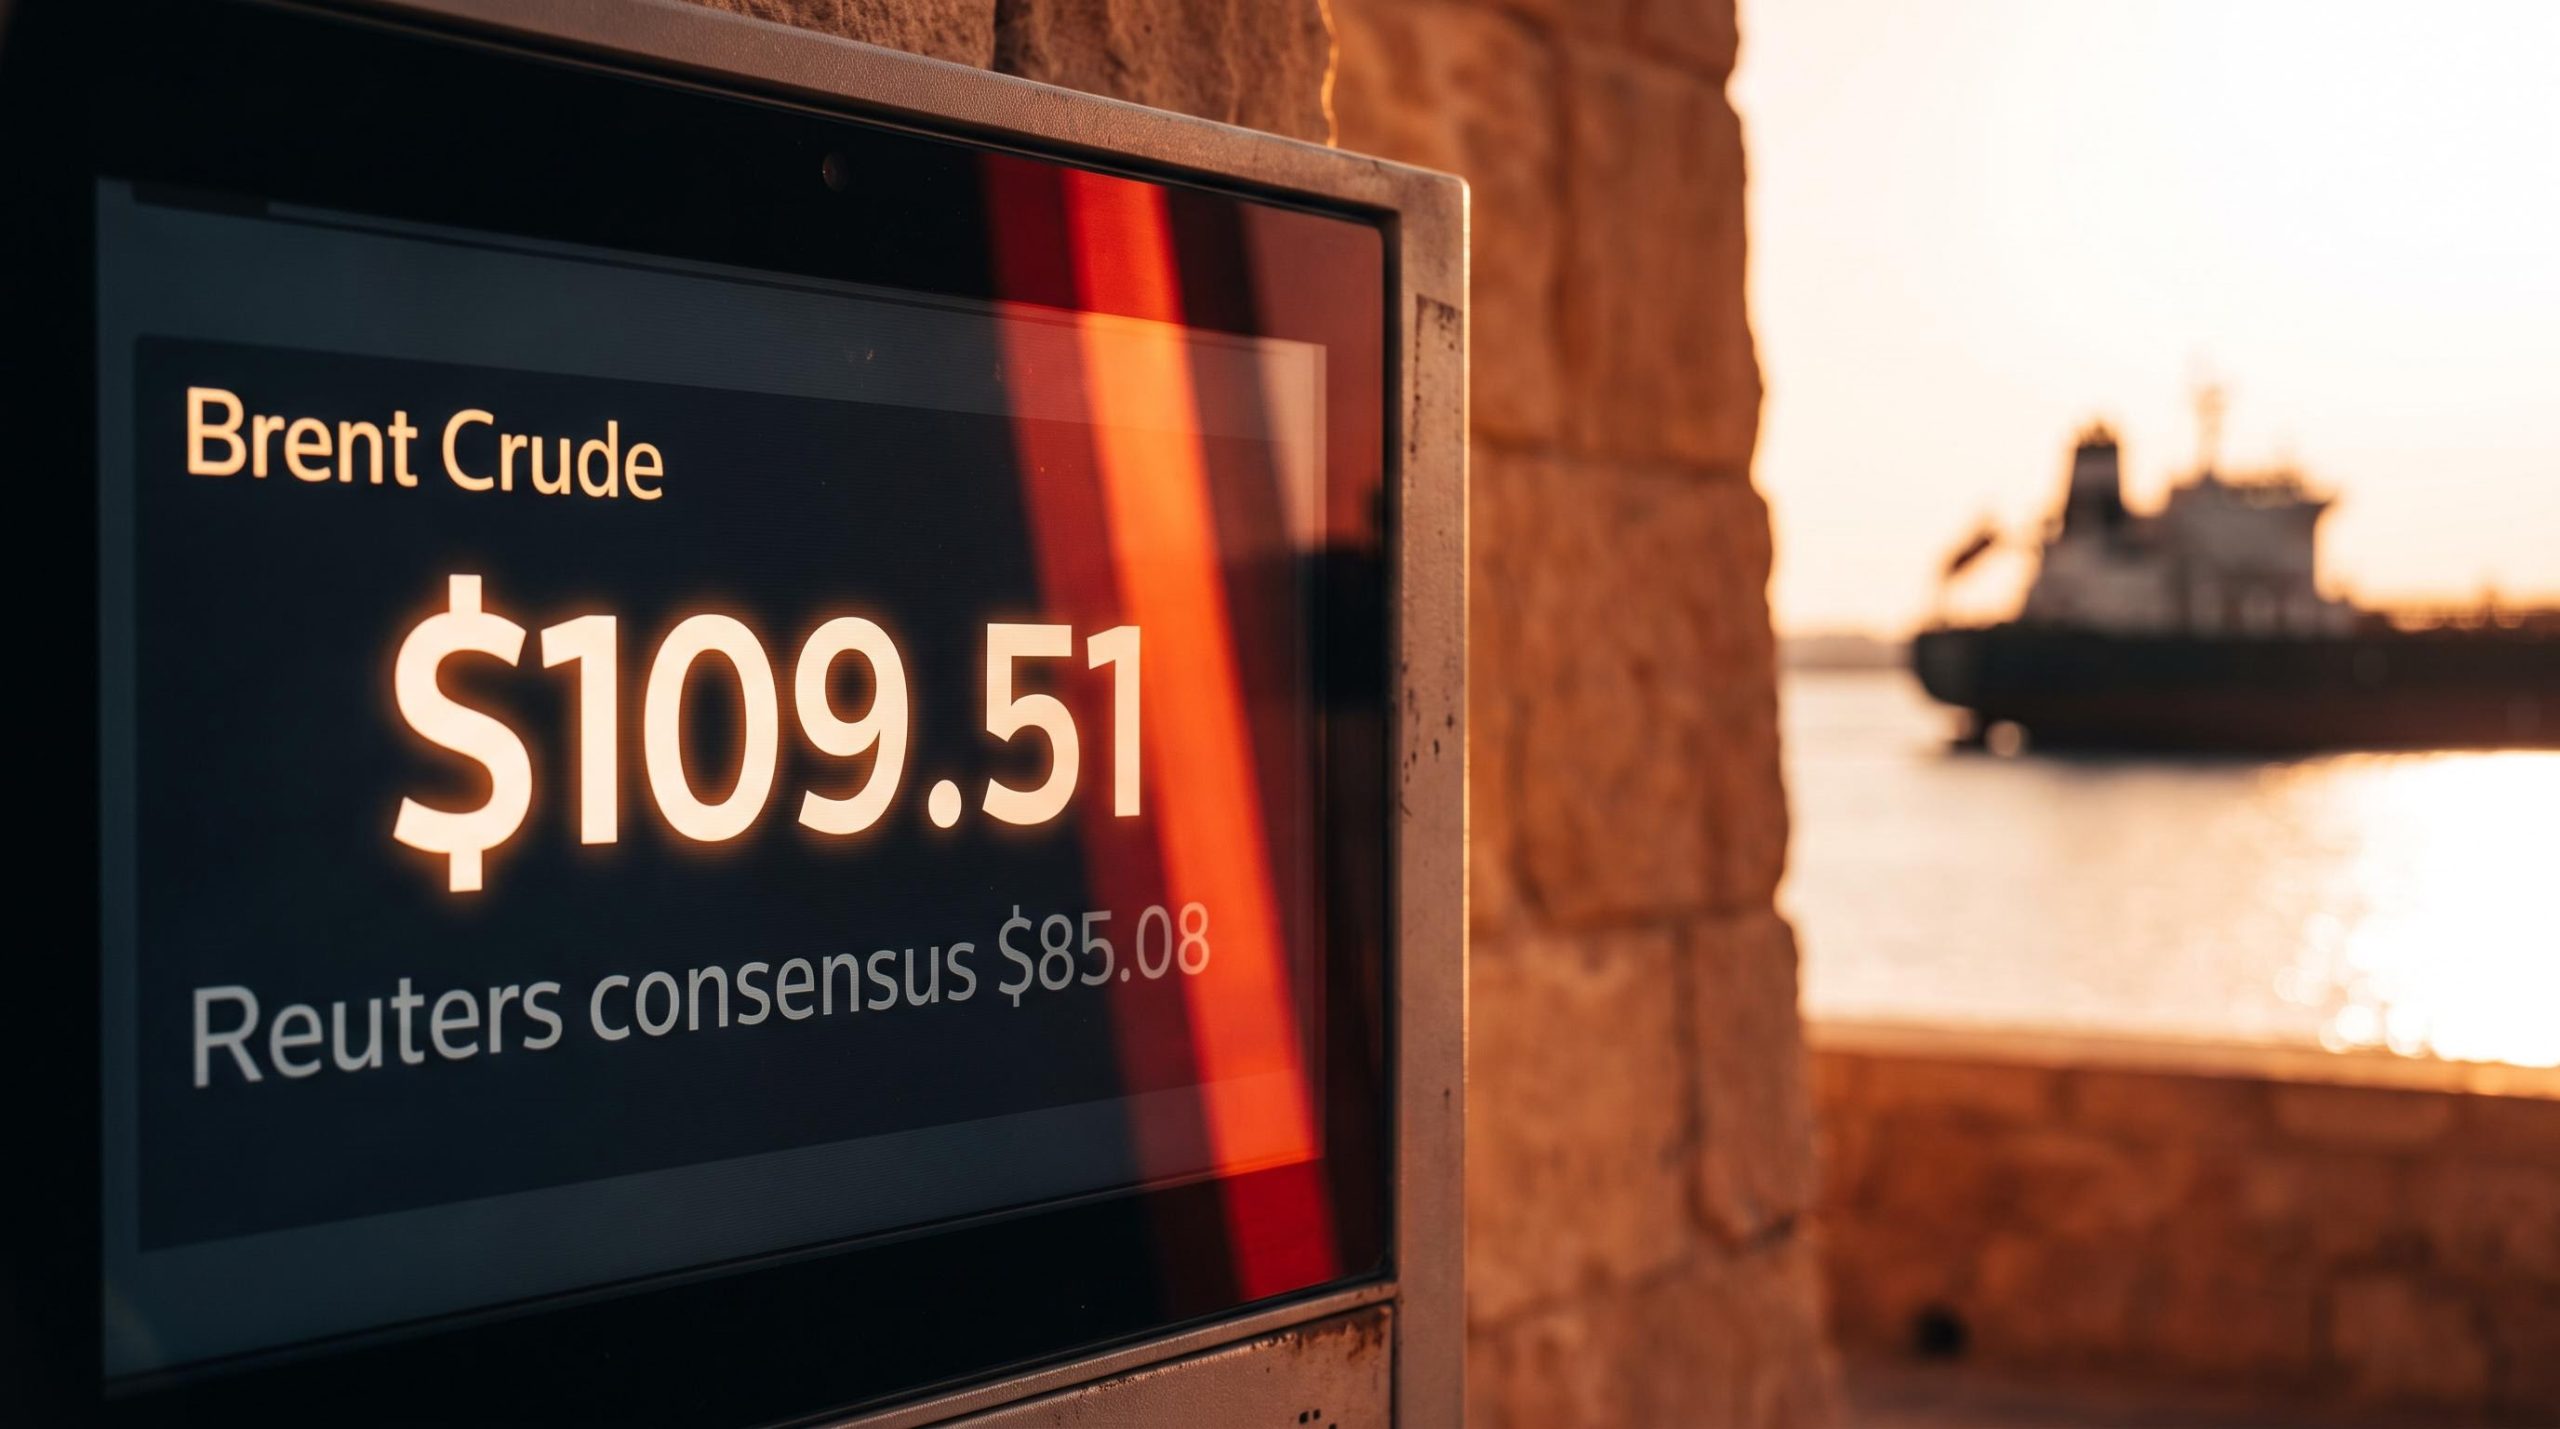
Brent crude sits at $109.51 per barrel and WTI is closing in on $100, yet the fuel behind this rally is not a demand boom or a supply breakthrough. It is the sustained absence of bad news.
That inversion is the story. Markets are not rallying on what has happened. They are rallying on what has not: no ceasefire, no reopening of the Strait of Hormuz, no de-escalation headline that would let traders exhale.
The price structure carries the fingerprints of that dynamic. From the 28 February 2026 shock spike through a near-complete reversal to the breakout above the descending trend line around 1-2 September 2026, crude has traced a four-phase journey shaped less by fundamentals and more by a geopolitical calendar now stretching across seven months of conflict.
The question most readers carry into this topic is simple: is this a war premium that vanishes the moment a peace deal lands, or something with legs regardless of the headlines? Here is what the price structure, the futures curve, and the institutional forecasts actually tell you about where crude goes from here.
How crude oil traced four phases from shock to breakout
The rally did not arrive in a straight line. It moved through four distinct phases, and each one carries its own analytical weight.
- Phase 1, the shock spike: Over roughly five trading sessions from late February 2026, prices exploded higher as military action in the Middle East and the de facto closure of the Strait of Hormuz hit the market.
- Phase 2, the prolonged reversal: Prices then bled steadily lower, bottoming out near early-July lows and erasing almost the entire Phase 1 move.
- Phase 3, uncertain consolidation: A descending trend line held intact through sideways-to-lower action, keeping the technical picture undecided.
- Phase 4, the breakout: Around 1-2 September 2026, prices pushed above that descending trend line and have largely held the gains since.
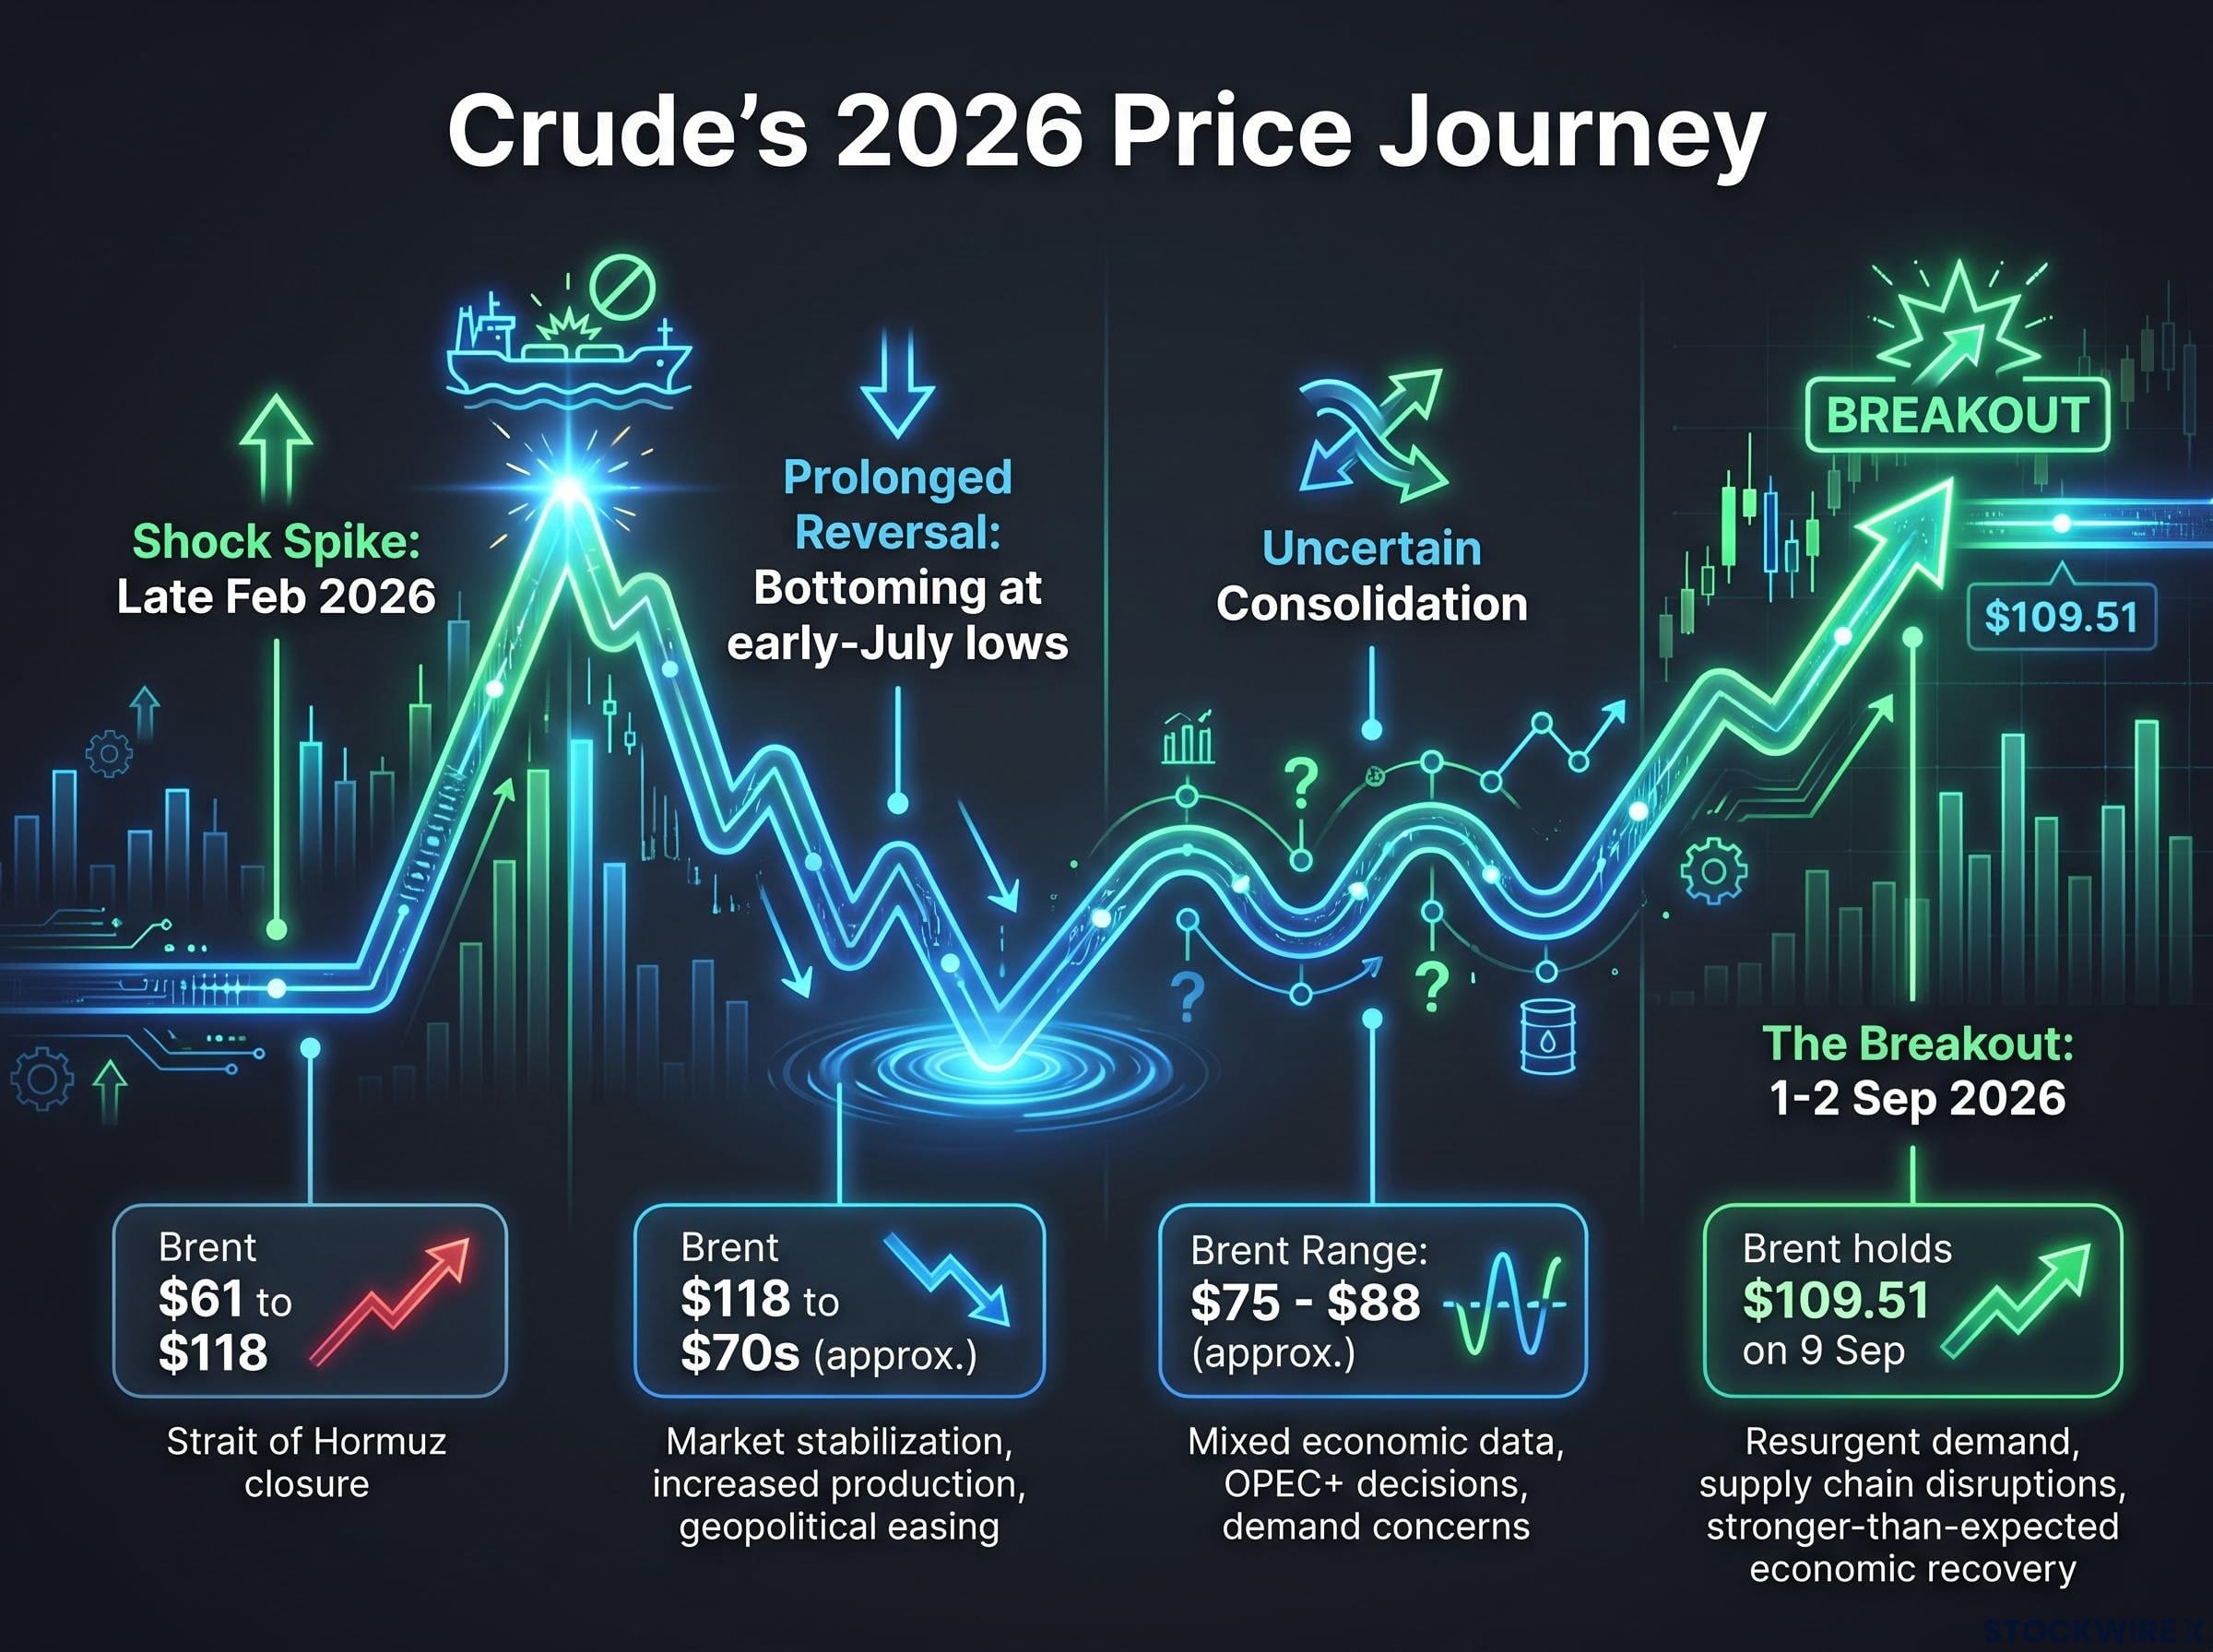
Phase 2 matters more than it looks. The reversal was close to total, deep enough that a reasonable observer could have called the uptrend finished. That near-complete erasure is precisely why Phase 4’s sustained hold above the broken trend line carries genuine significance rather than reading as noise.
Brent front-month futures rose from approximately $61 to $118 during Q1 2026, the largest inflation-adjusted quarterly gain in crude oil since 1988.
The breakout that changed the technical picture
The 1-2 September breach was the pivot. It shifted the technical read from uncertain to directional, and prices have stayed above the broken line for roughly two weeks since.
WTI spot sat between $94.21 and $97.26 per barrel in mid-September, while Brent held at $109.51 as of 9 September 2026, still around 24% below the July 2008 record. That gap to prior peaks is the point. It leaves headroom for new highs if momentum holds.
Here is what the sustained hold tells you. The market is not hunting for a fresh reason to rally higher. It is simply waiting to be given a reason to sell, and so far that reason has not arrived.
When big ASX news breaks, our subscribers know first
What USO and Brent futures are signalling about near-term direction
Look at a screen and the signal is obvious. The United States Oil Fund (USO), the largest crude ETF tracking near-month WTI futures, is trading at roughly $154.62 to $154.90, close to its 52-week high of $158.88 and a world away from its 52-week low of $65.98. Brent futures are deep into triple digits.
But the price alone hides the more useful signal. USO’s strength reflects two forces working together: spot gains, plus positive roll yield from a futures curve in backwardation. Understanding the second one is what separates watching the price from reading the market.
Backwardation means front-month contracts trade at a premium to later-dated ones. When that happens, USO’s monthly roll works in the holder’s favour: the fund sells the expiring, higher-priced contract and buys a cheaper one further out, capturing extra return beyond any move in spot.
An illustrative example makes the mechanics concrete. With the October WTI contract at $91.30 and November at $88.27, the fund can buy roughly 3.4% more contracts on each roll, a gain that compounds over successive months. (Treat these figures as illustrative rather than independently confirmed.)
| Instrument | Current Level | 52-Week High | 52-Week Low | Curve Position |
|---|---|---|---|---|
| USO (near-month WTI ETF) | $154.62-$154.90 | $158.88 | $65.98 | Backwardation |
| Brent futures | Approaching post-conflict highs (intraday print $97.31 on 7 Sep) | Post-conflict high | Not applicable | Backwardation |
The curve shape is not just a technicality. Backwardation in 2026 reflects the market pricing tight near-term supply from the Hormuz closure and OPEC+ production discipline, not any long-run demand optimism. The $97.31 Brent intraday print on 7 September 2026, a six-week high driven by Iran escalation threats, was a front-month futures reading, exactly the part of the curve that carries the war premium.
When a curve in backwardation eventually flattens or flips toward contango, it signals that supply pressure is easing before spot prices necessarily reflect it. For anyone holding oil through ETFs or futures, that flip is an early exit signal the spot price will not give you.
That is why the curve is more actionable than the headline number. It is the difference between a position that earns roll yield every month and one that quietly bleeds it.
Why geopolitics, not fundamentals, is running this market
Return to the defining feature of Phase 4: price is being held up by the absence of negative developments, not the arrival of positive demand data. That is the analytical core of this rally. Investors are pricing the longevity of the conflict itself, not a growth story.
Beneath that dynamic sit two structural layers. The first is the Iran-driven closure of the Strait of Hormuz, a de facto restriction in place since 28 February 2026 that removed a meaningful slice of supply and produced Brent’s move from roughly $61 to $118 in Q1 2026, the largest inflation-adjusted quarterly gain since 1988.
The Hormuz closure has stranded an estimated 10-14 million barrels per day of Gulf crude against OPEC spare capacity of only roughly 0.5 million barrels per day, a structural mismatch that makes market self-correction through alternative supply impossible at current scale.
The second layer runs through Russia. Citi strategists framed the asymmetry plainly, and it is worth sitting with.
Geopolitical tensions and tighter sanctions can keep prices supported near term, but peace deals may ultimately push crude lower, meaning the rally is contingent on ongoing conflict.
Read that carefully, because it inverts the usual logic. Bad news sustains the price. Good news ends the rally. The single biggest downside risk here is not a weak inventory report; it is a diplomatic breakthrough.
Russia’s contribution to the elevated price floor
S&P Global characterises the Russia-Ukraine conflict not as a temporary supply disruption but as a structural regime shift. Its February 2026 analysis describes the pivot away from Russian pipeline gas as a lasting rupture rather than a passing adjustment, one expected to endure even if the fighting stops.
The near-term pressure is acute. According to a Fortune report from 5 September 2026, Ukrainian drone strikes have left 40% of Russia’s refining capacity offline, and Russia extended its diesel export halt through September, tightening global middle-distillate supply.
The knock-on effects reach well beyond crude:
- Diesel and middle-distillate supply tightening on the Russian export ban
- EU nitrogen fertiliser prices running 71% above the 2024 average by April 2026
- Rising food-production costs feeding a secondary inflation channel
Even if hostilities ease, the structural reconfiguration of gas flows and restrictions on Russian fertiliser trade will keep energy prices higher and more volatile. This is the elevated floor against which the Hormuz shock now stacks.
For any investor with oil exposure, the implication is specific. The exit signal for this rally will most likely arrive as diplomatic news, not an economic data release, which makes geopolitical headlines more analytically relevant right now than inventory draws or rig counts.
What the institutional forecasts actually agree on (and where they diverge sharply)
The forecasts look chaotic at first glance. They are not confusion. They are a map of the variables that matter, split cleanly into two camps.
The bearish camp, led by the U.S. Energy Information Administration (EIA), rests on non-OPEC supply growth eroding the war premium. Its February 2026 forecast put Brent at just $58 in 2026 and $53 in 2027. The war-scenario camp, anchored by the World Bank, prices in the opposite: a baseline of $86 for 2026 rising to $115 under a severe escalation.
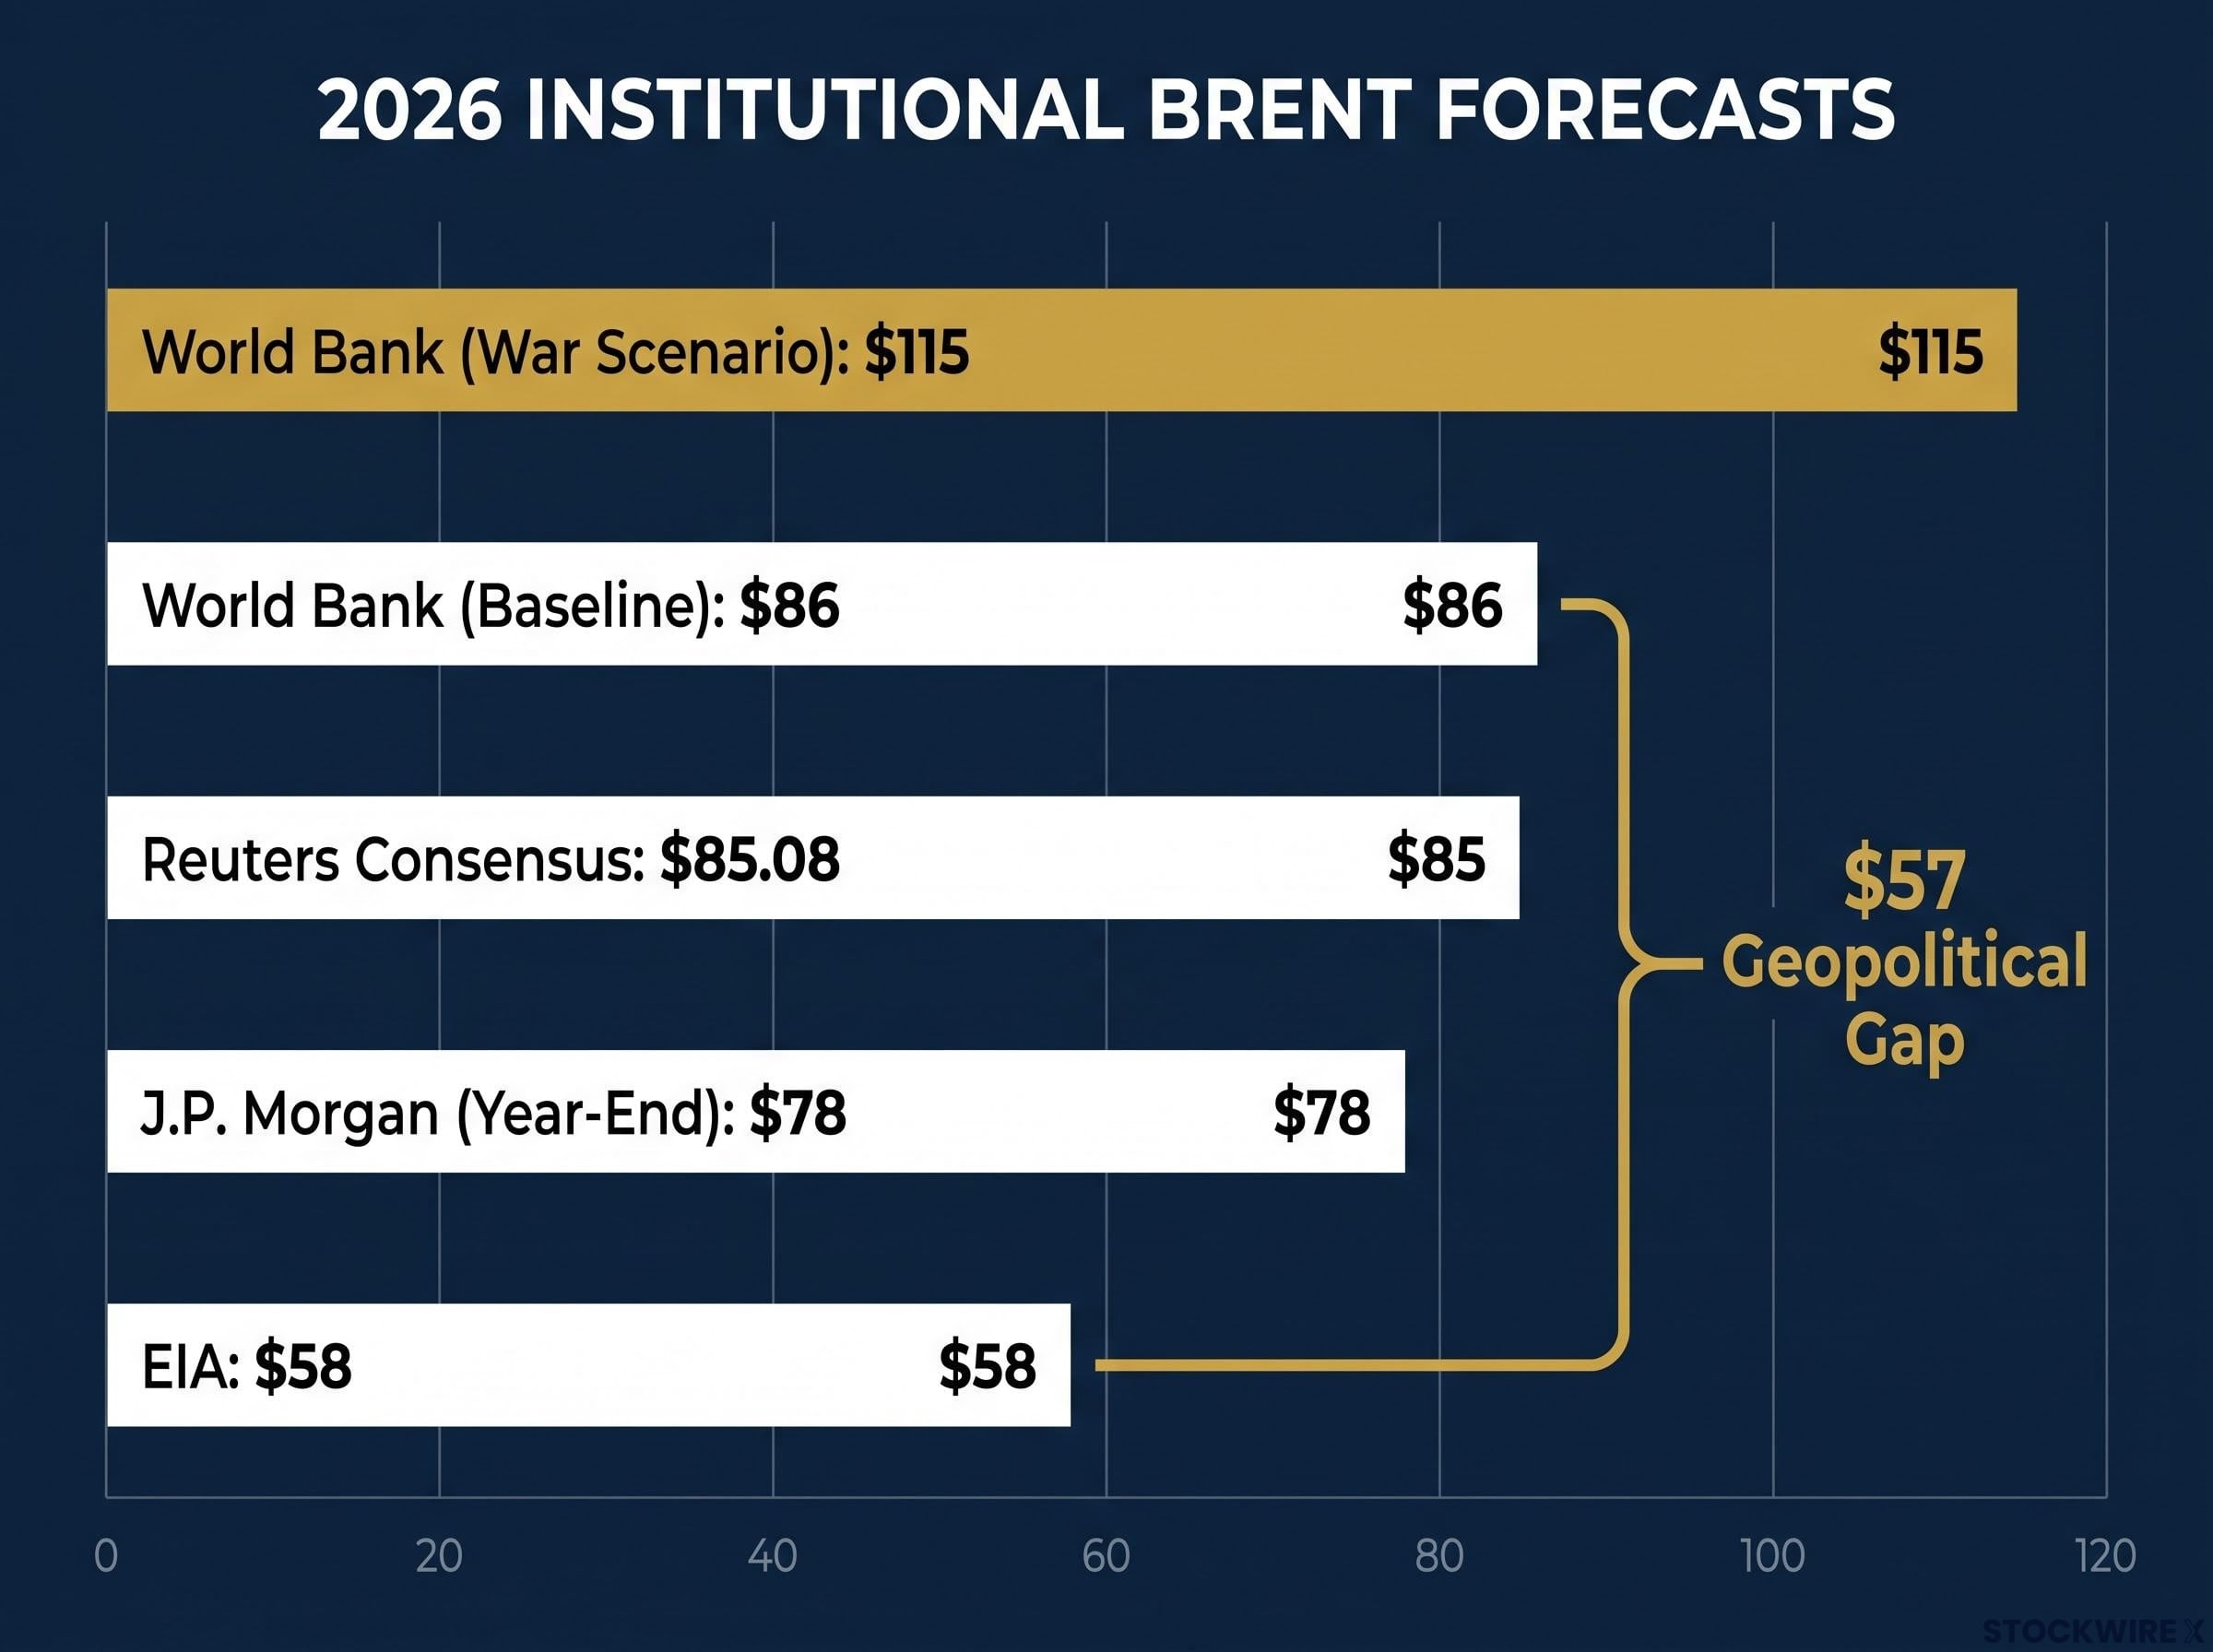
| Institution | 2026 Brent Forecast | WTI / Detail | Date | Key Assumption |
|---|---|---|---|---|
| World Bank (baseline) | $86 | Energy up 24% in 2026 | April 2026 | Contained conflict, elevated floor |
| World Bank (war scenario) | $115 | Severe escalation | April 2026 | Prolonged Hormuz disruption |
| EIA | $58 (2027: $53) | Bearish | February 2026 | Non-OPEC supply growth |
| Goldman Sachs | $80 (Q4); 2027 avg $75 | Cut from $90 | Mid-June 2026 | Hormuz reopening cut supply risk |
| J.P. Morgan | $86 (Q3), $80 (Q4), $78 year-end | Demand losses | July 2026 | China demand destruction |
| Reuters poll consensus | $85.08 | WTI $80.20 | 31 August 2026 | Shipping risk vs weak China |
Consensus breaks down on three variables, and these are the ones worth monitoring:
Brent could ease toward the low $80s per barrel by year-end if genuine normalisation of flows occurs, but current transit data showing only 14 commercial vessels completing the crossing in a 24-hour window, against a pre-war baseline of 120-140 per day, suggests that moment remains distant.
- The pace at which the Strait of Hormuz reopens
- China’s demand trajectory
- Non-OPEC supply growth through 2026 and 2027
The China variable is doing heavy lifting on the bearish side. J.P. Morgan’s July research estimated China’s gasoline demand destruction at roughly 180 kb/d, with about 70% of that loss unlikely to return even after markets normalise. That is a structural erosion, not a cyclical dip.
A Reuters poll on 22 July 2026 had eight analysts projecting an average 1.5 mb/d global deficit in 2026, but expecting the market to tip into oversupply in 2027.
Here is the read the dispersion actually supports. The convergence of Goldman, J.P. Morgan, and the Reuters consensus around $78-$86 for 2026 suggests the market has already priced a sustained war premium. What the forecasts are really arguing about is whether that premium survives into 2027, and on that question the data skews bearish. The $57 gap between the EIA’s 2026 number and the World Bank’s war ceiling is not noise. It is the width of the geopolitical outcome range you are underwriting at current prices.
What the current price structure tells you before making a call
Pull the threads together and a decision framework emerges, not a price target. Three signals are worth monitoring above all others:
- The geopolitical signal: conflict duration and escalation risk, since a diplomatic headline is the most likely trigger for a reversal.
- The futures curve shape: the depth of backwardation as a live proxy for supply tightness, with any flip toward contango serving as an early warning.
- The demand-side counterweight: China structural demand loss, accelerating EV adoption, and IEA monthly data pointing toward potential 2027 oversupply.
One point deserves emphasis. No institutional forecast published before September 2026 anticipated both the sustained Hormuz closure and the full magnitude of China’s demand destruction at the same time. If you monitor the right signals in a live market, you are working with information advantages the published forecasts do not have.
The asymmetry embedded in current pricing
The uncomfortable part is the asymmetry. At $109.51, spot Brent already sits above the Reuters consensus of $85.08 for full-year 2026 and inside, though not at the top of, the World Bank’s $115 war-scenario band.
Strategic petroleum reserve replenishment creates a structural price floor by generating government-mandated buy demand at lower price levels, limiting how far crude can fall even as Hormuz flows gradually normalise and the conflict premium compresses.
That tells you something specific about your position. You are not buying this rally early. You are deciding whether a conflict-contingent premium that is already largely priced can extend further, which is a narrower and more demanding risk question.
Current prices treat the continuation of conflict as the base case, not as a tail risk. The tail risk sits on the other side: a ceasefire or de-escalation. And because the technical structure has no established support below the September trend line breakout, there is no map for how far prices could fall on a peace headline.
USO’s proximity to its $158.88 ceiling, against a current $154-$155 range, frames the near-term upside as limited and the downside as undefined. That is the trade in one sentence.
For investors wanting to build a repeatable framework around the signals discussed here, our dedicated guide to reading oil markets with EIA data covers the five-step Wednesday routine for tracking inventory surprises, technical levels, and momentum indicators across a live WTI price structure.
This article is for informational purposes only and should not be considered financial advice. Investors should conduct their own research and consult with financial professionals before making investment decisions.
Past performance does not guarantee future results. Financial projections are subject to market conditions and various risk factors, and the forecasts cited here are speculative and subject to change based on geopolitical and market developments.