
When the S&P 500 slipped below the 7,600 area in recent sessions, the selling did something most investors would not expect: instead of slowing as the index found buyers, it sped up. That acceleration into weakness is a warning sign, and it usually has less to do with fear than with plumbing.
Most people read a sell-off as fundamental deterioration or a wave of macro anxiety. What far fewer track is what the options market is doing underneath the price, and right now that structure is not neutral. The index is trading near 7,600, roughly 297 points below its zero-gamma flip level of approximately 7,887, which places dealer hedging in a regime that amplifies moves rather than cushions them.
After reading this, you will be able to look at a market decline and judge whether options market structure is likely to accelerate it or absorb it. You will also understand why professional traders are leaning on defined-risk structures right now instead of placing simple directional bets, and why that choice is mechanical, not timid.
What gamma actually does to dealer behaviour
Here is the counterintuitive part. The firms that sell you options are frequently forced to trade against their own positions, and when the market is falling, that forced trading can push prices down faster.
Options dealers, the market makers who sit on the other side of retail and institutional trades, do not want directional exposure. When they sell you a put or a call, they hedge the resulting risk by trading the underlying index or futures. The size and direction of that hedging is where gamma comes in.
Gamma is the rate at which a dealer’s directional exposure (their delta) changes as the price of the underlying moves. It sounds abstract, but it decides whether dealer hedging calms the market or destabilises it. The sign of that gamma, positive or negative, flips the entire behaviour.
The mechanics become more dangerous as expiration nears, because delta polarises near expiration, compressing toward zero for out-of-the-money strikes and toward one for deep in-the-money ones, which is why a gamma squeeze can arrive with almost no warning in the final sessions before a major options expiry.
- Positive gamma: dealers buy dips and sell rallies. Their hedging is mean-reverting, it dampens price moves, and it compresses intraday ranges.
- Negative gamma: dealers sell into weakness and buy into strength. Their hedging is trend-amplifying, it widens price moves, and it stretches intraday ranges.
When dealers sit in negative gamma, they are forced to trade pro-cyclically to stay delta-neutral. Prices fall, their position bleeds directional exposure, and they have to sell more to rebalance. That selling pushes prices lower still. It is a loop, and it runs on mechanics, not sentiment.
How liquidity evaporates when dealers flip short
The amplification gets worse when liquidity thins out at the same time. A February 2026 note from Goldman Sachs observed top-of-book S&P 500 liquidity collapse to $4.1 million from a year-to-date average of $13.7 million as dealers shifted to flat or short gamma.
That figure is not just a statistic. It means a sell order that would normally nudge the market a few ticks can now move it several points, because there is far less resting size to absorb it. When you see a decline running faster than the news seems to justify, this is often why. The move is structural, and understanding that changes how you read the velocity and how you position around it.
When big ASX news breaks, our subscribers know first
Where the S&P 500 stands in the gamma map right now
Think of the gamma map as exactly that, a map. Before drawing conclusions about risk, it helps to read the positional story the numbers are telling.
The S&P 500 is trading near 7,600, sitting below its zero-gamma flip level. That flip is the price at which the aggregate dealer book crosses from net long gamma (stabilising) to net short gamma (destabilising). Below it, hedging amplifies. Above it, hedging cushions.
The dashboards do not agree on a single number, and that matters. A 10 September snapshot from GEXMetrix placed spot near 7,589 with the zero-gamma level at 7,887, roughly 297 points below the flip. A Moomoo pre-market reading on 8 September put spot at 7,718.60 with net dealer gamma at -2.31B and the flip boundary at 7,683.50.
| Data source | Spot level | Zero-gamma flip level |
|---|---|---|
| GEXMetrix (10 September) | ~7,589 | 7,887 |
| Moomoo (8 September, pre-market) | 7,718.60 | 7,683.50 |
The methodologies differ, so the precise flip level shifts from model to model. That is not a flaw you should use to dismiss the framework.
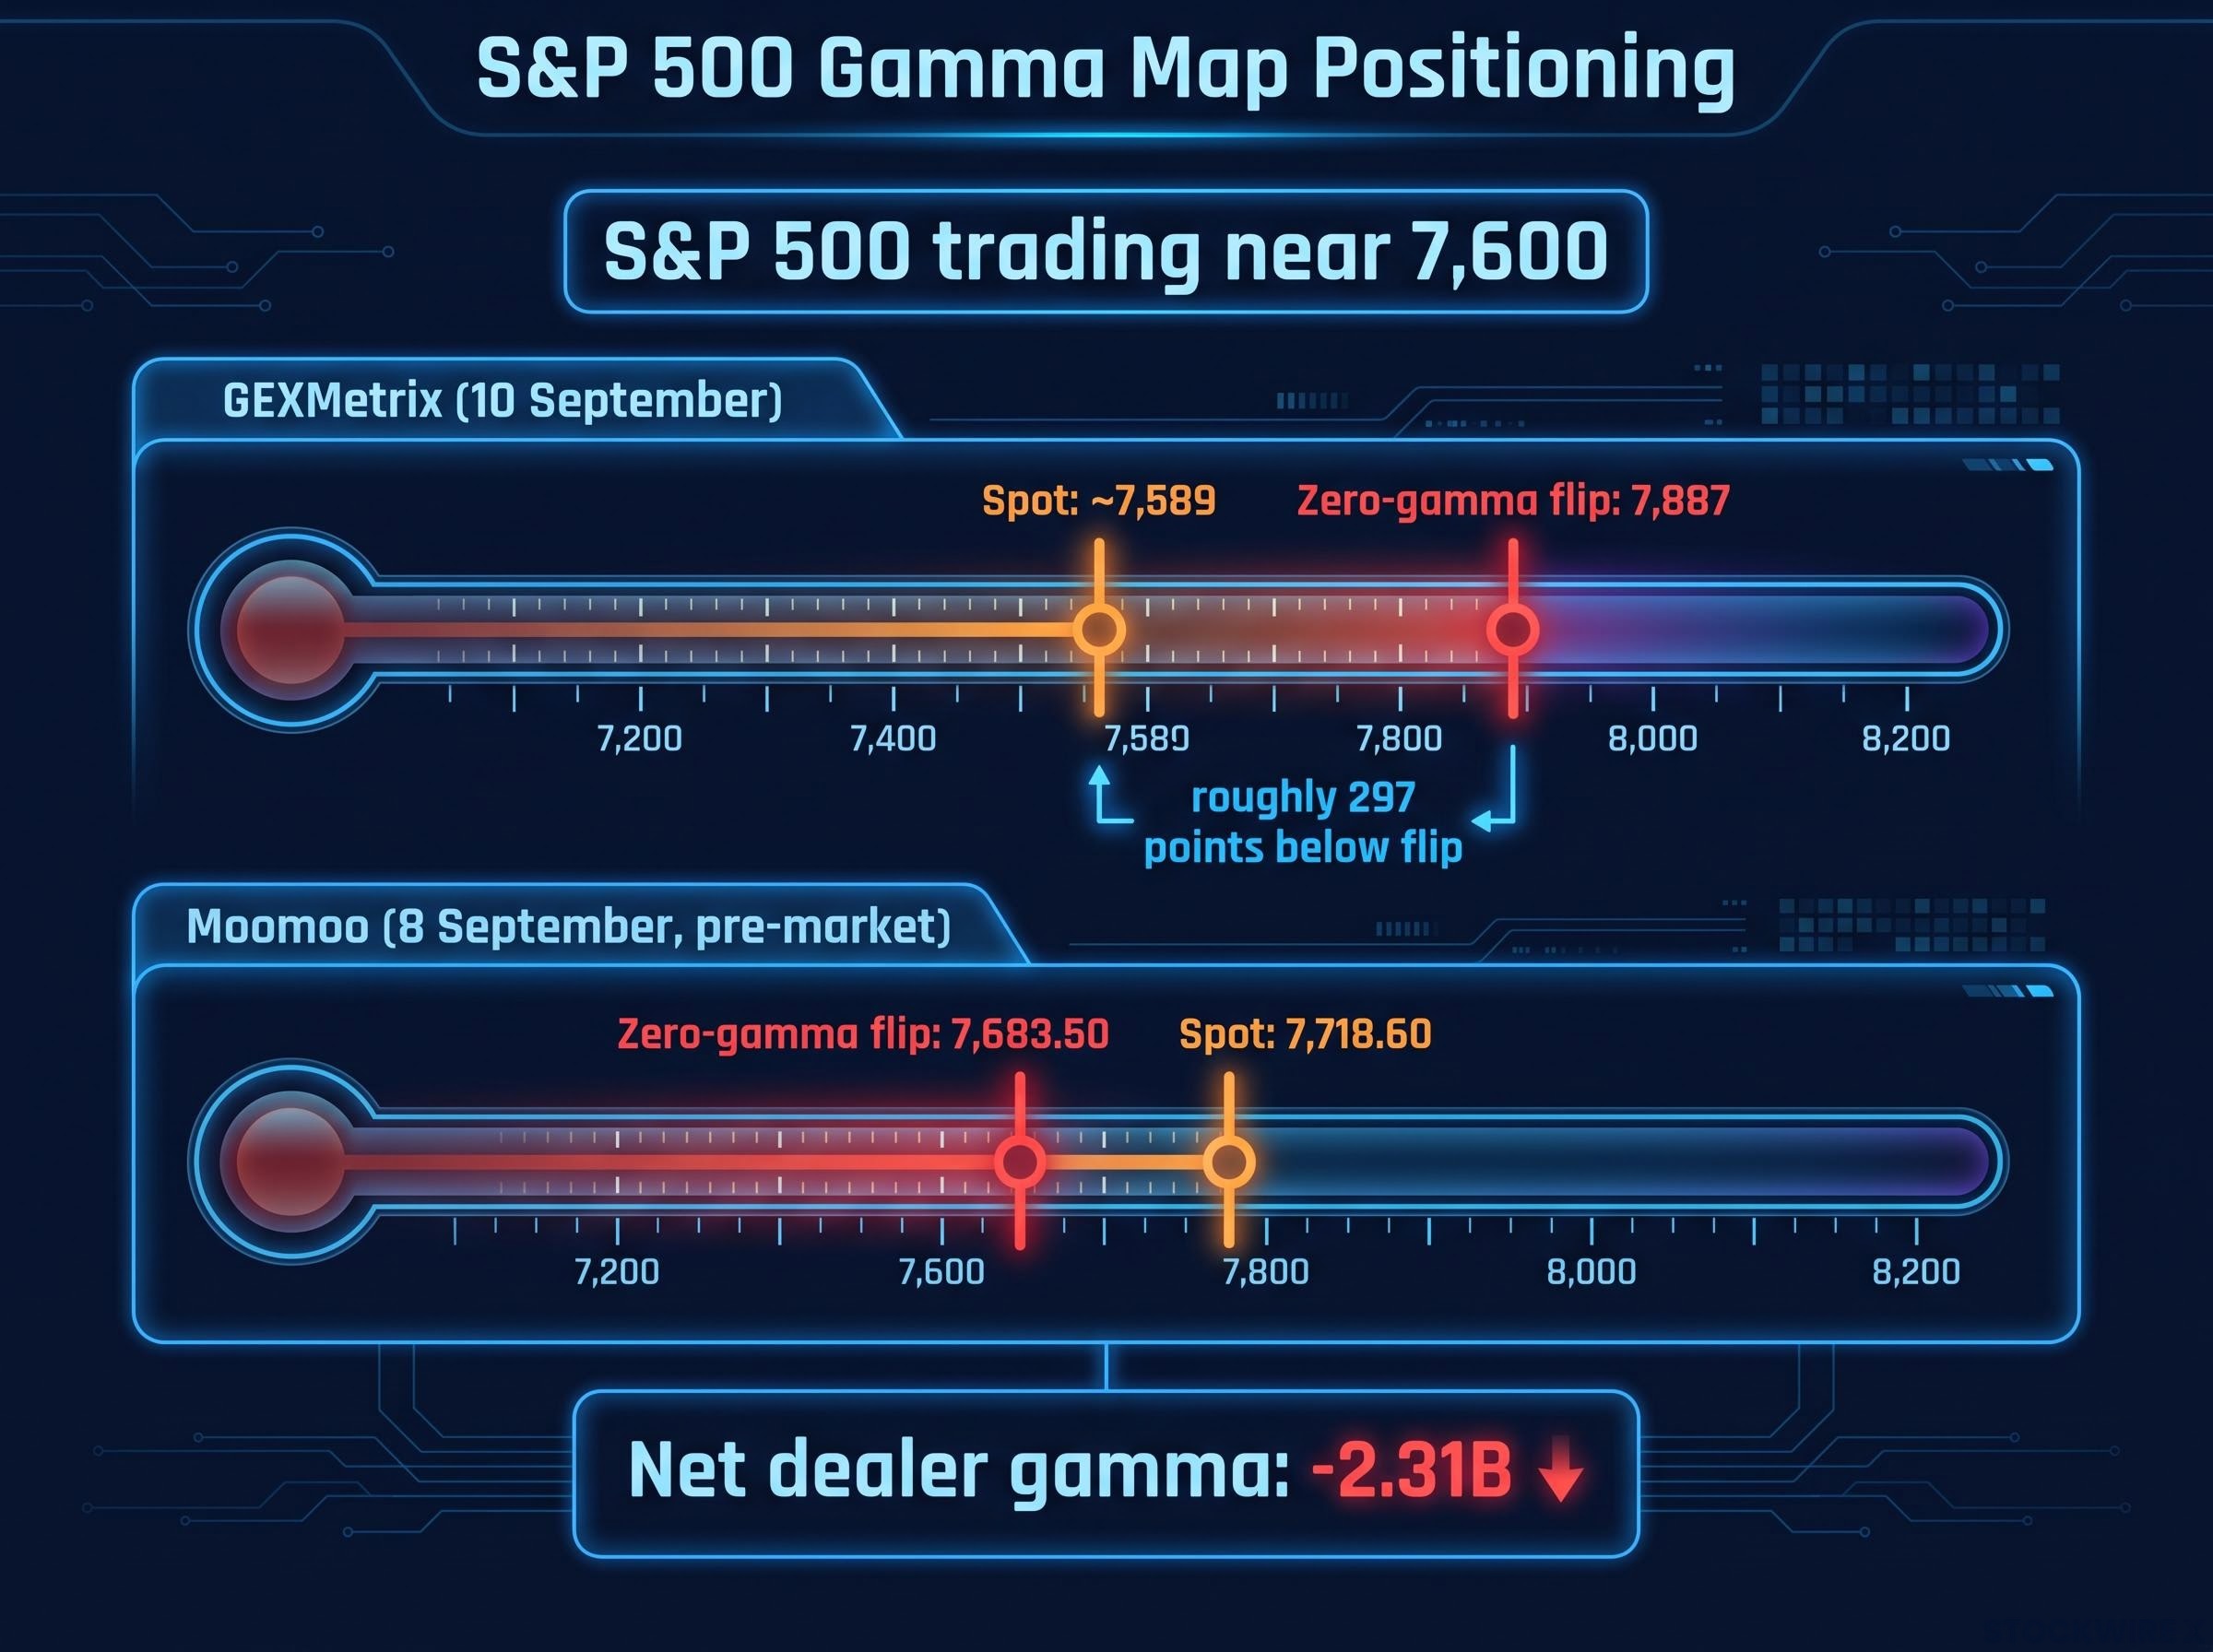
Net dealer gamma: -2.31B A negative reading confirms dealers are positioned to sell into weakness rather than buy it, the destabilising side of the map.
The disagreement between models tells you something useful about how to hold this information. During the August 2025 episode, bank estimates of dealer gamma ranged wildly, from $3 billion to $74 billion short per 1% move. When the professionals cannot pin the number, you should treat the 7,600 area as a zone of structural vulnerability rather than a precise trigger, and calibrate your thinking accordingly. Knowing where the index sits relative to that flip gives you a structural lens for reading recent price action and for judging how much amplification risk is baked into the current setup.
Institutional hedging demand has been unusually visible in the December SPX options market, where put contracts roughly 460-470 points out of the money are trading at a $2,600 premium over equivalent calls, a skew that corroborates the structural vulnerability the gamma map is currently signalling.
The vanna feedback loop: how rising volatility makes the selling worse
Gamma is not the only amplifier operating here. There is a second layer, and it turns volatility itself into a force multiplier once it starts climbing.
That layer is vanna, the sensitivity of an option’s delta to changes in implied volatility. Gamma reacts to price moving. Vanna reacts to volatility moving. When implied volatility rises, the delta of out-of-the-money puts increases, and dealers who are short those puts have to sell more of the underlying to stay hedged.
Here is how the loop turns:
- Implied volatility rises, often on a catalyst or a first leg lower.
- The delta of out-of-the-money puts increases as a result.
- Dealers short those puts sell more underlying to stay delta-neutral.
- That selling pushes prices lower, which spikes implied volatility further, and the loop repeats.
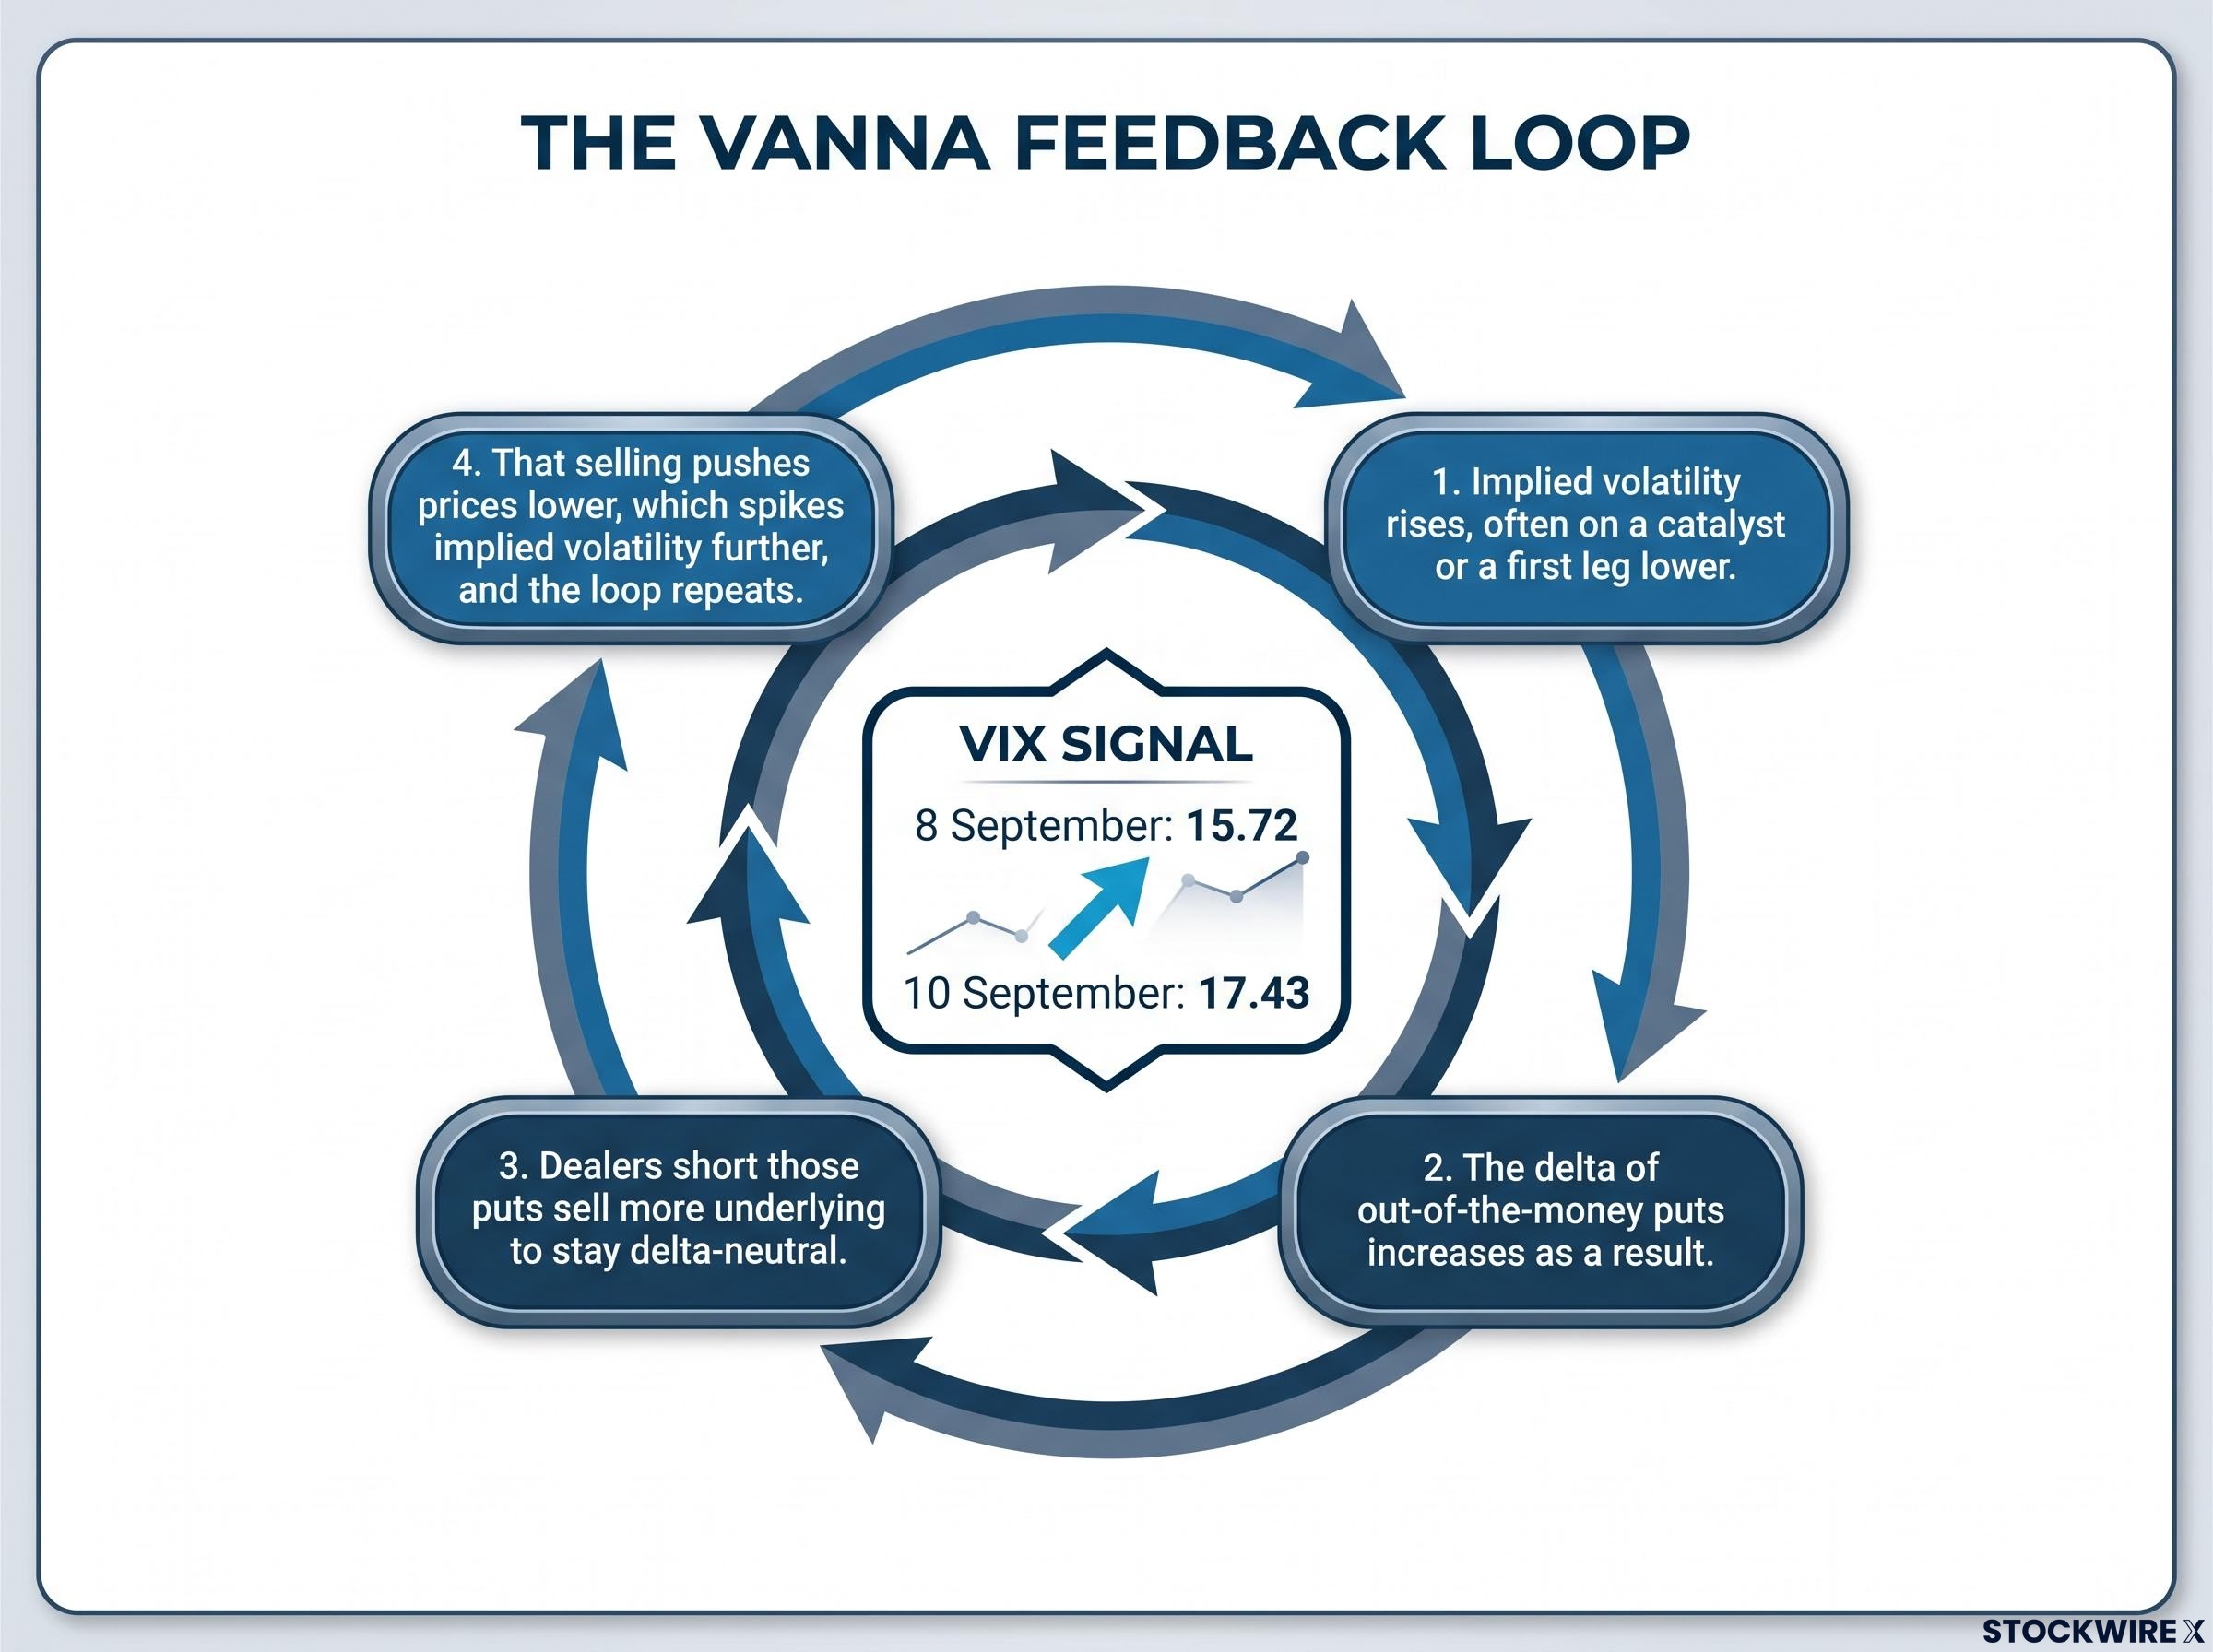
When vanna, gamma and charm flows all point the same direction, the cascade risk rises materially. The danger is not just that it exists, it is that a compressed starting point leaves more room for it to unfold.
What the current VIX setup signals
Volatility has been moving. The Cboe Volatility Index (VIX) sat at 17.43 on 10 September, up from 15.72 on 8 September, a meaningful two-session climb that reads as early-stage pressure rather than a completed event.
At the same time, SPY 30-day at-the-money implied volatility has been running at just 11.5% to 11.7%, ranked between the 4.8th and 23rd percentile over a one-year window. That is subdued, and it is where the framework turns your intuition upside down.
Compressed implied volatility is not a sign of safety. It is the setup condition for a larger vanna-driven amplification if a catalyst arrives, because low starting volatility leaves so much room to expand. Read low IV as risk concentration, not risk absence. The VIX term structure has also shown signs of compression, though sources conflict on the exact spread, so treat it as directional context rather than precise data. The point stands: watching VIX movement is a leading indicator of structural pressure, not merely a sentiment gauge.
The gap between implied and realised volatility, the volatility risk premium, is what makes options selling structurally profitable over long periods, but it can invert sharply during slow-moving crises, flipping from its long-run average of roughly 406 basis points positive to deeply negative and turning premium sellers into forced buyers at the worst moment.
When gamma flips have mattered historically
None of this is theoretical. Gamma-amplified declines have shown up on documented timelines, and each episode carries a distinct lesson rather than repeating the same one.
In August 2023, Goldman Sachs attributed a 0.4% drop in the S&P 500 within 20 minutes to roughly 100,000 bearish zero-DTE SPX puts (about $45 billion notional), which forced market makers into a rapid scramble for hedges. The lesson there is speed: gamma flows can compress a meaningful move into minutes.
A 0.4% drop in 20 minutes The August 2023 episode showed how quickly hedging flows can move price when zero-day options concentrate in one direction.
By August 2025, competing bank models estimated dealers had become short between $3 billion and $74 billion of gamma per 1% move after crossing zero-gamma thresholds near 5,300 to 5,500. The lesson is uncertainty of scale: the models disagreed by an order of magnitude, which tells you the direction of these flows is far more knowable than their size.
The mechanics are not confined to the index. Oracle’s earnings setup showed the same forces at the single-stock level, with an options-implied expected move of about 10%, one-day options IV near 200%, an October cycle around 70% IV, and a risk reversal rank in the 95th percentile, an extreme upside skew.
| Episode | Trigger event | Gamma estimate | Key outcome |
|---|---|---|---|
| August 2023 | ~100,000 zero-DTE SPX puts ($45B notional) | Not modelled per-move | 0.4% S&P drop in 20 minutes |
| August 2025 | Break below 5,300-5,500 gamma thresholds | $3B to $74B short per 1% move | Exaggerated price swings, models split |
| Oracle 2026 earnings | Extreme upside call skew into results | Single-name, one-day IV ~200% | 95th percentile risk reversal rank |
The wide gap between the $3 billion and $74 billion estimates should not shake your confidence in the direction. It should tell you that the exact size of gamma-driven flows is less knowable than which way they push, and for positioning, the direction is what counts.
How experienced traders are structuring positions around this environment
This is where analysis turns into application. In a high-IV, negative-gamma setup, professional traders are not reaching for simple directional bets, and the reason is mechanical.
Buy a naked long option ahead of an event and you take on the full weight of the volatility crush that follows. When the event passes and implied volatility collapses, that decay can swamp your directional gains even when you called the direction correctly. A strong rally into elevated IV typically compresses volatility, dragging directly on a long call’s value.
That is why defined-risk, multi-leg structures are preferred. They cap maximum loss and blunt vega exposure, the sensitivity to changing volatility.
- Bear put spread: high vol crush exposure on the long leg, but the short leg harvests some of it. Maximum loss is fully defined. Well suited to high-IV environments where you want downside cover without paying full premium.
- Call diagonal: monetises rich short-dated skew by selling near-term elevated IV against a longer-dated long. Defined structure, and effective where upside skew is extreme, as it was in Oracle.
- Outright long call: maximum vol crush exposure with no offset. Loss is limited to premium, but in high-IV regimes it is the least efficient of the three.
Bear put spread construction gives traders three separate paths to avoid maximum loss rather than the single directional path required by a long put, because positive theta works in the seller’s favour on the short leg each day that price does not breach the short strike.
For Oracle specifically, the logic favoured selling a call diagonal to monetise the upside skew (risk reversal rank in the 95th percentile, one-day IV near 200%) rather than buying calls straight into a volatility crush. Patience matters too. Analysts recommend waiting for event-driven implied volatility to settle before committing meaningful capital, which means timing relative to the volatility event can matter as much as direction.
Delta guidelines and position sizing in negative gamma regimes
The execution parameters give the logic something concrete to stand on. A standard bear put spread guideline is to buy a put with a delta of -0.50 to -0.60 and sell one near -0.30 delta.
Those levels balance the cost of protection against its effectiveness: the long strike is close enough to react, the short strike far enough to cheapen the trade meaningfully. A common risk-management principle caps the net debit at no more than 40% of the spread width, treated as a discipline rather than a rigid rule.
The takeaway extends well beyond Oracle or today’s S&P level. In this environment, being directionally right is not enough. The structure of the trade determines whether a correct call becomes a profit, and that reframes how you think about every position. Rate-sensitive instruments such as the Russell 2000 (IWM) remain prime candidates for selective downside hedging.
Reading the market structure before the next move
You do not need a directive on what to do. You need a checklist of what to watch, so the next sharp move finds you alert rather than reacting.
Three structural variables are worth monitoring:
- The S&P 500’s position relative to the zero-gamma flip. Below it, hedging amplifies. Above it, hedging cushions.
- The direction and rate of change in the VIX. Rising VIX is the vanna signal, an early sign that the volatility loop may be engaging.
- The slope of the options term structure. Compression at the front end is an early-warning stress indicator.
Be honest about the limits. Gamma and vanna operate alongside fundamental macro flows and can be overpowered by them. Treat them as conditional amplifiers, not standalone predictors of where the market goes next.
Current structural summary The S&P 500 sits roughly 297 points below the zero-gamma flip near 7,887, the VIX is rising at 17.43, and implied volatility is compressed but moving. Pending CPI data and a Federal Reserve meeting are the catalysts most likely to trigger a vanna cascade if they disappoint.
Structural amplifiers matter most when fundamental uncertainty is already high, which is precisely the setup you are looking at. As a habit worth keeping: before you read a market move as fundamental, check whether the options structure is positioned to amplify it. The two explanations are not mutually exclusive, and the structural one often hits first. It is also worth remembering how fast elevated IV can reverse, Oracle’s conservative volatility crush floor sat near 50% IV, a reminder that these conditions mean-revert quickly once an event clears.
This article is for informational purposes only and should not be considered financial advice. Investors should conduct their own research and consult with financial professionals before making investment decisions.
Past performance does not guarantee future results. These statements are speculative and subject to change based on market developments. Some concepts have been simplified for readability.