Gold rose 64% in a single year and then kept climbing, clearing $5,300 per ounce in early 2026. That kind of move does not happen because investors suddenly decided they liked shiny metal.
It happens because three specific macroeconomic forces aligned in the same direction at the same time, and most investors only understand one of them.
The conventional explanation for gold’s rally points to the Federal Reserve cutting rates. That is true but incomplete.
Crude oil prices, Treasury yields, and Fed policy do not operate in sequence like dominoes. They operate as an interconnected system, and understanding how oil feeds inflation expectations that feed real yields that feed gold is what separates investors who can position ahead of the next cycle from those who react to it after the fact.
This gives you a durable framework for reading gold’s price signals: what to watch in crude oil markets, how to interpret the difference between nominal and real Treasury yields, and how to think about the Fed’s role not as a simple on/off switch but as one input in a dynamic equation. Applied to the September 2025 FOMC rate cut and the conditions around it, that same framework explains one of the most significant commodity rallies in modern financial history.
Why oil prices are a leading indicator for gold, not just an energy story
Most people think about crude oil in terms of what they pay at the pump. For a gold investor, that is the least interesting thing about it.
Oil matters because it is a cost input across the entire economy. Petroleum feeds into manufacturing, transportation, and the production of countless consumer goods, which means a sustained rise in crude prices shows up eventually in broad inflation, not just the energy line of your monthly budget. That is what makes oil a leading signal for gold rather than a separate energy trade.
Here is the sequence that connects the two:
- Oil prices rise, lifting transportation and manufacturing costs across the economy.
- Those costs feed into headline CPI, the government’s main measure of consumer price inflation.
- If the rise looks persistent, it lifts breakeven inflation rates, the market’s implied inflation forecast embedded in inflation-protected Treasury securities.
- That shift in inflation expectations is the actual link to gold, because it changes the after-inflation return on safe assets.
The important word in that chain is conditional. The oil-to-gold link is strongest when central banks look reluctant or unable to counter the inflation signal forcefully. It is weakest when markets believe the Fed will hike rates hard enough to kill the inflation before it takes hold.
By September 2025, this dynamic was quietly setting the stage for gold’s move. WTI crude was trading in the $62-$65 per barrel range, with Brent around $67-$68 per barrel. Year-over-year CPI was running near the 3% range, based on August data released around 11 September 2025.
Gary Wagner of thegoldforecast.com described crude oil as an important underlying driver of inflationary pressures, a key variable to monitor alongside the formal CPI and PPI readings. In his 9 September 2025 analysis, he pointed to a directional correlation between the WTI and Brent trend, 10-year Treasury yields, and gold prices visible in year-to-date chart overlays.
Those September oil levels tell you something specific about the inflation signal feeding gold’s rally. This was not an extreme energy spike. It was a sustained, moderately elevated crude price that kept inflation expectations from falling, and that alone was enough to suppress real yields and hand gold a tailwind.
So when you watch oil as a signal for gold, the headline price is not the point. What matters is whether an oil move is shifting breakeven inflation expectations. That distinction is what determines whether a rise in crude is a gold catalyst or a gold headwind. (Note: precise WTI and Brent levels after September 2025 could not be confirmed in available data, so September 2025 serves as the price anchor here.)
The transmission from oil price inflation into CPI and then into Fed policy decisions is not theoretical: a Brent crude spike to $106 per barrel in mid-2026 pushed the April CPI projection to 3.7% year-over-year and immediately compressed market pricing for rate cuts, a live example of the same transmission chain described above.
When big ASX news breaks, our subscribers know first
What real yields actually are, and why they matter more than the headline rate
You already track the number the Fed announces at every meeting. Here is the uncomfortable part: that number is not the one that actually moves gold.
Gold pays no interest and no dividend. So the cost of holding it is measured against the after-inflation return you could earn on a safe asset instead, and that after-inflation return is the real yield.
The inverse relationship between real yields and gold prices held even through the fastest rate-hiking cycle in four decades, because surging inflation expectations kept after-inflation returns on Treasuries negative long after nominal rates had climbed sharply.
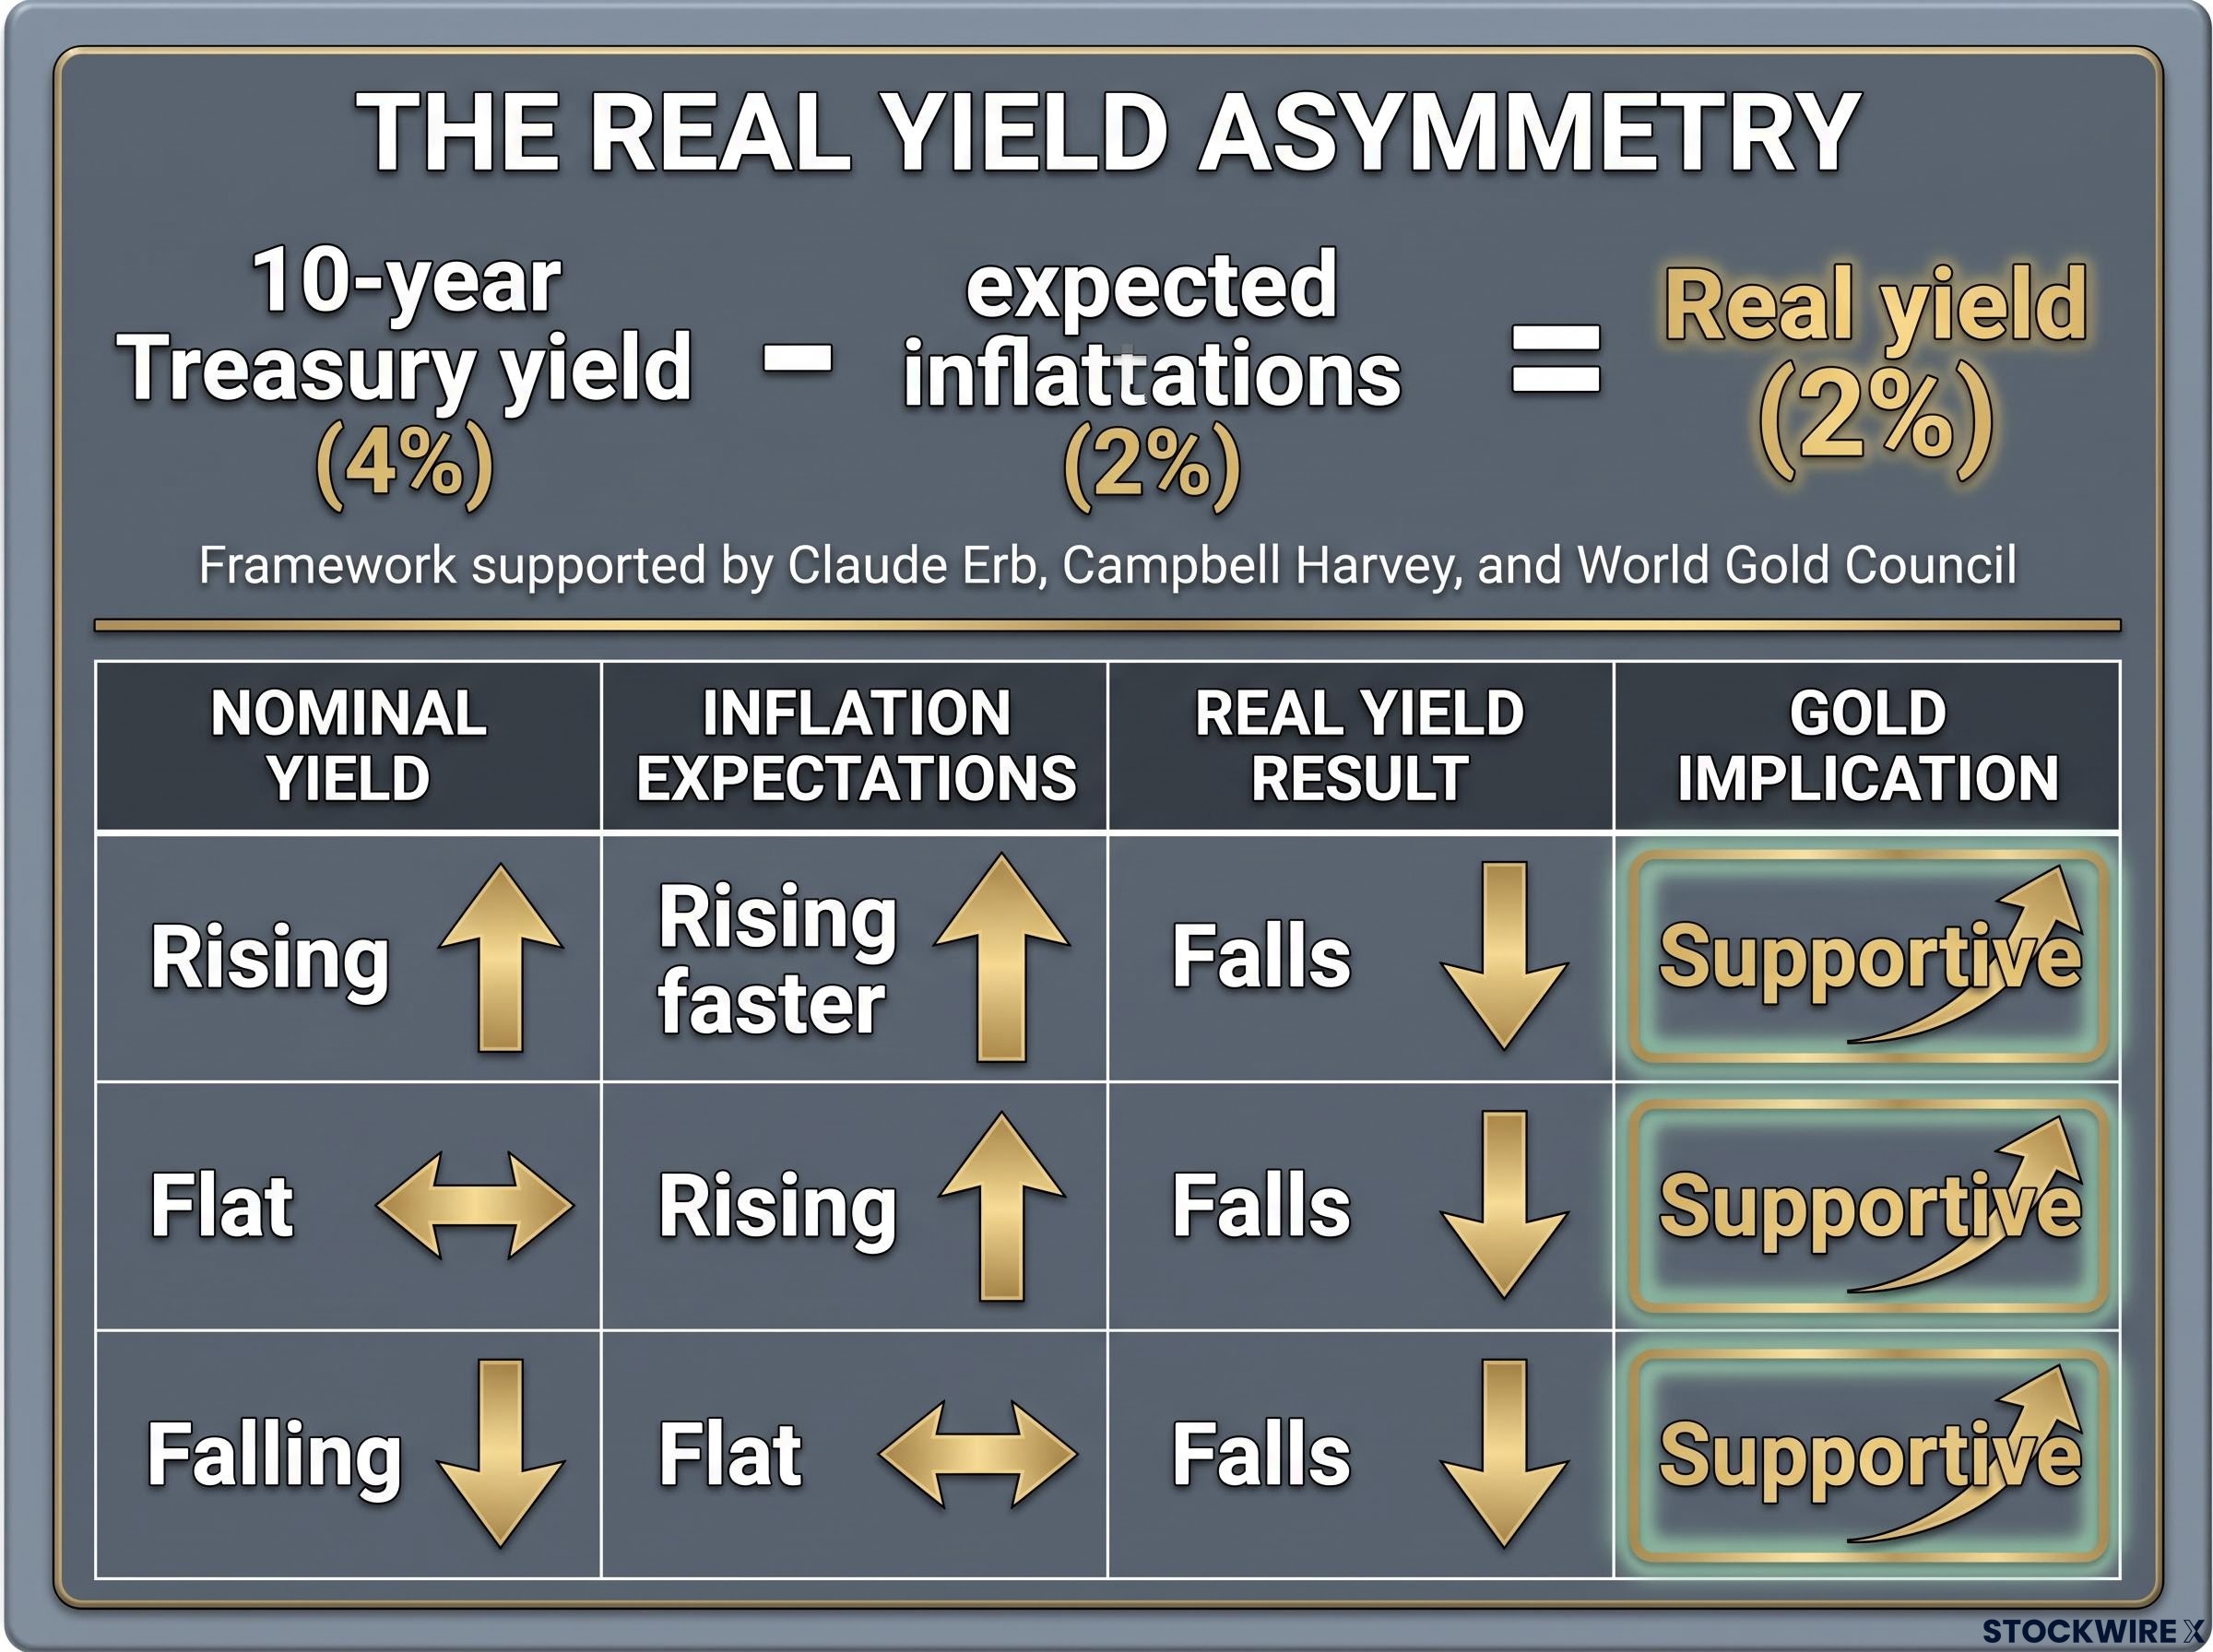
A real yield is simply the nominal Treasury yield minus expected inflation. If a 10-year Treasury yields 4% and markets expect 2% inflation, the real yield is roughly 2%. That is the genuine opportunity cost of parking money in gold rather than bonds.
This creates an asymmetry most casual observers miss. Nominal yields can be rising while real yields are falling at the same time, as long as inflation expectations are rising faster. In that scenario, gold can rally even as interest rates nominally climb.
The table below makes the asymmetry concrete.
| Nominal Yield | Inflation Expectations | Real Yield Result | Gold Implication |
|---|---|---|---|
| Rising | Rising faster | Falls | Supportive |
| Flat | Rising | Falls | Supportive |
| Falling | Flat | Falls | Supportive |
This is not a fringe theory. Economists Claude Erb and Campbell Harvey identified real interest rates as a central input in explaining long-run gold pricing, capturing both the monetary stance and inflation expectations in a single number. The World Gold Council has documented a consistent inverse relationship between gold and U.S. 10-year real yields, while gold’s relationship with nominal yields or headline inflation alone is weaker and less stable.
There is a practical tell buried in the 2025 data. The 10-year Treasury yield tracked oil price movements more closely than gold did in near-term chart overlays, exactly what you would expect if oil is driving inflation expectations, which in turn drive rate expectations.
So when you see gold rallying alongside rising nominal Treasury yields, do not conclude the move is irrational. Check the TIPS breakeven rates first. Rising breakevens quietly reducing real yields is the most common hidden driver of that pattern, and spotting it is the single most useful shift you can make in reading gold price signals.
How a rate cut transmits into real yield compression
A Fed rate cut does not act on gold directly. It works through a five-step chain.
- Short-term nominal rates fall as the cut lowers overnight and short-dated yields directly.
- Longer-term nominal yields adjust if the cut signals a more accommodative path ahead.
- Inflation expectations rise, because easier policy nudges breakevens higher, especially if markets sense the Fed is tolerating inflation to protect growth.
- Real yields decline, sometimes by more than the nominal cut alone, because the inflation component is doing part of the work.
- Gold’s opportunity cost falls, making non-yielding bullion more attractive relative to Treasuries.
The September 2025 quarter-point cut is the concrete example. It did not create gold’s bull market on its own. It reinforced structural drivers that were already present, a declining dollar and elevated inflation expectations, by lowering the real return you could earn by staying in bonds.
The Federal Reserve’s September 2025 FOMC statement confirmed the quarter-point reduction to the federal funds target range, framing the cut as a recalibration against a backdrop of moderating but still-elevated inflation, providing the precise policy context that set real yields on their suppressed path into 2026.
How the Fed’s pause after September 2025 became its own gold catalyst
It is tempting to read a Fed on hold as a non-event. That reading is wrong, and understanding why is the key to this whole section.
From January through July 2026, the FOMC held the federal funds target range at 3.50%-3.75% at every single meeting: 28 January, March, 29 April, 17 June, and 30 July 2026. The June Summary of Economic Projections showed a median 2026 rate of roughly 3.6%, consistent with that hold.
That string of holds was not the absence of news. It was a sustained signal that real yields were being kept at a level that reduced the opportunity cost of holding gold relative to Treasuries.
Here is the mechanism. If inflation expectations stayed elevated because oil prices had not meaningfully collapsed, then holding nominal rates unchanged meant real yields stayed suppressed, even without a single additional cut. A Fed that declines to raise while inflation runs positive is, in effect, choosing to keep real yields low.
The market noticed. Gold rose 64% across full-year 2025 and added a further 22% year-to-date through late January 2026, clearing $5,300 per ounce.
Gold returned +64% in 2025 and a further +22% year-to-date through late January 2026, moving above $5,300 per ounce, one of the largest structural commodity moves in modern financial history.
But honesty requires acknowledging that real yields do not explain the entire move. There are three competing explanations for the 2025-2026 rally, and the evidence supports holding all three at once:
- Real-yield suppression: a Fed on hold keeping after-inflation returns on safe assets unattractive.
- Central-bank structural demand: sustained official-sector buying independent of rate mechanics.
- Geopolitical risk premium: safe-haven flows that Reuters cited as a contributing factor to the early-2026 acceleration.
U.S. Bank Global Wealth Management noted that higher market-based rates had already tightened financial conditions by July 2026, yet gold kept advancing anyway. That detail alone tells you the real-yield framework is powerful but not a complete model.
For your own positioning, this reframes the question entirely. The relevant question is not “will the Fed cut again?” It is “how long will real yields stay below a level that makes Treasuries genuinely attractive after inflation?” Every meeting the Fed holds while inflation expectations stay positive is another meeting real yields are being actively suppressed, and that suppression is priced into gold continuously, not as a one-time event. That framing shifts your attention away from FOMC headlines and toward the TIPS market.
Historical regimes where this framework held and where it broke down
Gold’s current run is not unprecedented. Three earlier episodes show the same framework at work, each closer to today than the last.
The 1970s stagflation period is the foundational case. Repeated oil shocks, high and volatile inflation, and stretches of negative real rates produced a structural, multi-year re-rating of gold after the collapse of Bretton Woods. The lesson researchers draw is that persistent negative real rates plus doubts about monetary credibility can fuel a multi-year bull market, not merely a cyclical bounce.
The post-Global Financial Crisis period (2008-2011) shows the same outcome through a different door. Aggressive quantitative easing, low policy rates, and sovereign-debt worries drove gold from under $1,000 per ounce to above $1,800 per ounce. Note that headline oil inflation was not the trigger here. Suppressed real yields and unconventional easing were enough.
The pandemic-era rally (2019-2020) illustrates gold’s dual role. Central banks cut to the lower bound and launched huge asset-purchase programmes, and gold rallied as both a macro-policy hedge and a safe-haven asset. It also showed a limit: in acute stress, risk-off flows can temporarily overwhelm the real-yield signal.
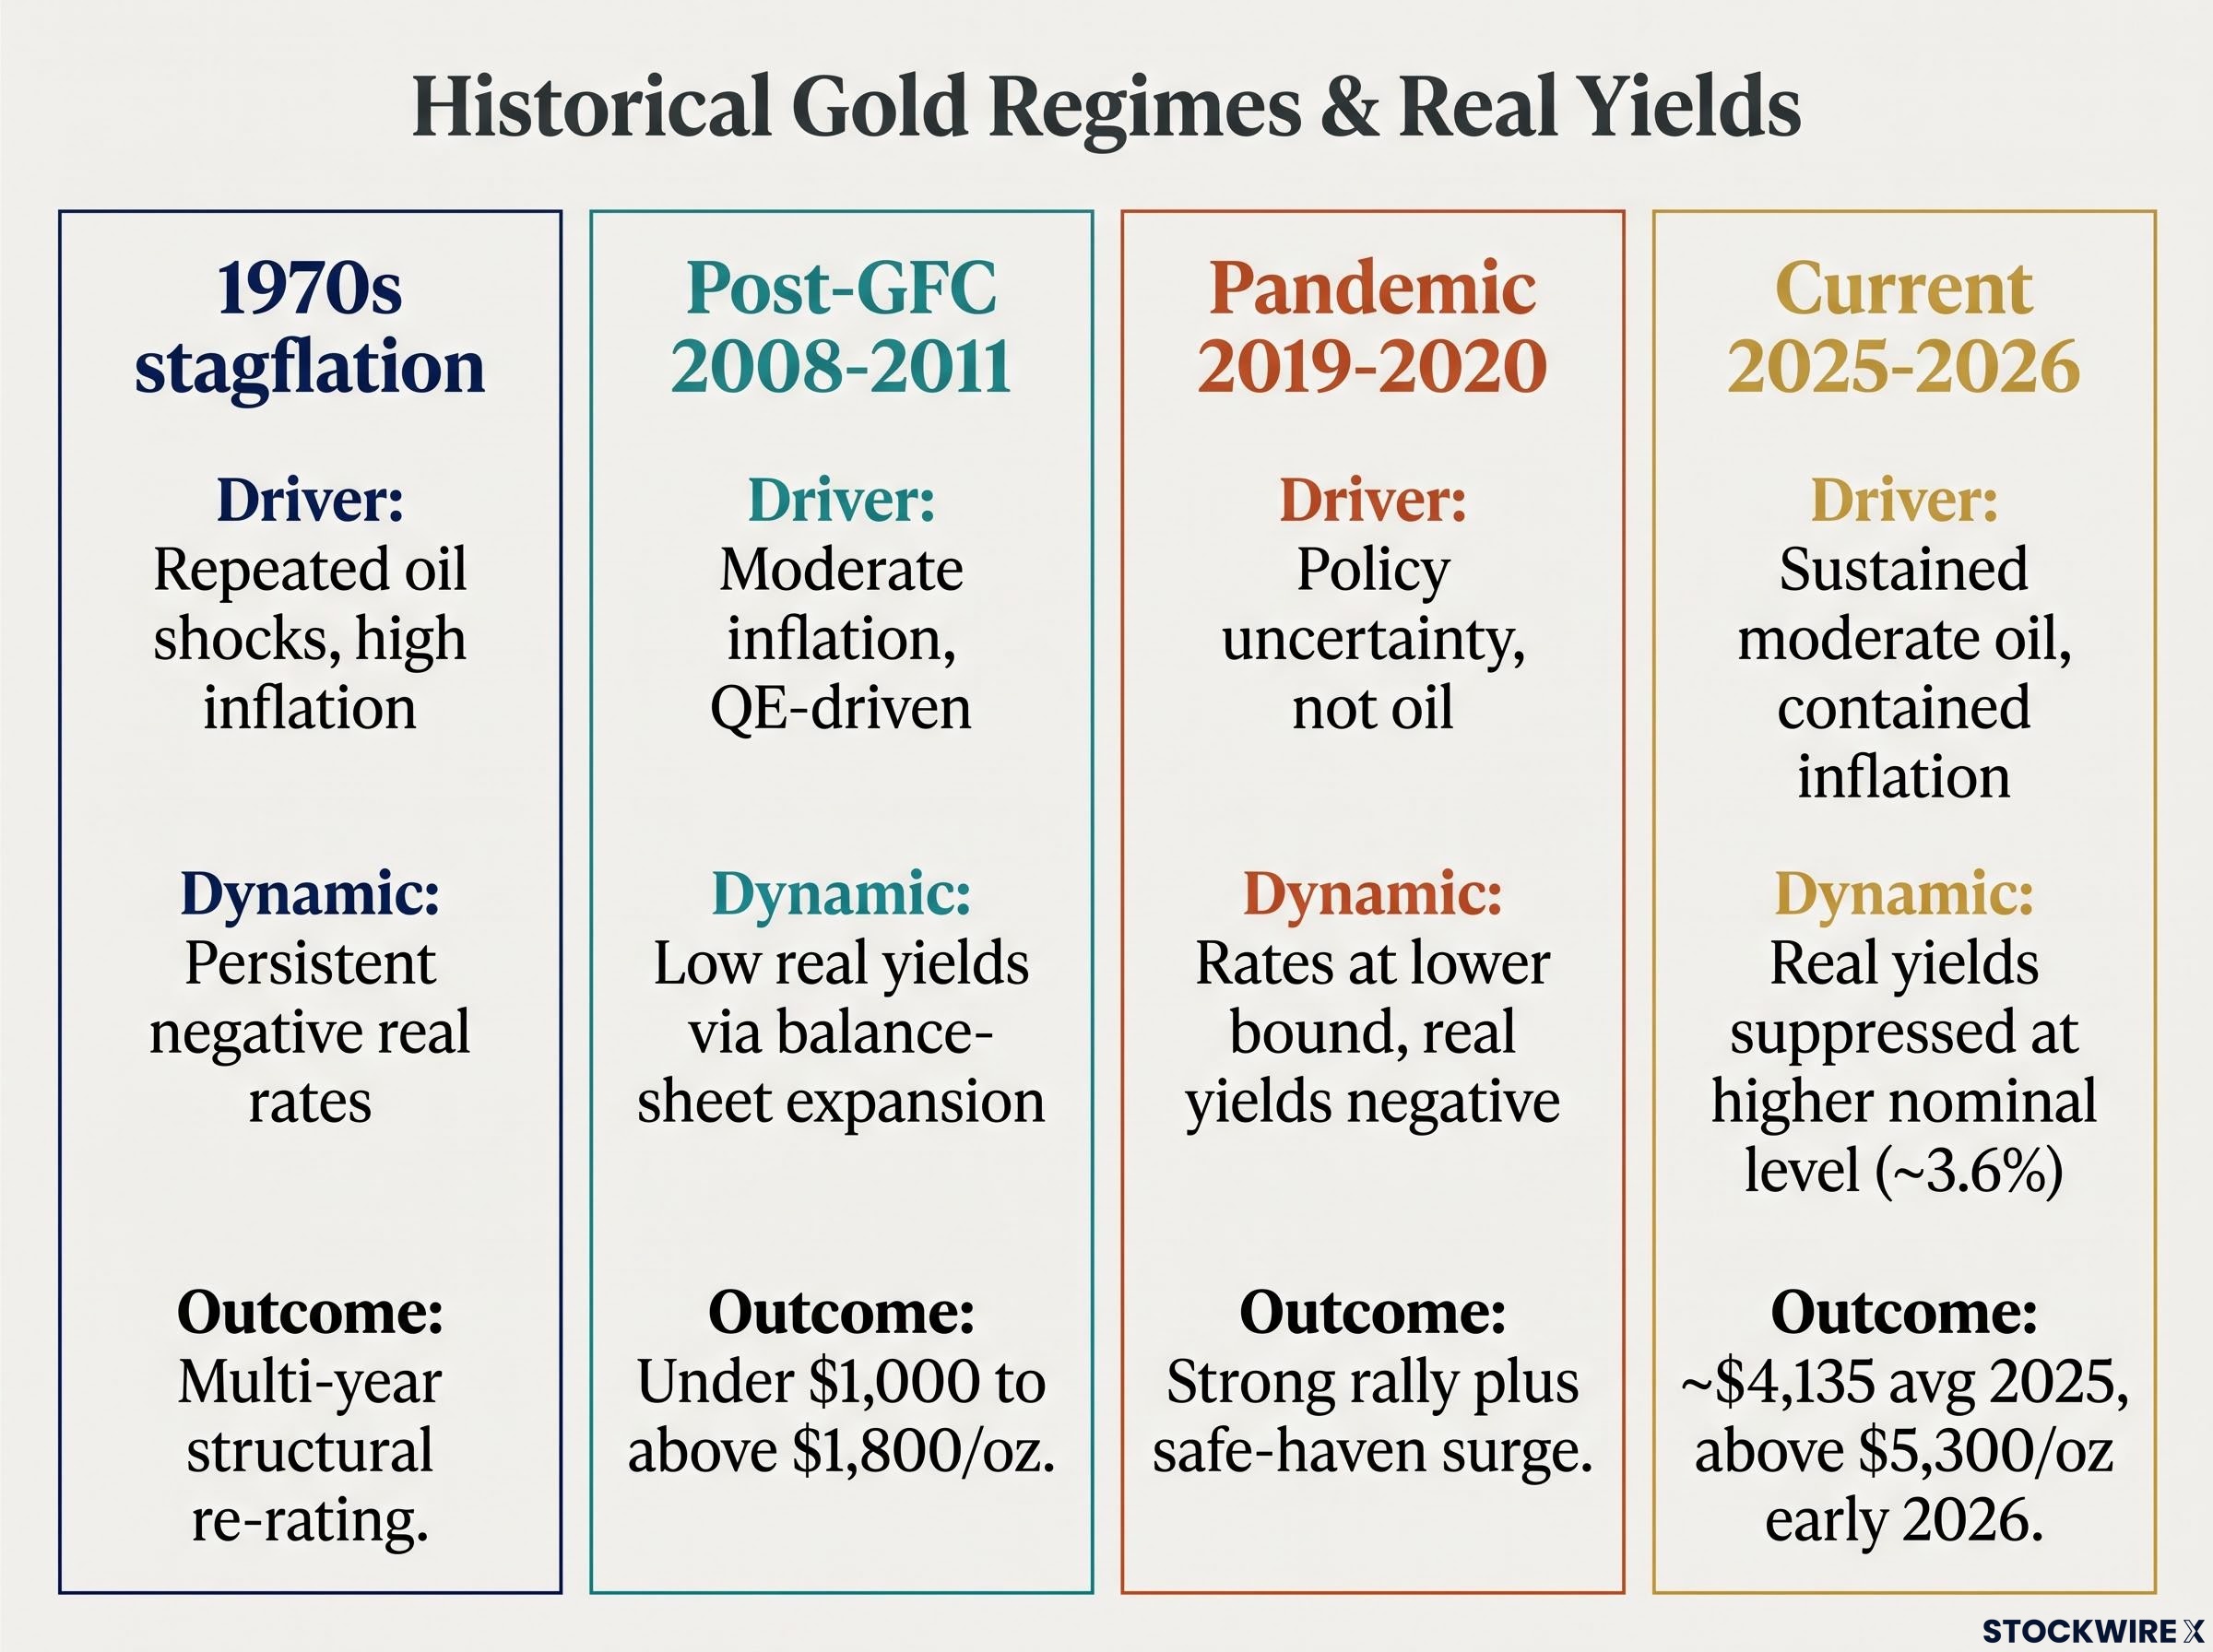
The table pulls these together.
| Episode | Key Oil/Inflation Driver | Real Yield Dynamic | Gold Outcome |
|---|---|---|---|
| 1970s stagflation | Repeated oil shocks, high inflation | Persistent negative real rates | Multi-year structural re-rating |
| Post-GFC 2008-2011 | Moderate inflation, QE-driven | Low real yields via balance-sheet expansion | Under $1,000 to above $1,800/oz |
| Pandemic 2019-2020 | Policy uncertainty, not oil | Rates at lower bound, real yields negative | Strong rally plus safe-haven surge |
| Current 2025-2026 | Sustained moderate oil, contained inflation | Real yields suppressed at higher nominal level | ~$4,135 avg 2025, above $5,300/oz early 2026 |
The lesson from all three prior episodes is the same. Gold’s strongest structural rallies are anchored in regimes where the after-inflation return on safe assets stays unattractive for an extended stretch, and the 2025-2026 cycle fits that pattern more closely than any period since the post-GFC years.
What makes the 2025-2026 cycle distinct from the historical playbook
Two differences matter for how you apply the framework today.
First, headline inflation has been far more contained than in the 1970s, and the Fed maintains explicit inflation targets rather than the credibility vacuum of that era. Second, there is no outright quantitative easing as there was after 2008. The framework is operating through real-yield suppression at a higher nominal rate level than in prior cycles, roughly 3.6% rather than near zero.
That points to the specific condition that would break the pattern. A credible signal from the Fed that it will sustain meaningfully higher real rates would do two things at once: it would raise the opportunity cost of holding gold and signal that monetary credibility is being restored. Historical pattern recognition does not guarantee the current cycle ends like the last one, but it does tell you exactly what to watch for.
What the three-way relationship tells you to watch going forward
Enough history. The framework is only useful if it hands you something concrete to monitor from here.
Reduce your gold monitoring to three variables, in priority order:
- Oil’s effect on breakeven inflation. Watch not the crude headline but whether oil moves are lifting or lowering TIPS-implied inflation expectations, because that is the actual transmission point into real yields.
- The gap between nominal Treasury yields and TIPS-implied real yields. A widening real-yield suppression is the core structural tailwind; a narrowing one is the early warning.
- The direction of the US dollar. A materially stronger dollar tends to suppress dollar-denominated gold even when real yields are mildly supportive, so the dollar serves as a cross-check on the real-yield signal.
The primary downside risk runs through the same mechanism that created the tailwind. If oil prices fall meaningfully and headline inflation normalises, the inflation-expectations component shifts, and real yields can rise without any nominal rate hike at all. That would turn the machinery against gold.
A structural breakdown in the gold-real-yields relationship emerged clearly in 2022-2023, when central-bank accumulation running at roughly 1,000 tonnes per year and growing mistrust in US fiscal credibility began driving gold independently of the TIPS-implied real rate, adding a layer the oil-yields-Fed framework alone does not capture.
Positioning is the other flag. With gold above $5,000 per ounce at record highs, strategists have flagged elevated futures and ETF positioning as a vulnerability to sharp corrections if sentiment turns. Research also cautions that central-bank structural demand, supportive as it has been, is not guaranteed to continue at the 2023-2025 pace.
With gold at record highs above $5,000 per ounce, the structural tailwind and speculative momentum are now running at the same time. The reader’s task is to distinguish between them, because one is durable and the other can reverse quickly.
Here is the practical filter. You do not need to predict whether the Fed cuts or holds. You need to watch whether the spread between nominal Treasury yields and TIPS breakeven inflation is widening or narrowing, because that spread is what actually determines whether gold’s structural tailwind is intact or fading.
A framework built for the next cycle, not just the last one
Strip everything back and the mechanism reduces to a single line. Oil shapes inflation expectations, inflation expectations shape real yields, and real yields determine the opportunity cost of holding gold relative to safe assets.
That chain is what a 64% gain in 2025 and a climb above $5,300 per ounce by late January 2026 actually reflect, unfolding against a federal funds range held at 3.50%-3.75% across every 2026 meeting to date.
No single framework captures every driver of gold in every environment. Central-bank buying, geopolitical risk premiums, and dollar dynamics all create periods where gold deviates from what real yields alone would predict, and anyone treating this as a complete model rather than a primary lens will be periodically wrong.
What it does give you is three falsifiable conditions to monitor: real yields staying suppressed, oil keeping inflation expectations elevated, and the Fed maintaining its current pause. If all three hold, the structural tailwind remains intact. If any one shifts materially, you have an early signal to reassess rather than waiting for the price to tell you first.
Understanding the oil-yields-Fed relationship as a system, not three separate inputs, is the analytical edge, and it works across commodity cycles, not only the specific conditions of 2025-2026.
For investors wanting to apply this framework to near-term positioning decisions, our full explainer on gold price scenarios for H2 2026 examines how the Fed’s October rate decision maps onto specific price recovery targets, with the World Bank’s 2026 average forecast providing the most conservative institutional floor reference.
This article is for informational purposes only and should not be considered financial advice. Investors should conduct their own research and consult with financial professionals before making investment decisions. Past performance does not guarantee future results, and financial projections are subject to market conditions and various risk factors.