
Most investors watched gold climb from $3,000 to $5,500 and assumed the move was driven purely by macro fear. The chart told a different story: every major leg of the rally was telegraphed in advance by technical levels that had been sitting in plain sight for months.
Gold’s run from mid-2025 through its January 2026 peak at $5,589 was not a random parabolic spike. It was a structurally organised advance, one in which the $3,600 support zone, the 50-day moving average, and key Fibonacci retracement bands repeatedly marked the inflection points between correction and continuation.
This piece walks you through the specific technical tools that defined gold’s trajectory over that cycle, using the September 2025 breakout as a concrete worked example. You will see what the chart structure looked like at each stage, so you can recognise the same conditions when the next cycle arrives.
Why the chart mattered as much as the macro story
The macro case for gold was easy to recite by late summer 2025. Central banks were hoarding bullion, the Federal Reserve was cutting rates, geopolitical risk was everywhere, and Western investors were pouring back into gold exchange-traded funds after years away. All of that explained why gold was rising.
None of it told you when.
That is the distinction that separates the investors who caught the September inflection from those who only read headlines. The macro drivers set the direction. The technical structure set the timing and the entry points. By the end of August 2025, spot gold sat near $3,429 per ounce, up roughly 31% for the year. The question was not whether gold could go higher, but from where the next leg would launch.
The four structural supports underneath the whole cycle were genuine, and worth naming plainly:
Central bank gold buying reached 288.9 tonnes in Q2 2026 alone, but the institutional logic behind it, jurisdictional safety and sanctions-proofing rather than price speculation, is categorically different from what retail investors are solving for, a distinction that matters when deciding how much weight to give sovereign demand as a support signal.
- Aggressive central bank buying and a broader move away from US dollar dependence
- Active Federal Reserve rate cuts that removed the yield pressure gold usually fights
- A persistent geopolitical risk premium feeding safe-haven demand
- Resurgent Western investment flows through ETFs after years of under-allocation
Those were the backdrop, not the signal. The signal lived on the chart, and the clearest one arrived on 5 August 2025.
The World Gold Council central bank reserves survey documents that central banks accumulated an average of 1,000 tonnes annually over the four years to 2026, double the preceding decade’s pace, which explains why the structural bid beneath Fibonacci support levels proved far more durable in this cycle than in 2011.
What the 50-day moving average reclaim actually signalled
The 50-day moving average is simply the average closing price over the prior 50 trading sessions, redrawn each day. Institutional traders use it as a short-term trend filter: price above it suggests the near-term structure is constructive, price below it suggests caution.
Gold had spent most of the stretch from March through early August 2025 trading below that line. That kept a large pool of systematic, rules-based capital on the sidelines, because many of those funds only engage when short-term structure turns favourable.
Then a strong upward candle on 5 August 2025 pushed gold back above the 50-day line and it held. That reclaim tells you the short-term structure had just flipped from bearish to bullish, and that is the kind of signal that decides where traders place their risk, not what a central bank governor says at a press conference. It functioned as a re-entry cue for momentum capital, which amplified everything that followed.
When big ASX news breaks, our subscribers know first
The foundation: what Fibonacci levels and moving averages actually measure
Before the September breakout makes sense, you need to understand what these two tools are actually measuring. They are not measuring the future. They are measuring memory: where crowds have transacted before, and where they tend to transact again.
Fibonacci retracements map where a price is likely to pause or reverse after a directional move. The core observation is that markets rarely travel in straight lines. After a rally, they give back a predictable proportion of the gain before, in many cases, continuing. Those proportions are the levels traders watch.
Fibonacci retracements and extensions operate on a specific set of ratios drawn from the underlying sequence, and the Golden Zone spanning the 50% to 61.8% band is where professional traders concentrate their highest-conviction entries because it captures the deepest pullback a healthy trend typically makes before resuming.
Three of them matter most in commodity markets:
- The 23.6% retracement is shallow. A bounce here is often the market barely catching its breath, and it fails frequently.
- The 38.2% retracement is a moderate pullback, tested often and respected often.
- The 61.8% retracement is deep. It is frequently the last line before a trend is considered broken.
Moving averages run on the same underlying logic. They mark roughly where the crowd’s average cost sits, which is exactly where buyers tend to defend and sellers tend to lean. Support and resistance cluster there because that is where large numbers of participants made their decisions.
Here is the part that matters for how much faith you place in any single level.
Kriterion Quant research found approximately a 62% hit rate for the deeper Fibonacci levels (38.2% to 78.6%) in commodity markets, outperforming randomly chosen price levels by roughly 4.7 percentage points.
A 62% hit rate is not certainty. It is a genuine probabilistic lean, and that lean is enough to justify building a decision framework around these levels rather than dismissing them as chart superstition. The same research flagged the shallow 23.6% level as actually underperforming random price action, which is a useful corrective against blind Fibonacci faith.
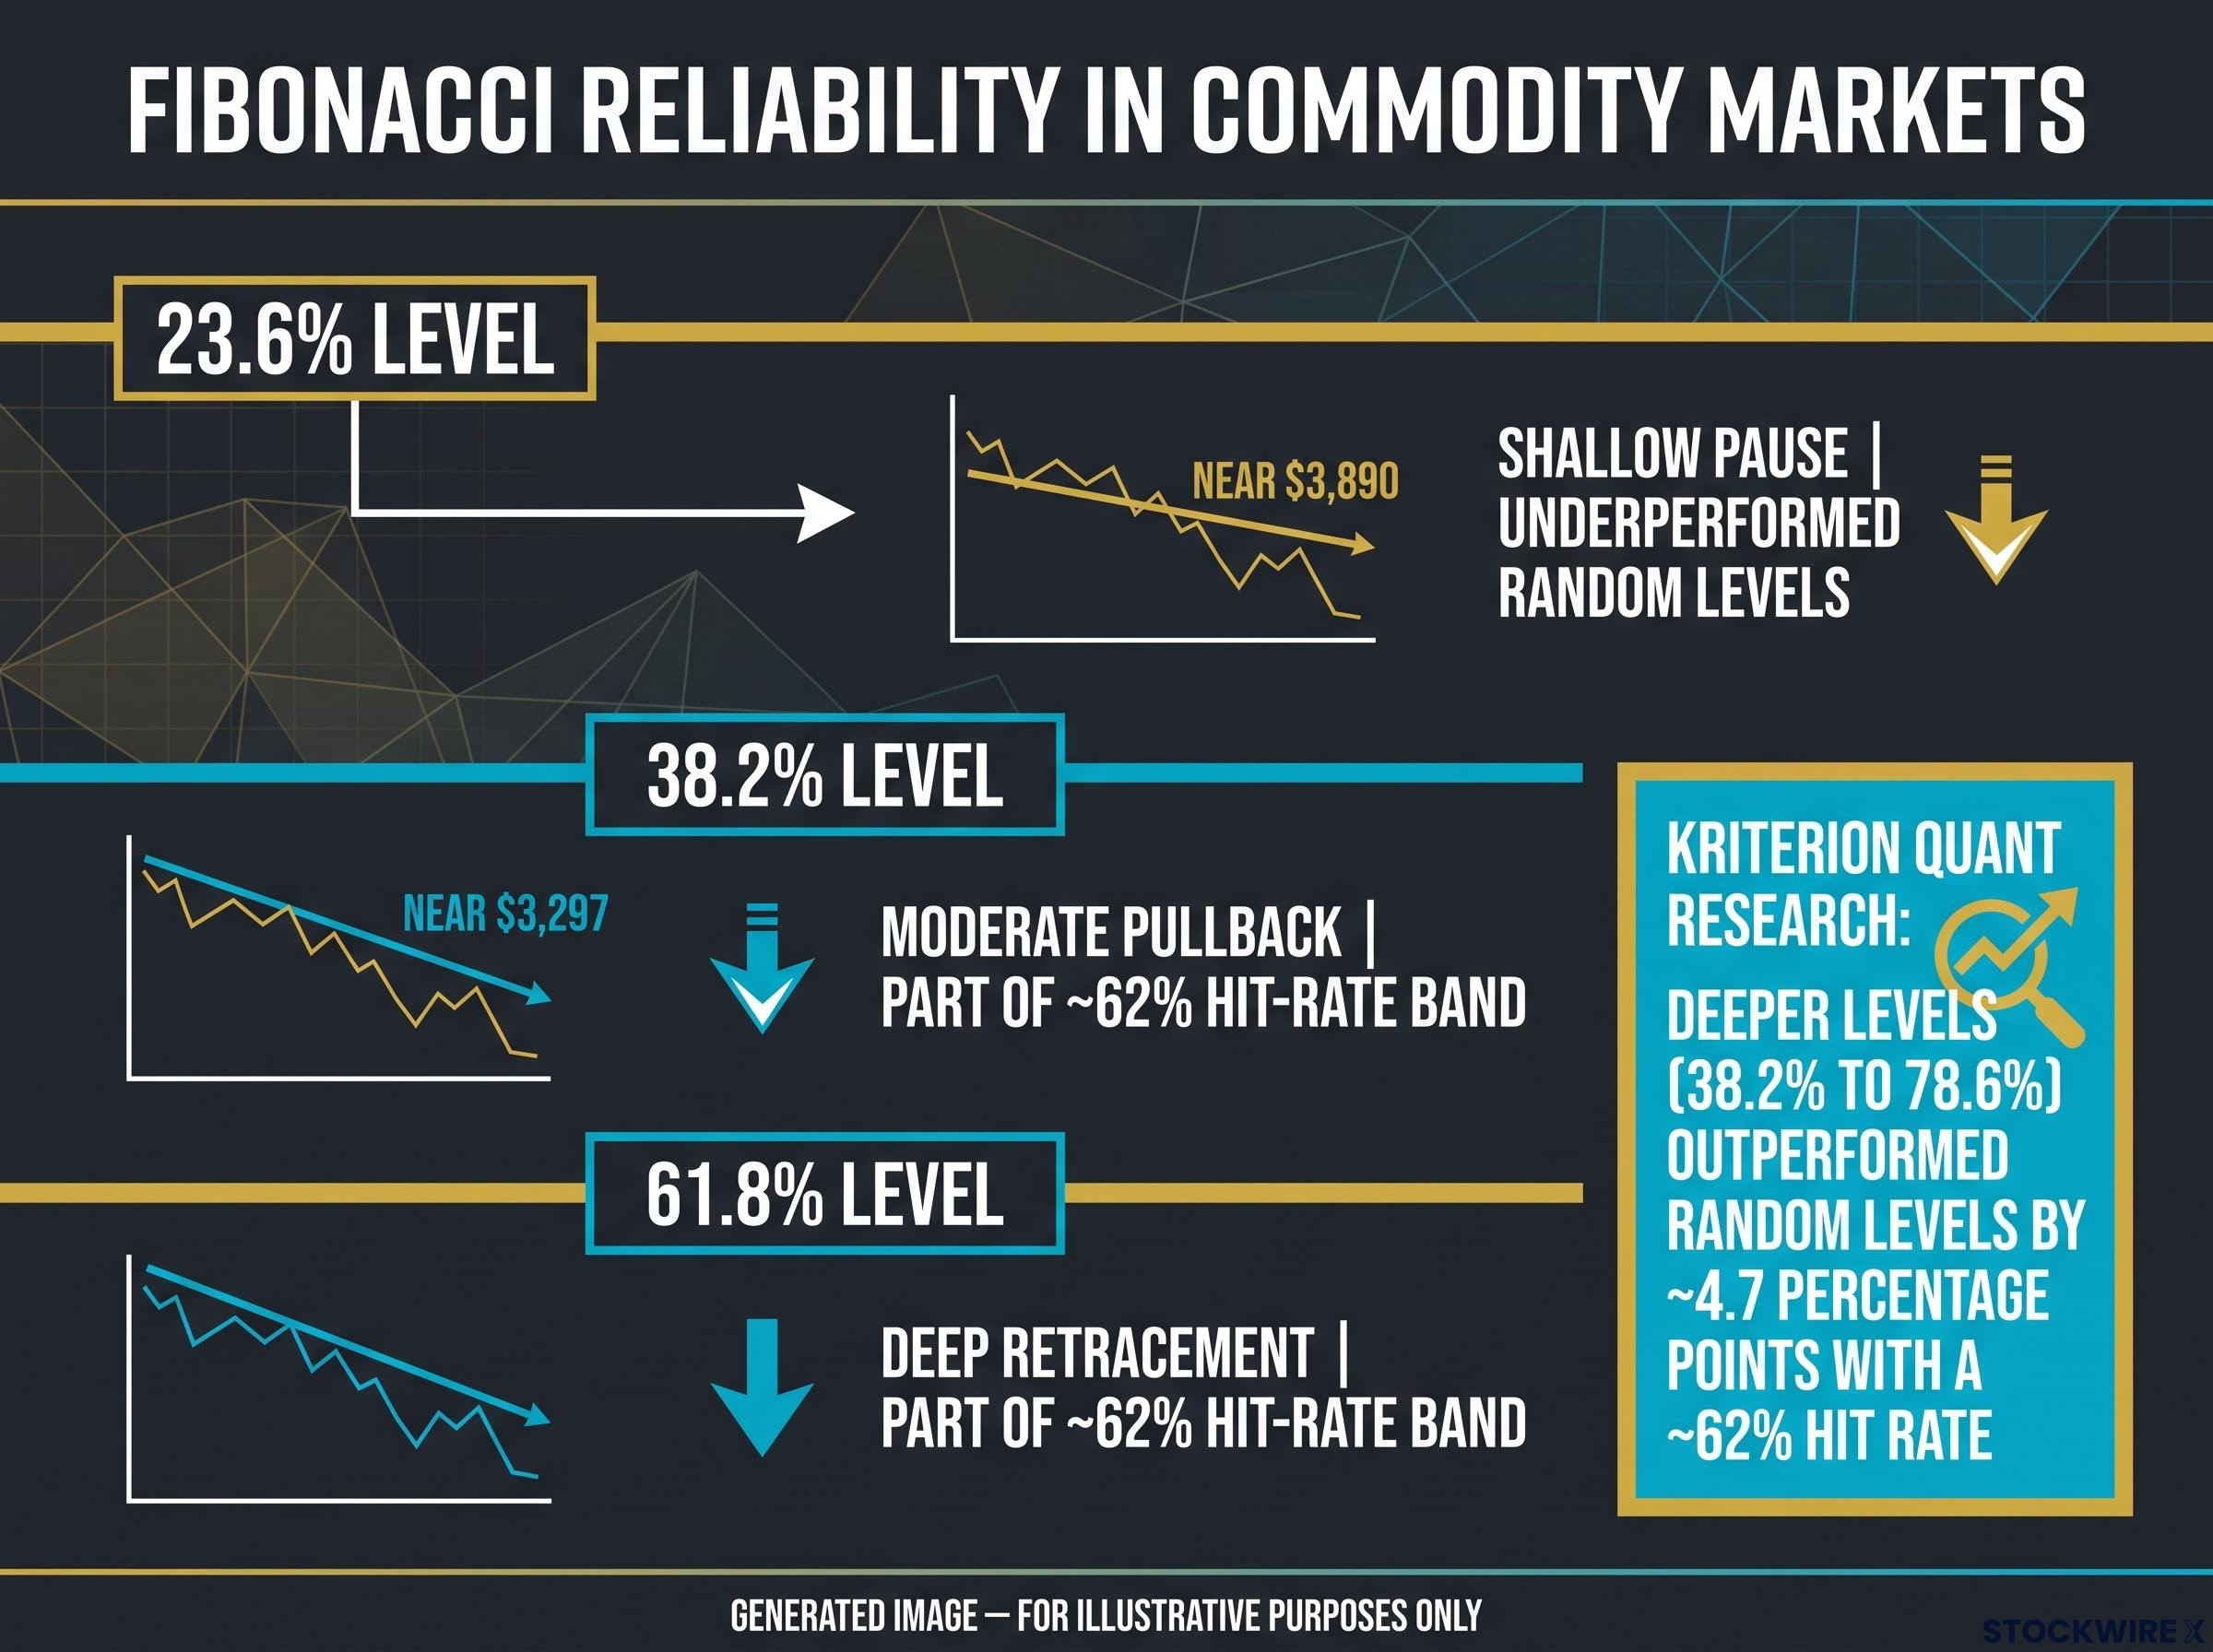
| Fibonacci level | Interpretation in commodity markets | Approx. gold price in 2025 cycle | Documented reliability |
|---|---|---|---|
| 23.6% | Shallow pause, prone to failure | Near $3,890 | Underperformed random levels |
| 38.2% | Moderate pullback, frequently tested and held | Around $3,297 | Part of ~62% hit-rate band |
| 61.8% | Deep retracement, often the last line before trend invalidation | Deeper correction zone | Part of ~62% hit-rate band |
What this changes for you is risk sizing. A bounce at the 23.6% level deserves scepticism. A hold at the 61.8% level is a qualitatively different signal, one worth acting on with more conviction.
September 2025: reading the signals in real time
Picture the chart at the start of September 2025. Gold is advancing from the $3,400 zone, the 50-day moving average has already been reclaimed, and Fibonacci extension targets in the $3,435 to $3,480 range provide a near-term roadmap. Nothing dramatic has happened yet. The structure is simply organised.
Then the compression starts to resolve. Through the preceding weeks, gold had formed an asymmetrical compression triangle, a sequence of lower highs pressing against a firmer floor. That shape tells you seller pressure is exhausting itself, not that buyers have suddenly taken command, and that distinction is why the eventual move proved durable rather than a spike that snapped straight back.
The sequence unfolded in a traceable order:
- The 50-day moving average reclaim on 5 August 2025 established the bullish short-term structure.
- The compression triangle formed through late summer as lower highs met firmer support, the earlier breakout above $3,384 aligning almost exactly with the 50-period simple moving average near $3,377.
- The breakout from the triangle triggered momentum acceleration in early September.
- The measured-move target sat in the $3,438 to $3,480 range as initially projected.
- Confirmation came later with the 20 October 2025 intraday high of $4,294, gold’s 50th all-time high of the year.
The early September sessions delivered roughly a 5% move, carrying spot gold to about $3,626 during the 9 September 2025 session. Across the full month, gold gained close to 10%, with peaks near $3,800 to $3,860 by late September. The chart had laid out the path, and price walked it.
There was a counter-signal worth respecting.
Analysts flagged reversal risk as the Relative Strength Index (a momentum gauge running from 0 to 100) climbed to 71, a reading generally considered overbought.
An overbought reading is a caution, not a stop sign. In strong trends, it often resolves through sideways drift rather than a sharp reversal, which is precisely what gold did. The lesson here is that technical analysis earns its keep not as a crystal ball, but as a way to confirm a move has real structural backing. That is what separates a tradeable trend from a noise-driven spike.
Why this correction looked different from 2011
Gold has had a bull market end badly before. After its 2011 peak near $1,895, support around $1,537 failed to hold, and prices were roughly halved over the following years as real yields rose and the dollar strengthened.
The behaviour in 2025 was the opposite. Dips into Fibonacci support generated swift recoveries; buyers stepped in rather than stepping back. In 2011, every bounce was sold aggressively. In 2025, every dip was bought.
The difference was not really the price levels. It was the behaviour at those levels. Structural macro demand, central bank buying and record ETF inflows, created a real bid sitting underneath the chart. That is why Fibonacci support held when it did. The technical levels worked because the fundamental buyers were genuinely there to defend them.
How to apply these frameworks when gold moves again
Watching a completed cycle is one thing. Reading a live one is another. The value of everything above is that it converts into a repeatable process you can run yourself the next time gold moves.
The process has three steps:
| Step | What to look for | What it signals | Common failure mode |
|---|---|---|---|
| 1. Identify the moving average trend | Is price above or below the 50-day moving average, and holding? | The dominant short-term trend direction | Liquidity sweeps briefly pierce the average before the trend resumes |
| 2. Map the Fibonacci grid | Retracement levels drawn from the most recent significant swing | Where pullbacks are likely to find support | Shallow 23.6% levels fail; deeper 61.8% tests often needed for durable lows |
| 3. Watch for pattern compression | Triangles, flags, tightening ranges near support | Seller exhaustion ahead of a potential breakout | False breakouts on overbought RSI resolving sideways, not sharply |
Address the failure modes head-on. Shallow 23.6% retracements fail often and frequently require a deeper test at the 61.8% level before a durable low forms. Overbought RSI readings in a strong trend usually work themselves off through consolidation rather than a violent reversal.
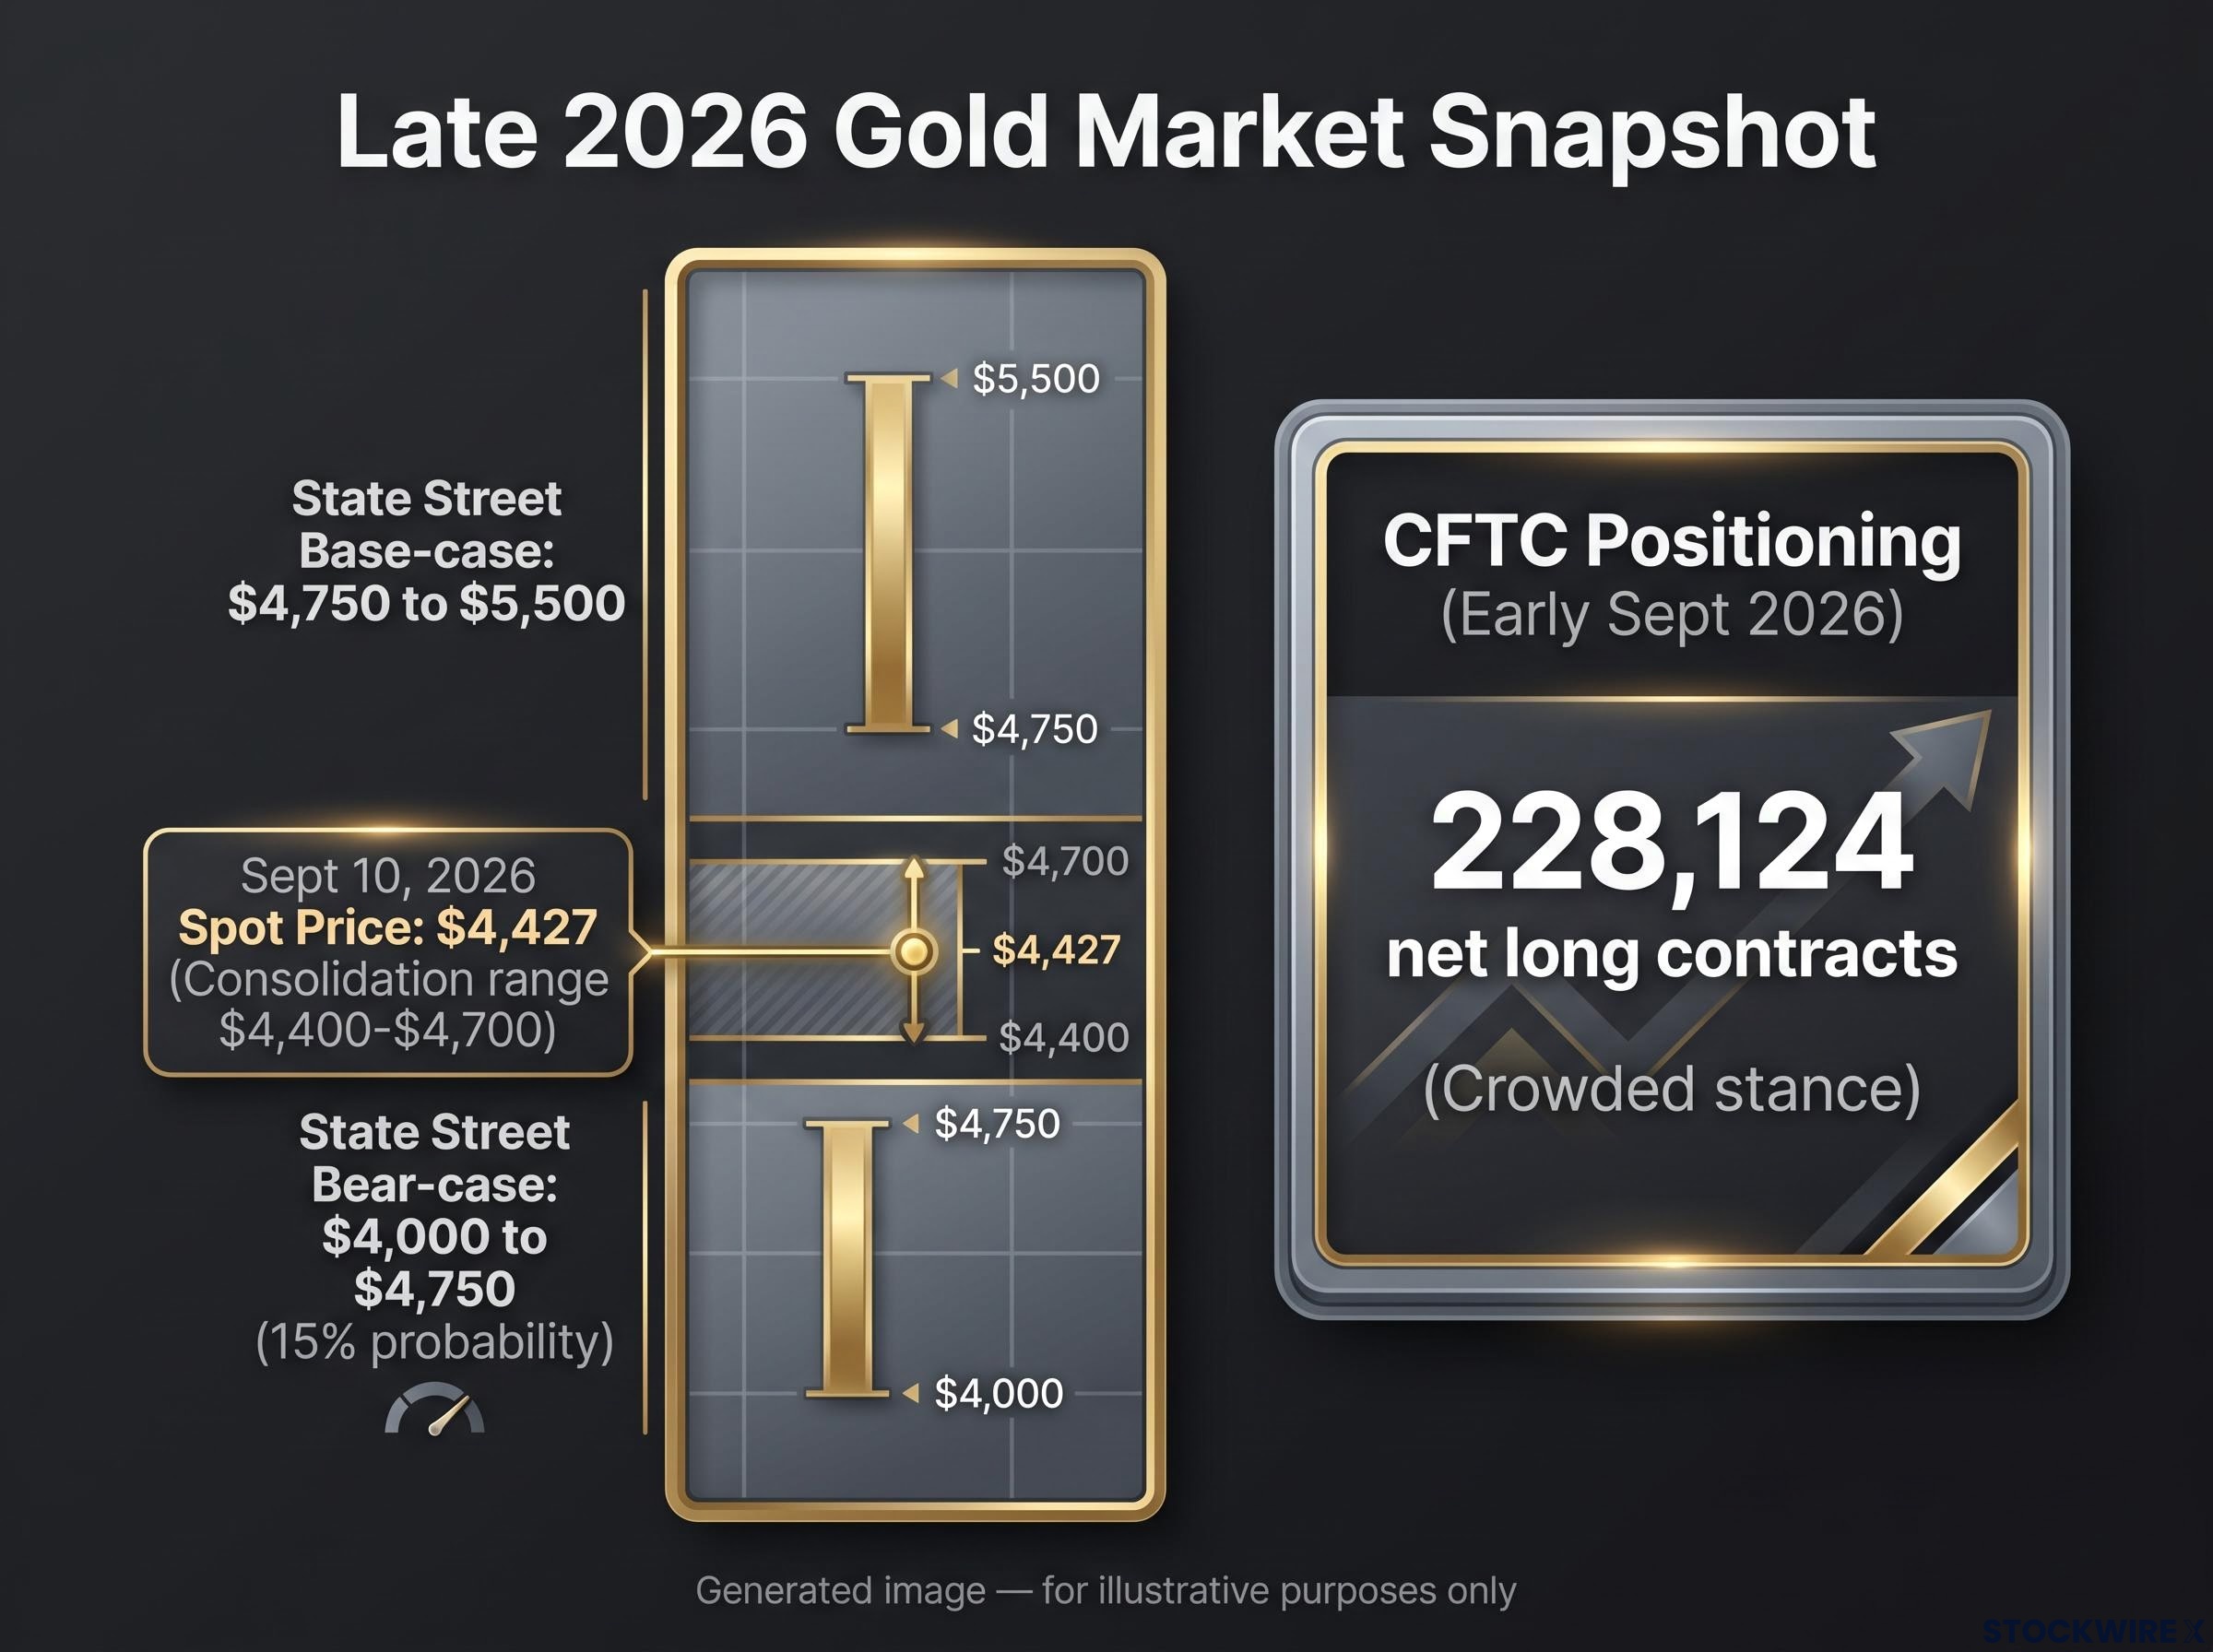
Now apply the framework to where gold actually sits today. As of mid-to-late 2026, gold is consolidating in the $4,400 to $4,700 range, with the most recently reported spot price at $4,427 on 10 September 2026. The open technical question is whether this sideways phase is base-building for the next leg or a topping formation, and the answer hinges on how price behaves at its key moving averages.
The positioning data adds an edge to that read. CFTC data from early September 2026 showed large speculators holding 228,124 net long contracts, a crowded stance. That crowding tells you the near-term risk is asymmetric to the downside: if a key moving average breaks convincingly, a large pool of speculative capital could accelerate the selloff before fundamental buyers step back in.
State Street Global Advisors assigned a 15% probability to a bear-case band of $4,000 to $4,750 per ounce by late 2026, conditional on gold failing to push past its prior peaks and settling into a lower-high structure. The base-case institutional range remains $4,750 to $5,500 for the rest of the year.
BofA’s bear-case framework, which identified five concurrent bearish signals in July 2026 including a death cross and an RSI reading of 90 last seen at the 1980 and 2011 secular peaks, set downside targets anchored to Fibonacci retracement mathematics: $3,702 at the 50% level and $3,315 as the full bear case derived from prior-advance drawdown history.
The bearish catalysts to keep on your radar are specific:
- A restrictive Federal Reserve response to persistent inflation, lifting real yields
- A stronger US dollar under a reflation scenario
- A speculative long unwind from that crowded net-long position
- A genuine easing of geopolitical tensions removing the safe-haven premium
This article is for informational purposes only and should not be considered financial advice. Investors should conduct their own research and consult with financial professionals before making investment decisions.
What the 2025-2026 cycle teaches about reading gold’s next move
The single most useful lesson from this cycle is that technical analysis behaves differently depending on the regime around it. In a structural bull market, macro support creates a real bid at chart levels that would otherwise break. Fibonacci support is not arbitrary when there is genuine buying waiting at those prices, which is exactly what separated 2025 from 2011.
Two variables will decide whether the current consolidation resolves upward or downward. First, whether the 50-day moving average holds as support through any further pullback. Second, whether that crowded speculative net long begins to normalise or grows even more crowded.
Watch these two things specifically:
- The 50-day moving average: does gold defend it on dips, the way it did in 2025, or lose it?
- CFTC net-long positioning: does the crowded speculative stance ease, reducing unwind risk, or intensify?
The structural evidence beneath the chart still looks intact. Global gold ETFs drew a record $89 billion in 2025, with North American funds absorbing $51 billion of that. Even through the 12% to 13% correction in March 2026, and the recovery back into the current range, those inflows show the structural buyers who drove this cycle have not left. They are waiting at lower levels, which is precisely what keeps Fibonacci support meaningful.
Gold ETF inflows can function as a leading indicator rather than a lagging confirmation: the 46.7-tonne single-week surge that preceded the move above $5,100 arrived before the chart breakout was technically confirmed, giving flow-aware investors a jump on the structure that technical setups formalised only later.
Gold’s definitive cycle peak: $5,589.38 per ounce on 28 January 2026, the reference point for any Fibonacci extension mapping from here.
The framework that flagged the September 2025 inflection is the same one that will read the $4,400 to $4,700 range next. Learning it now means you will not be starting from scratch when the next inflection arrives.
Past performance does not guarantee future results, and these forward-looking scenarios are speculative and subject to change based on market developments.