
An exchange-traded fund that has compounded at roughly 18.9% per year since 2016, against an S&P/ASX 200 returning around 9% over the same stretch, is not a rounding error. It is a structural argument about where money flows when spending stops being optional.
Since the BetaShares Global Cybersecurity ETF (HACK) listed on the ASX on 30 August 2016, it has converted a focused thesis about non-discretionary cyber spending into one of the more striking thematic outperformance records in Australian ETF history. With funds under management now estimated between $1.46 billion and $1.54 billion, and the sector accelerating into an AI-driven arms race, the question has shifted.
The question is no longer whether HACK has performed. It is whether that record is a forward signal or a backward one. This piece lays out what actually drove the decade of outperformance, what structural and valuation risks now complicate the picture, and what a disciplined Australian investor should do with that information before committing capital.
A decade of outperformance: what the numbers actually show
Start with the return itself, because everything else in this analysis is a response to it.
From inception on 30 August 2016 through 31 August 2026, HACK delivered an annualised total return of approximately 18.9%, according to the fund’s performance record. BetaShares representative Hugh Lam has cited a slightly more conservative 17.88% per annum since inception. Either figure sits at roughly double the 9% annualised return (including dividends) delivered by the S&P/ASX 200 over the preceding decade.
| Metric (inception to 31 Aug 2026) | HACK | S&P/ASX 200 | Outperformance gap |
|---|---|---|---|
| Annualised total return | ~18.9% p.a. | ~9% p.a. | ~9.9 percentage points p.a. |
A near-doubling of the benchmark’s annualised return, sustained over a full ten years, is the kind of gap that compounds into something the market cannot ignore. And the flows confirm it noticed.
HACK crossed $1 billion in funds under management in December 2024, a milestone BetaShares confirmed on 13 December 2024. Third-party data platforms now estimate the fund’s FUM at between $1.46 billion and $1.54 billion as of August to September 2026. That trajectory signals sustained conviction from both institutional and retail investors, not a short-lived flow surge chasing a hot chart.
Since inception, HACK has generated in excess of $800 million in total value for its shareholders.
That dollar figure grounds the percentage. It is the difference between an abstract return statistic and real capital delivered to Australian portfolios.
One caveat belongs in the same breath as the outperformance. The fund carries a management expense ratio of 0.67% per annum, comprising a 0.57% management fee and 0.10% in estimated expenses, per the June 2026 factsheet. That cost compounds against the gross return every year, so the net figure landing in an investor’s account is lower than the headline. What the record tells you is that the gross outperformance has been large enough to absorb that drag comfortably, but it is a variable that matters more, not less, as expected forward returns compress.
When big ASX news breaks, our subscribers know first
What drives the returns: structural tailwinds inside the portfolio
A return number that large invites an obvious question. Is this a mechanism or a coincidence? The portfolio answers it.
What the fund holds
HACK tracks the Nasdaq CTA Cybersecurity Index, which is overwhelmingly tilted toward US large-cap vendors across software, network, and cloud security rather than broad sector diversification. This is a concentrated bet on the companies building the defensive infrastructure enterprises depend on.
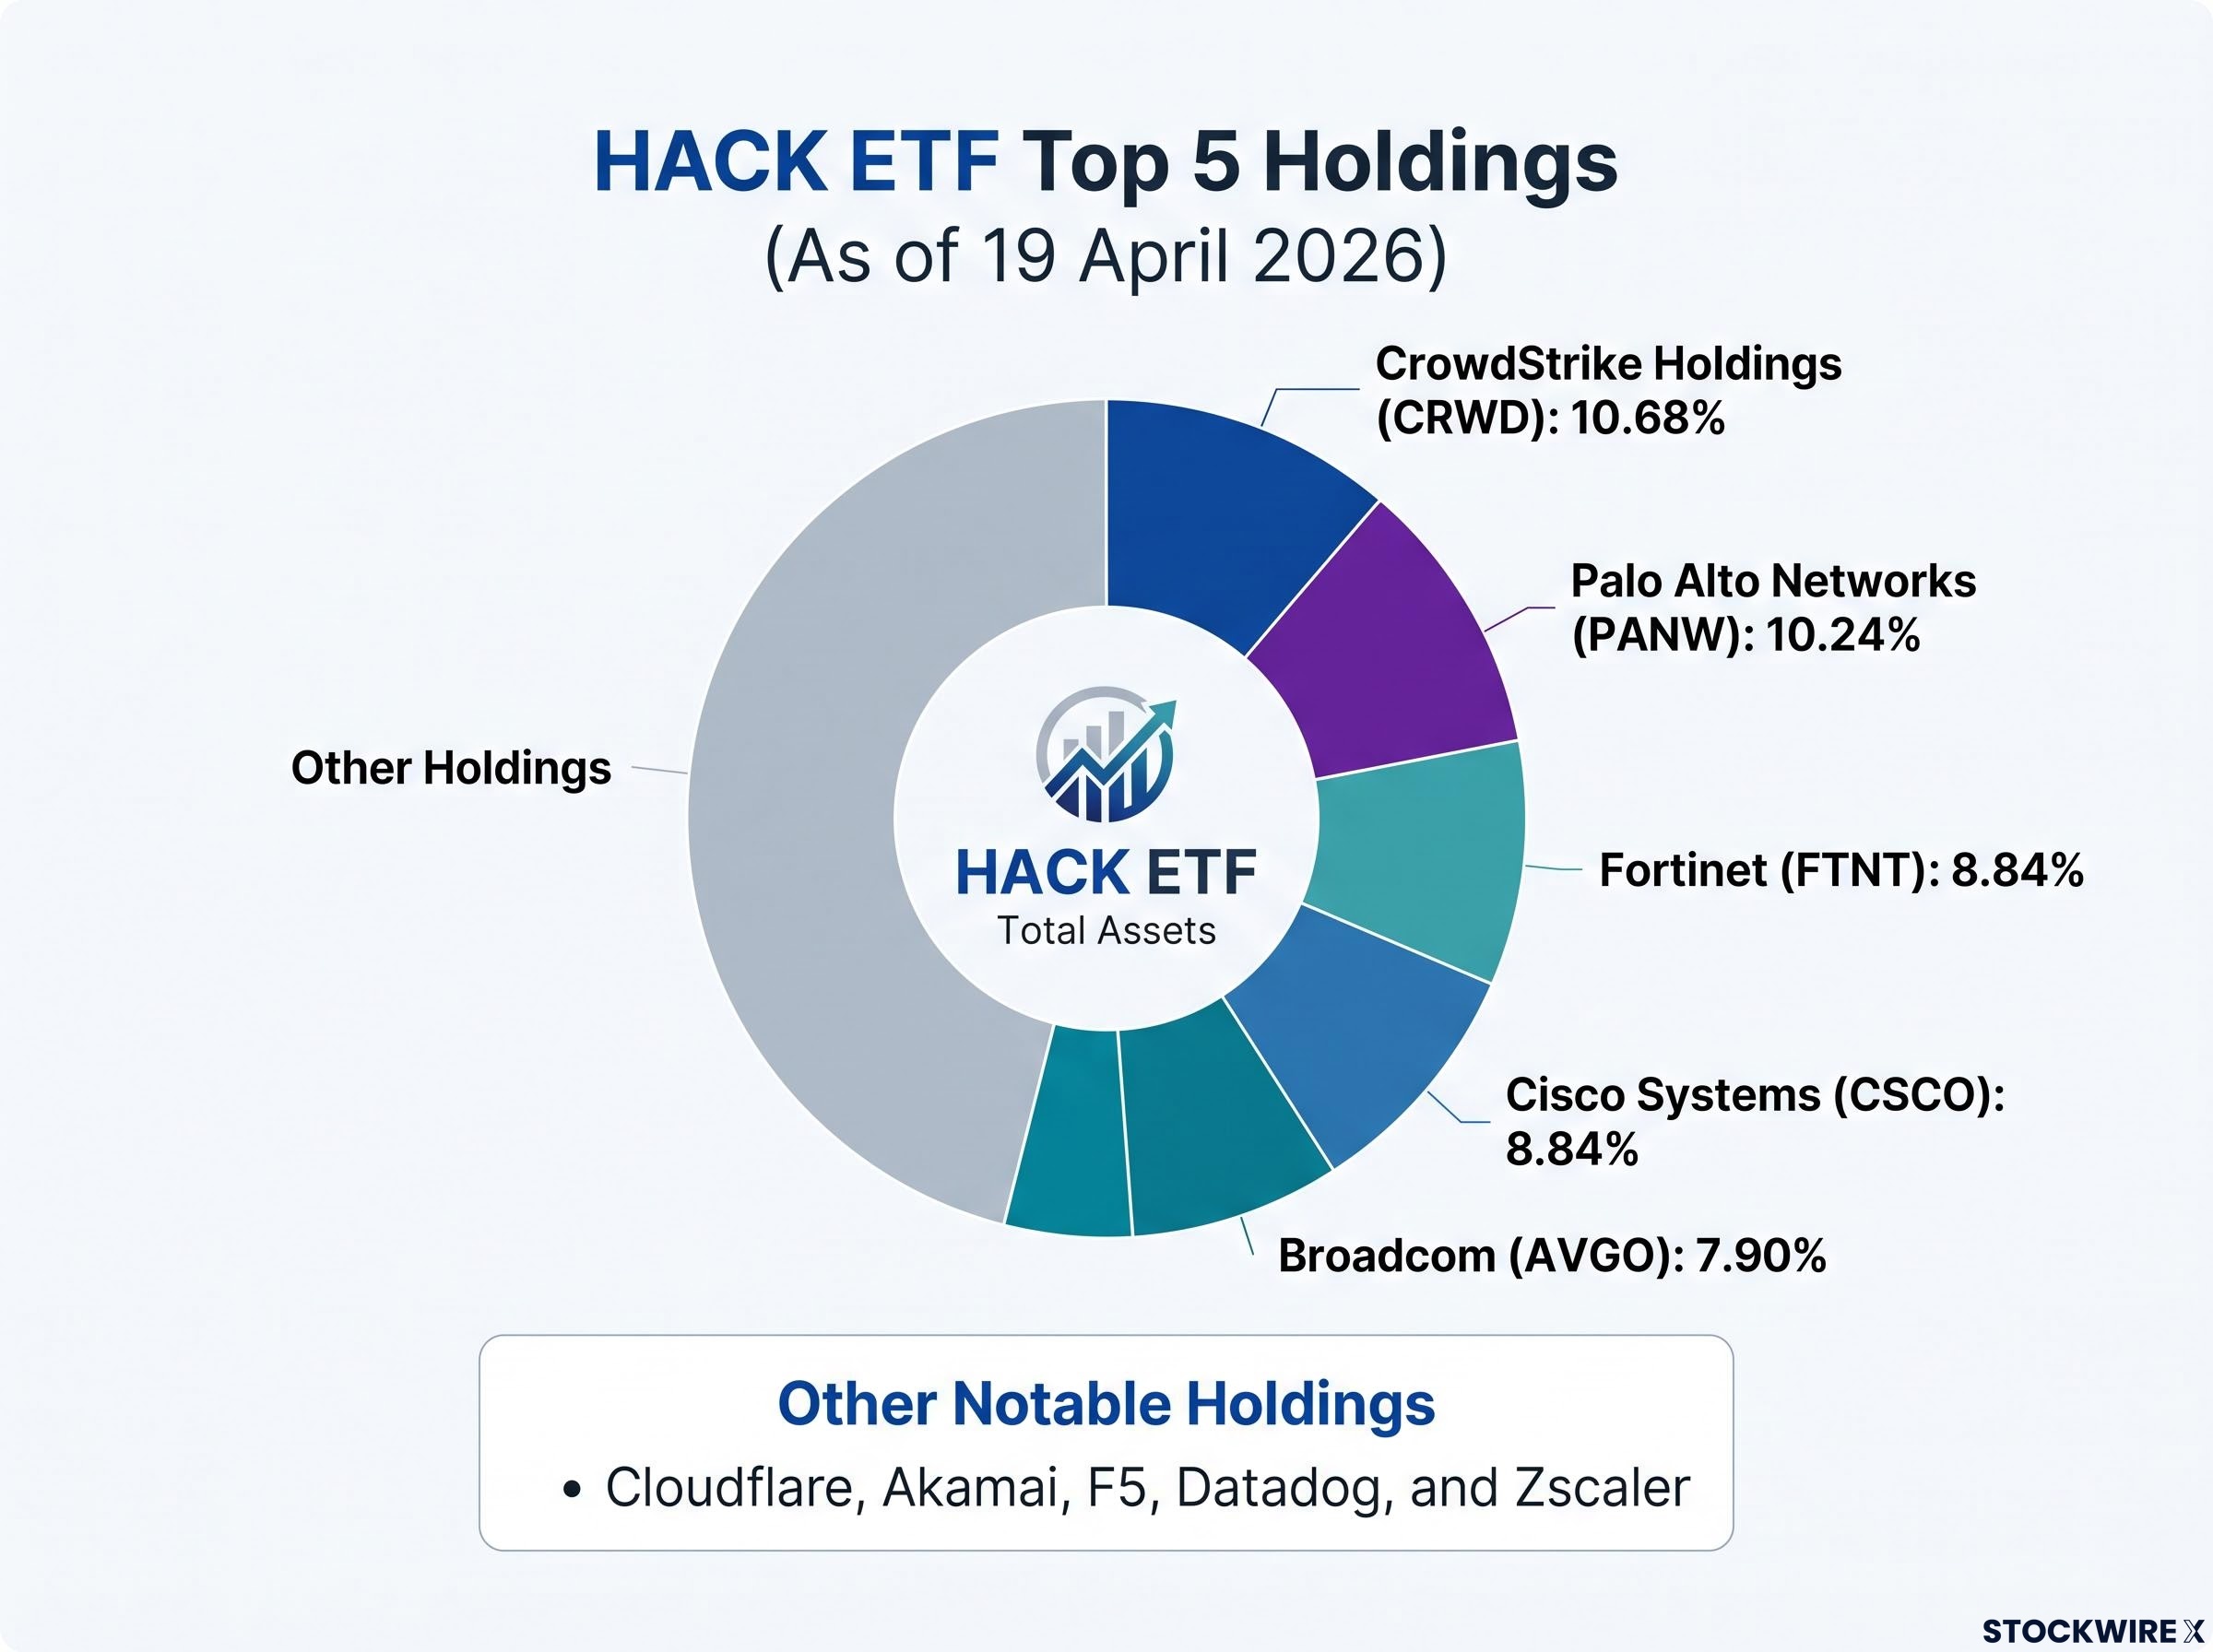
As of 19 April 2026, the top five holdings were:
- CrowdStrike Holdings (CRWD): 10.68%
- Palo Alto Networks (PANW): 10.24%
- Fortinet (FTNT): 8.84%
- Cisco Systems (CSCO): 8.84%
- Broadcom (AVGO): 7.90%
Below those sit Cloudflare, Akamai, F5, Datadog, and Zscaler, extending the exposure across endpoint protection, secure access, and cloud monitoring. The common thread is that these companies sell products enterprises struggle to switch off.
Why the spending keeps growing
The returns trace back to three distinct forces, each operating on a different lever.
- Non-discretionary demand. Cybersecurity has moved from a discretionary IT line item to essential infrastructure spending, generally the last budget cut across an economic cycle. Global spending forecasts confirm the momentum: Forrester projected a 13.1% rise to US$174.8 billion in 2025, Gartner anticipated end-user security spend reaching US$213 billion, and Cybersecurity Ventures put the broader market at US$454 billion.
- AI-driven threat escalation. The threat side is deteriorating fast. Black Kite reported a 24% increase in disclosed ransomware victims (6,046) across 2025, while GuidePoint Security logged a 58% year-on-year jump to 7,515 victims. By late August 2026, Morningstar analysts observed cybersecurity stocks repositioning from “AI losers” to “AI winners” as enterprises accelerated defensive spending in an arms-race dynamic against increasingly capable AI-driven attacks.
AI-driven threat escalation is not a linear extrapolation of past attack volumes: Palo Alto Networks’ internal AI scan compressed five to seven years of conventional vulnerability discovery into six weeks, setting a new baseline for enterprise exposure that makes the demand case for HACK’s top holdings structurally different from what it was at the fund’s inception.
- Regulatory uplift. On 16 June 2026, the Australian Government enacted the Enhanced CIRMP Rules under the Security of Critical Infrastructure (SOCI) Act. These mandate compliance with recognised frameworks such as ISO/IEC 27001:2023, the ASD Essential Eight at Maturity Level 2, or NIST CSF 2.0 across nine critical asset classes, with 12- and 24-month grace periods.
Here is what that combination tells you. The revenue pipeline for HACK’s core holdings is being driven by demand that is contractually mandated, threat-amplified, and cycle-resistant all at once. That is a qualitatively different basis for expected returns than a thematic bet riding sentiment, and it is why the outperformance reads as earned rather than accidental.
The risks that the performance record does not advertise
The mechanism cuts both ways. The same concentration that produced the upside is precisely what builds the downside, and that is not an abstract warning.
Concentration is the starting point. Thematic funds frequently hold 40-60% of assets in their top 10 positions, against 20-25% for broad global indices like the MSCI World. When a portfolio is that top-heavy, a single-company stumble propagates through the net asset value at scale rather than being diluted away.
The volatility that follows is documented across comparable funds, not hypothetical.
| Fund | Standout up-year | Worst single year | Multi-year annualised |
|---|---|---|---|
| Global X Cybersecurity (BUG) | +71.17% (2020) | -33.68% (2022) | 10.03% (5yr to Dec 2024) |
| ARK Innovation (ARKK) | Peak 2020/2021 | ~-54% peak-to-trough | Sentiment broken; US$840M outflows YTD Jun 2025 |
| BetaShares ATEC (ASX tech) | Not applicable | -24.58% (1yr to Jun 2026) | 1.02% (5yr NAV to Jun 2026) |
The ARKK story is the sharpest caution: a roughly 54% decline from its 2020/2021 peak, and even a 50% rebound by June 2025 could not stop US$840 million in year-to-date outflows. Broken sentiment lingers longer than broken prices.
The thematic ETF behaviour gap, where reported time-weighted returns diverge sharply from the money-weighted returns investors actually experience, is what turns a strong fund record into a poor investor outcome.
The ATEC example is the one that should land hardest for an Australian investor. It is an ASX-listed thematic ETF with a plausible structural logic, and it still delivered a five-year annualised NAV return of just 1.02% through June 2026, alongside a one-year loss of -24.58%. Concentration and a credible theme do not guarantee growth.
Then there is the survivorship problem that sits underneath the whole category.
Over 60% of thematic equity funds launched in the prior 15 years have ultimately shut down.
Morningstar’s Global Thematic Fund Landscape Report documents the 15-year survival and performance record across the thematic ETF category, providing the independent data underpinning the closure rate and volatility figures cited here.
Thematic ETFs are frequently launched late in bull markets, following exceptional backtested returns, which sets up post-launch mean reversion as stretched valuations return to earth. Nearly nine in ten thematic funds have shown higher standard deviation than the broad global equity market over a five-year period. The read you should take from this is uncomfortable but useful: HACK’s outperformance is structurally bound to the same concentration that makes its drawdowns severe when sentiment turns. Sizing the position, not admiring the return, is where discipline lives.
Where HACK fits in an Australian investor’s portfolio
The tension resolves into a proportioning question, not a yes-or-no one. The tool for that is the core-satellite framework.
The core-satellite framework works in practice only when the satellite sleeve is defined before a theme becomes compelling, because the discipline of pre-committing a maximum allocation is what stops a strong thesis from becoming an oversized position during a bull run.
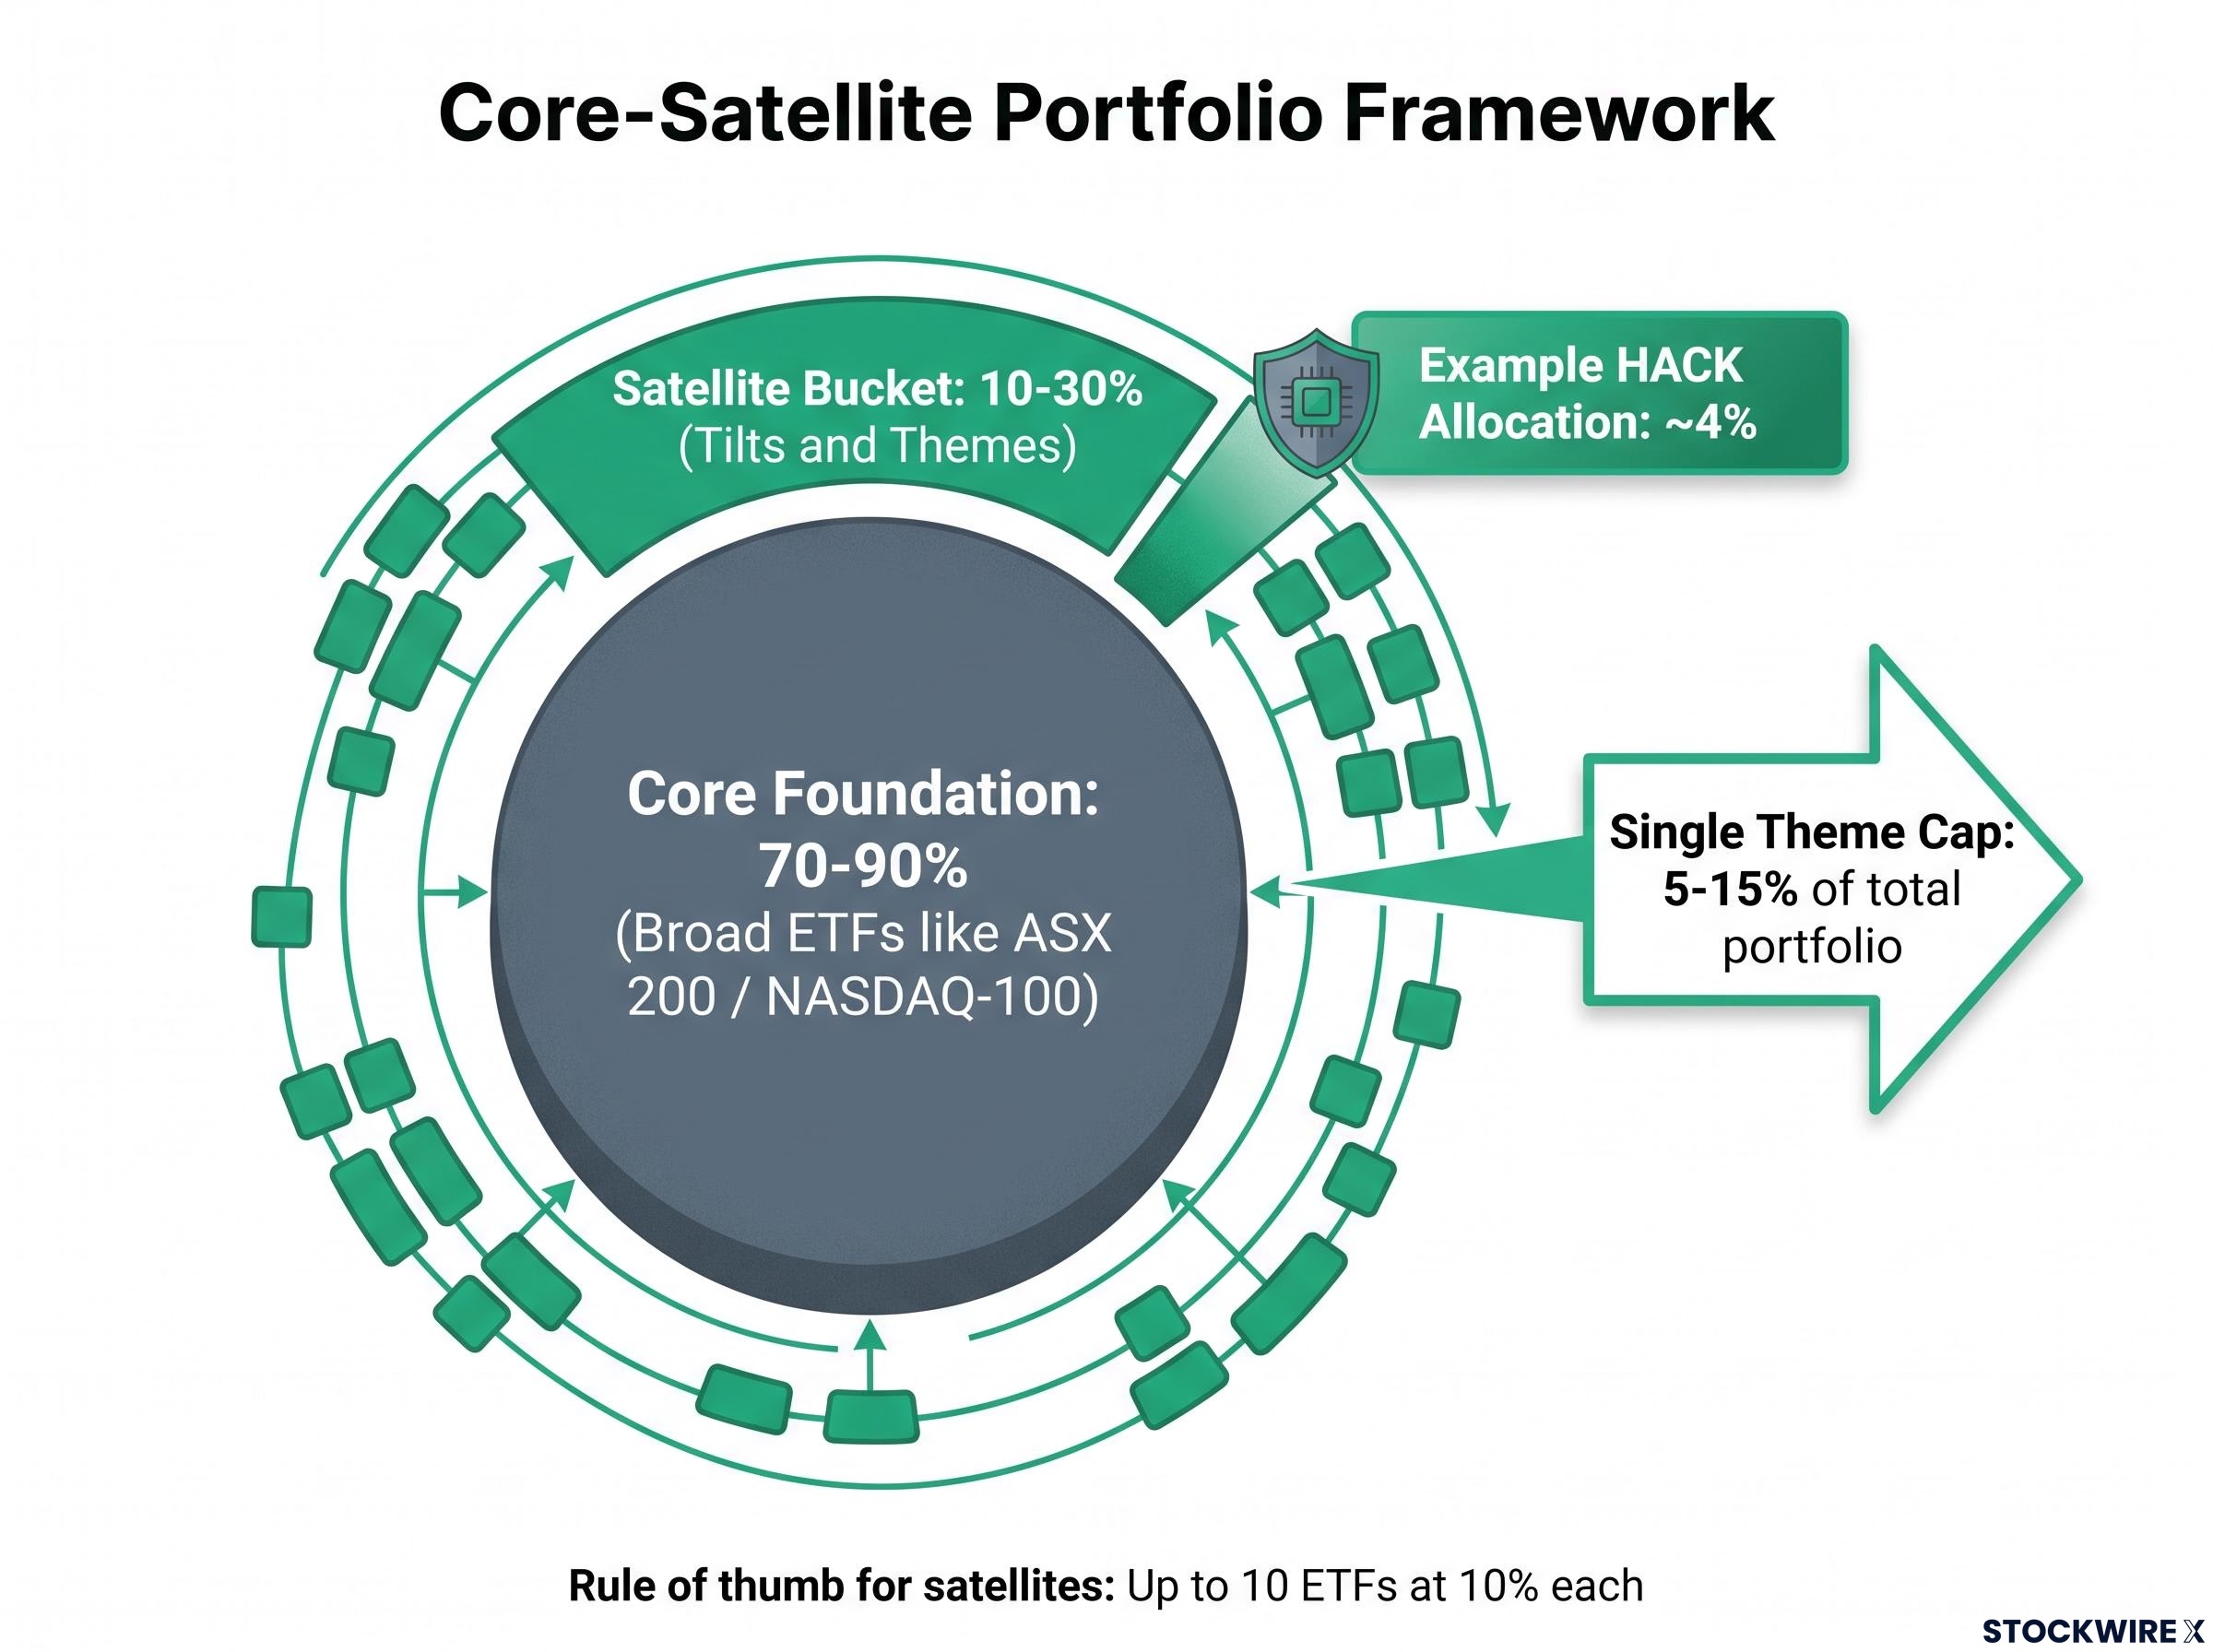
The structure is straightforward. Broad, low-cost ETFs tracking the ASX 200 or a NASDAQ-100 equivalent form 70-90% of the portfolio, the foundation. The remaining 10-30% sits in a satellite bucket for tilts and themes. Within that bucket, exposure to any single theme should be capped at 5-15% of the total portfolio.
Run the numbers through a practical model and HACK lands modestly.
Example model portfolios size a thematic ETF like HACK at approximately 4% of the total portfolio, a meaningful tilt rather than a primary growth engine.
For a typical Australian investor with a diversified superannuation base and a self-managed growth portfolio, a 4-5% allocation captures the cybersecurity secular trend without exposing the whole portfolio to the drawdown risk that concentration creates. A useful rule of thumb for the satellite portion is up to 10 ETFs at 10% each, which keeps any one theme from dominating.
The framework only works if the behaviour behind it is disciplined. Four rules turn it from theory into practice.
- Write down your allocation rules before you invest. Deciding the maximum position while the chart looks good is how discipline survives a drawdown.
- Limit the number of thematic satellites you hold. Every thematic ETF is an active bet, and too many bets dilute the reasoning behind each.
- Rebalance annually rather than reacting to price. A scheduled review removes the temptation to sell into fear or chase a rally.
- Dollar-cost average over 12 to 24 months. Spreading the entry reduces the risk of buying a concentrated theme at peak valuation.
What this framework gives you is not a verdict on whether HACK is good. It is a method for holding it. An investor who finishes here knows how much of their portfolio should carry this exposure and how to manage it through the volatility that concentration guarantees.
What the next decade requires HACK to get right
The record is settled. What matters now is the forward view, and that depends on conditions the fund has not yet met.
The variables that will define the next chapter
Three variables will determine whether the structural case sustains into the next decade.
- Enterprise spending resilience: whether cyber budgets keep growing through any macro softness, given their non-discretionary status is the entire thesis.
- Pricing power: whether HACK’s top holdings can defend margins as competition intensifies within a crowded sector.
- The AI dynamic: whether AI-driven threats keep amplifying demand, or whether AI eventually commoditises defensive tooling and compresses vendor economics.
The most recent evidence points the right way. The Morningstar repositioning of cybersecurity from “AI losers” to “AI winners” in late August 2026 suggests the structural case is still strengthening, and Australia’s SOCI Act Enhanced CIRMP Rules, enacted 16 June 2026 with a 12- to 24-month implementation runway, add a domestic demand tailwind that did not exist at inception.
For investors wanting to assess how durable the AI arms-race tailwind actually is, our full explainer on AI cybersecurity pre-disclosure dynamics covers Mandiant’s finding that mean exploit time has fallen to roughly negative seven days, alongside Gartner’s 73.9% CAGR projection for the AI security market.
The disciplined investor’s position
The honest conclusion holds two ideas at once. The structural case for HACK is stronger in September 2026 than it was at inception, but a stronger structural case and a higher expected return are not the same thing, because valuations have moved a long way over the decade.
No performance record eliminates mean-reversion risk, and the 0.67% MER compounds as a drag against whatever forward return the thesis delivers. An investor who treats the 18.9% annualised return as a baseline expectation is making a category error.
The defensible position is the sized one. The tailwinds are real, the Australian regulatory base is strengthening, and a proportioned, rebalanced satellite allocation is a rational response to a strong but uncertain thesis. That is what lets an investor hold through volatility with conviction rather than selling at the wrong moment or doubling down without cause.
This article is for informational purposes only and should not be considered financial advice. Investors should conduct their own research and consult with financial professionals before making investment decisions.
Past performance does not guarantee future results. Financial projections are subject to market conditions and various risk factors, and forward-looking statements about the sector remain speculative and subject to change based on market developments.