Memory chip stocks have always carried a reputation as commodity plays, prone to violent boom-and-bust swings that punish anyone who buys at the top. That reputation is being tested right now by Micron Technology (MU), whose shares have climbed more than 10x since April 2025 while its production costs, measured by cost of goods sold, have risen only around 25%, according to DA Davidson.
That gap between price and production cost is the entire debate. It suggests either a permanent structural re-rating of how memory profits are valued, or the most extended cyclical peak in the sector’s history. With Micron trading near $1,000 in early September 2026 and its Q4 earnings report approaching as the next catalyst, that question is about to be answered with real money.
Here is what makes the current setup unusual: Wall Street price targets and the technical chart pattern are pointing toward the same breakout levels. This analysis lays out a layered framework for evaluating whether the setup justifies a long position, separating genuine structural AI demand from temporary hype, so you can weigh the trade with clear eyes before the numbers land.
How Wall Street upgrades build the case for a breakout
Near-unanimous buy ratings are rare in any market, and rarer still on a stock that has already run this hard. Micron has one anyway.
As of September 2026, 45 of 49 analysts rate the stock a Buy or Strong Buy, with four Holds and zero Sell ratings, according to aggregated coverage from StockRank and Yahoo Finance. The consensus 12-month price target clusters tightly between $1,300 and $1,513, comfortably above the prior all-time high of $1,255.
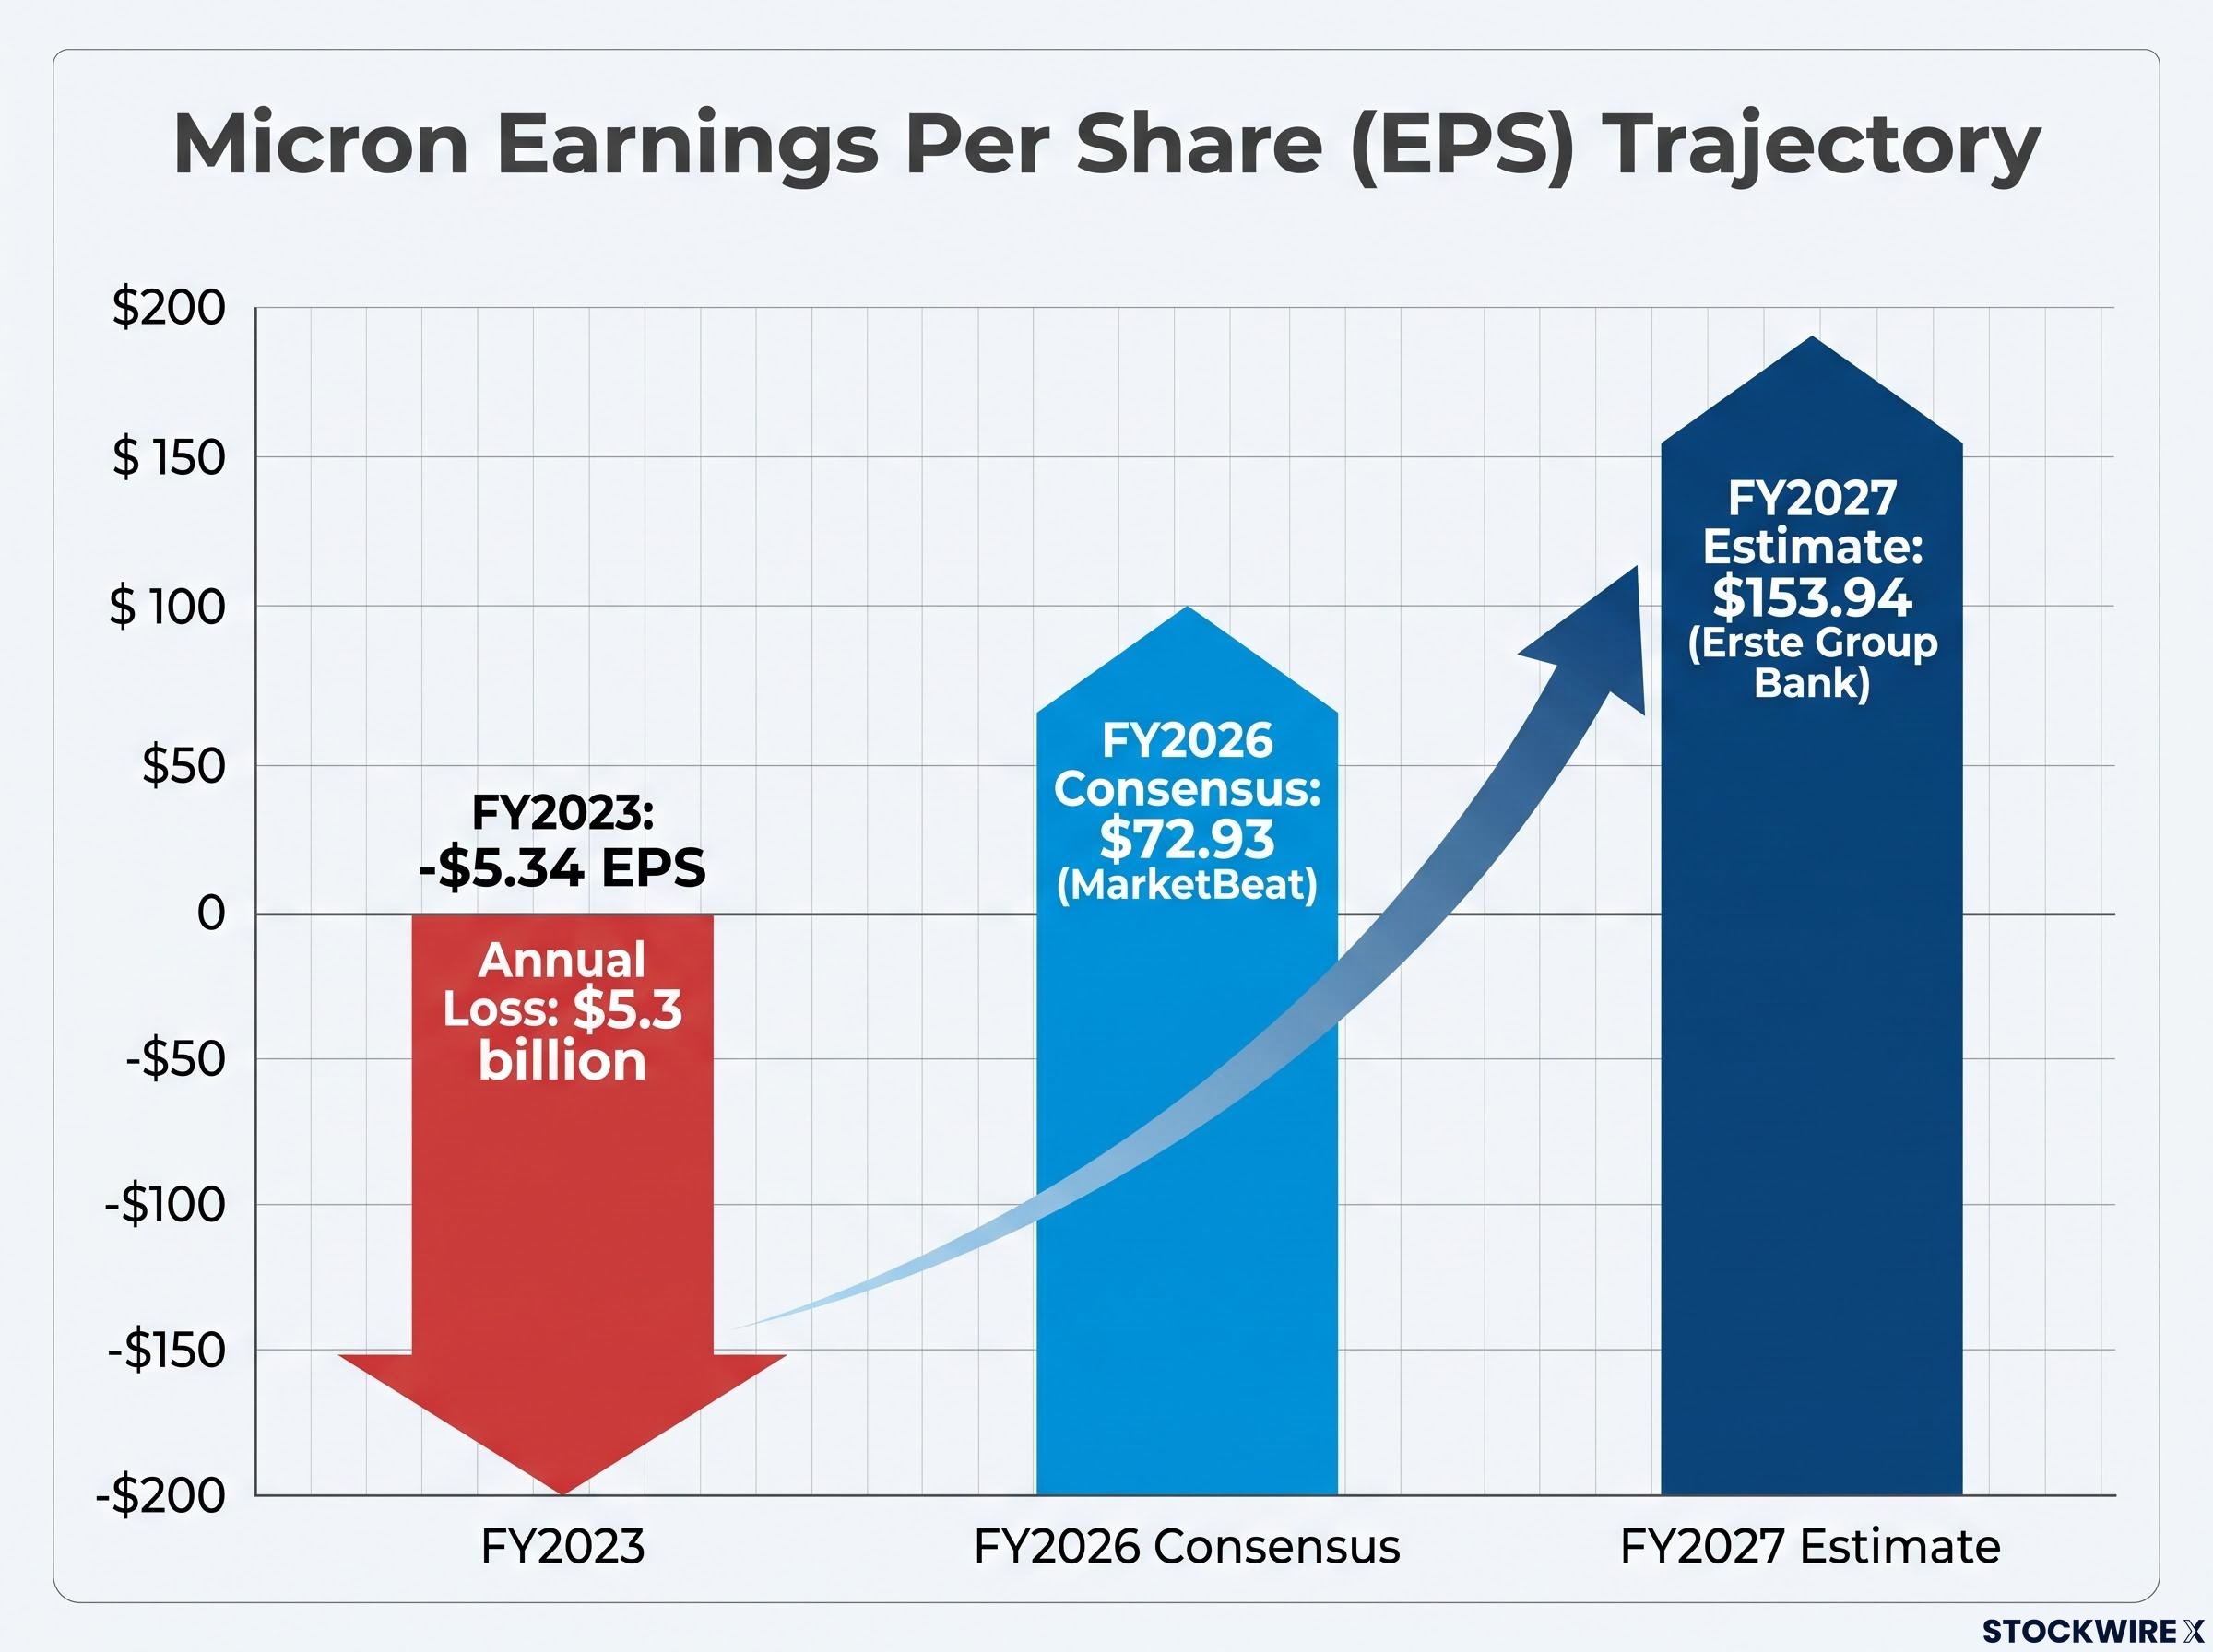
What matters more than the ratings is the earnings math underneath them. Micron’s earnings per share (EPS) trajectory has been revised from a trough of -$5.34 in FY2023, a year when the company posted a $5.3 billion annual loss, to a consensus estimate near $72.93 for FY2026, per MarketBeat. FY2027 estimates run higher still, with Erste Group Bank initiating coverage at $153.94.
Micron’s Q3 earnings provided the clearest public validation of this pricing regime: revenue of $36.85 billion against a $9.30 billion prior-year comparable, adjusted EPS of $25.11 against a $20.49 consensus, and Q4 guidance of approximately $50 billion that sat nearly $7 billion above Wall Street estimates, the largest guidance surprise in the company’s recent history.
The clustering of institutional targets tells you this is a coordinated re-rating, not a single outlier call.
| Institution | Rating | Price Target |
|---|---|---|
| Citigroup | Buy | $1,200 |
| Bank of America | Buy | $1,550 |
| Bernstein | Buy | $1,300 |
| DA Davidson | Buy | $1,000 |
Citigroup’s path is especially telling. Atif Malik lifted his target from $425 to $840 on 20 May 2026, then to $1,200 on 22 June 2026, a doubling in roughly a month. Bank of America’s Vivek Arya held a $1,550 target in August, and J. Safra Sarasin initiated at $1,500 on 2 September 2026.
The sheer volume of upward EPS revisions tells your portfolio that institutions are pricing in permanent changes to Micron’s profitability, not a one-quarter spike. The question you have to answer is whether the market has already fully digested these new baselines, or whether there is room left before the numbers become consensus.
When big ASX news breaks, our subscribers know first
Understanding the high-bandwidth memory supercycle
Memory investing has burned patient holders before. The sector’s history is a graveyard of up-cycles that looked structural right up until demand collapsed and prices cratered. So the reasonable starting question is why this cycle should be any different.
The current memory chip supercycle differs from prior DRAM upcycles in one structural respect: hyperscaler capex projected at $725 billion in 2026 has made data centre operators the dominant demand centre for the entire memory industry, a demand base with no analog in the commodity cycles that produced Micron’s $5.3 billion loss three years ago.
The answer sits in one product category: High-Bandwidth Memory (HBM), which is stacked memory built specifically to feed the data-hungry graphics processors that run artificial intelligence workloads. HBM is the critical bottleneck for AI infrastructure, and unlike commodity memory sold on volatile spot markets, it is increasingly sold on long-term agreements.
Contract pricing across the broader memory market shows the pressure. TrendForce projected Q2 2026 DRAM contract prices to rise 58-63% quarter-over-quarter, with NAND flash jumping 70-75%, before the pace moderated to 10-18% in Q3 as absolute price levels reset higher.
The shift to long-term contracts
Here is the mechanic that changes the risk profile. Micron’s entire 2026 HBM output is sold out under long-term contracts, according to management commentary reiterated across multiple analyses.
Because that capacity is already spoken for, your forward revenue visibility is unusually clear for a memory stock. You can model downside risk with more confidence than the sector’s history would normally allow, since a large slice of next year’s revenue is contractually locked rather than exposed to a spot-price collapse.
Micron’s competitive position within this oligopoly is improving, though it remains the smallest of three players. Counterpoint Research placed SK hynix at 50% of the HBM market in Q2 2026, Samsung at 33%, and Micron at 18%. Micron’s edge is efficiency: a Forbes report notes the company claims its HBM3E consumes roughly 30% less power than competing designs, a meaningful metric for the dense, power-constrained server clusters that AI operators are building.
Funding this ramp is not cheap.
Micron’s capital expenditures are expected to exceed $25 billion in FY2026, and to increase further in FY2027, to fund simultaneous fab ramps across the United States, Japan, and Singapore, according to TechMarketBriefs.
That spending is the tell. Companies do not commit that scale of capital to what they believe is a temporary spike, which is precisely why the structural-versus-cyclical debate matters so much for your holding period.
Tracking the inverse head and shoulders setup
Fundamentals tell you what to buy. The chart tells you when. For Micron, the two are lining up in a way that gives you a specific trigger to watch.
Technical analysts have described Micron’s mid-to-late 2026 chart as building an inverse head-and-shoulders pattern, a formation that typically signals a reversal from a downtrend into a new advance. It is made of three troughs: a left shoulder, a deeper low in the middle called the head, and a higher low on the right shoulder, all sitting beneath a horizontal resistance line called the neckline.
The specific levels give the pattern its shape:
- Left shoulder: near $804
- Head (the absolute bottom): $737.88
- Right shoulder (the higher low): around $887
- Neckline resistance: approximately $1,036.13
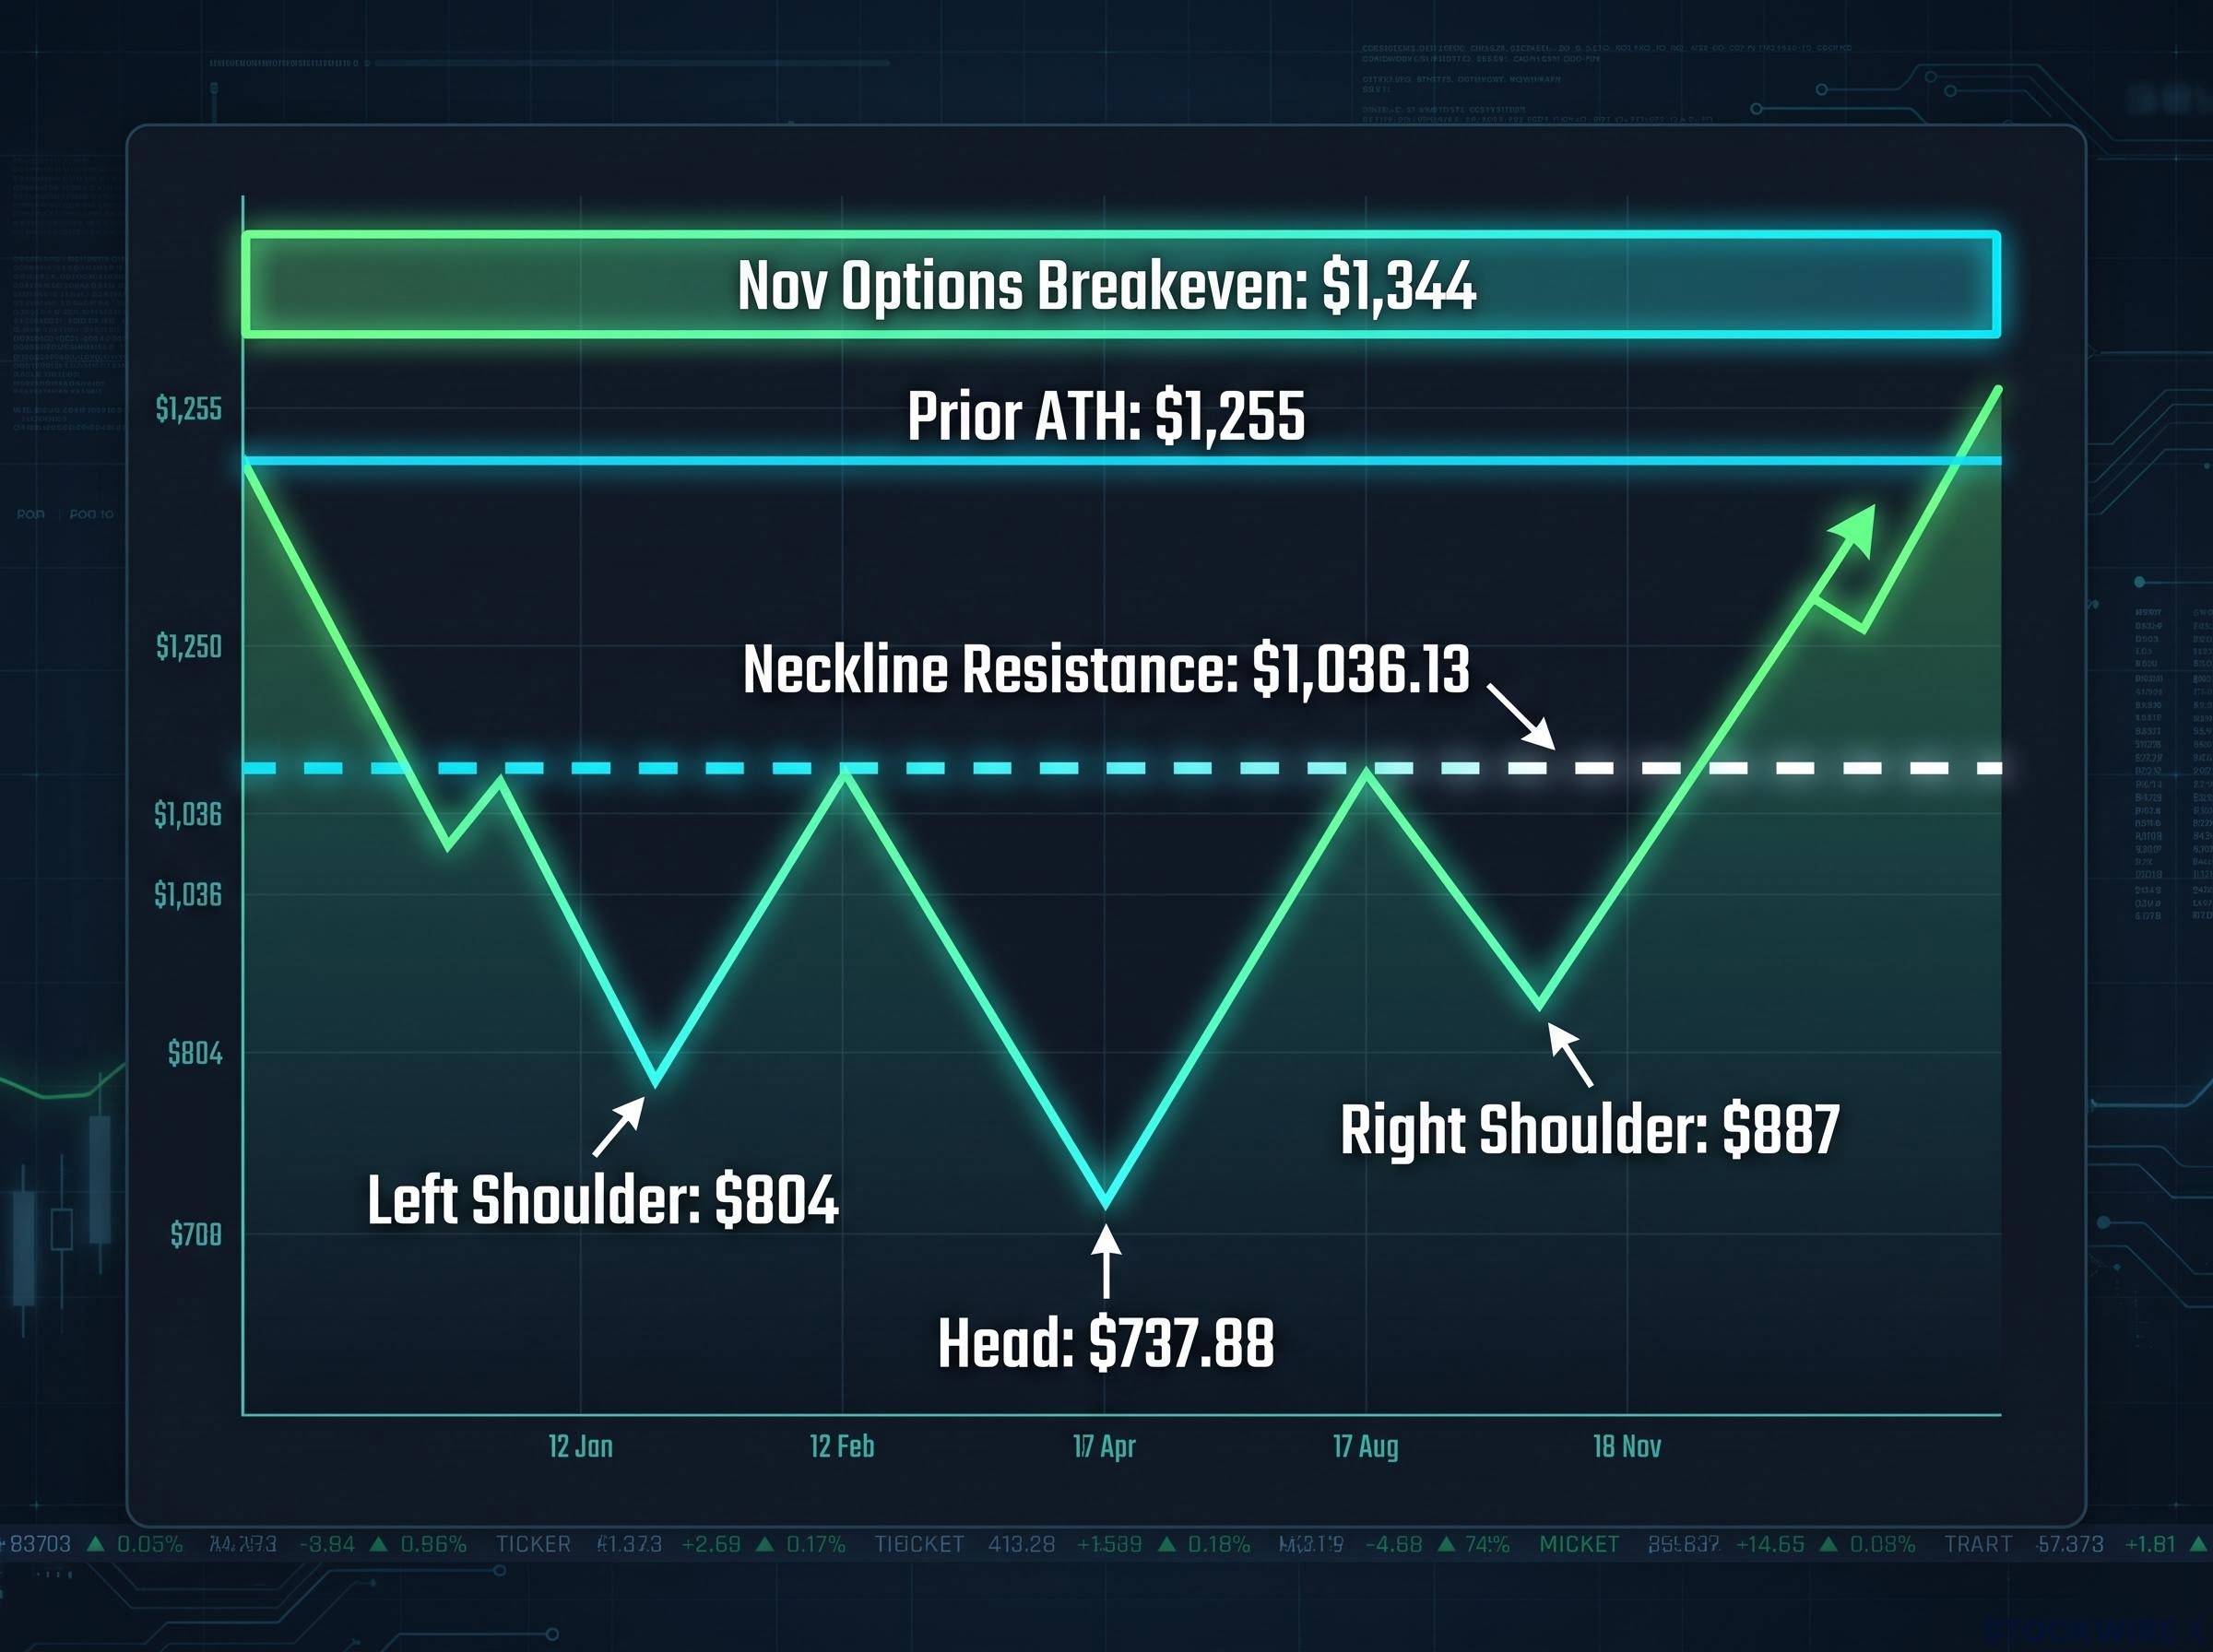
The higher low on the right shoulder is the constructive part. It shows buyers stepping in earlier than they did at the head, which is the behaviour that precedes a breakout when a pattern confirms.
Confirmation is the word that matters. A pattern like this only produces its measured move, a price projection well above the prior all-time high of $1,255, if price clears the neckline on rising trading volume. Without that volume, the setup can fail.
Inverted head-and-shoulders confirmation requires volume validation that is consistent across asset classes: Bulkowski-derived datasets put the pattern’s target achievement rate at 71%-83% when volume expands through the neckline break, but false-breakout environments can push failure rates toward 60% on low-volume tests, making the volume condition as important as the price level itself.
This is where the technical and fundamental pictures converge. The options market is already pricing a $1,344 breakeven for November expirations, sitting right in the zone of the institutional targets discussed earlier. The chart’s projected destination and Wall Street’s price objectives are effectively the same neighbourhood.
Watching the $1,036 neckline gives you a specific, quantifiable entry trigger. If price breaks and holds above it on volume ahead of the Q4 catalyst, the setup confirms; if it stalls below, you know to stand aside and manage risk tightly rather than guessing.
Evaluating valuation traps and short-seller action
Every one of the bullish signals above carries a mirror image, and ignoring them is how investors get trapped at the top of a memory cycle. Before committing capital, you need to sit with the vulnerabilities that could break this thesis.
Start with the smart-money hedging. MarketBeat reported short interest at roughly 30.02 million shares in August 2026, about 2.66% of the float, and documented insider selling of 89,000 shares worth around $34.8 million over a 90-day window, including disposals by executive vice presidents.
Seeing executives sell into a rally reminds you that no supercycle lasts forever. It does not automatically mean the top is in, but it does mean you should maintain strict stop-loss discipline regardless of how bullish the analyst consensus looks.
The bear case rests on three specific risks worth ranking:
- The peak earnings trap. FXLeaders noted in July 2026 that Micron looks cheap at roughly 7x forward earnings, but that cheapness assumes today’s peak-cycle numbers are permanent baselines. If they are not, the low multiple is a mirage. Skeptical institutional DCF models cited by MarketMinute have suggested fair value as low as $163.
- Capped contract upside. Moomoo commentary flagged the paradox that the same long-term contracts guaranteeing Micron’s 2026 output also cap how much supercycle margin the company can capture, since prices are locked rather than free to spike.
- Geopolitical supply-chain risk. Various analyses caution that Taiwan labour disputes and broader supply-chain dependencies threaten Micron’s ability to execute its capacity ramp flawlessly.
The $5.3 billion loss in 2023 is the memory that should stay in the back of your mind. It is the reminder of how severe the down-leg of this sector can be when demand turns, and the core question skeptics keep asking is whether HBM has genuinely broken that pattern or merely stretched the up-cycle to an unusual length.
For investors wanting to stress-test the valuation math in detail, our dedicated guide to Micron’s valuation at cycle peak examines why a stock trading at 14x reported earnings may simultaneously trade at 50x normalised earnings, and walks through the Samsung supply-response risk that represents the most trackable near-term threat to Micron’s pricing.
This article is for informational purposes only and should not be considered financial advice. Investors should conduct their own research and consult with financial professionals before making investment decisions. Past performance does not guarantee future results, and financial projections are subject to market conditions and various risk factors.
Making an informed call before Q4 earnings
The trade comes down to one alignment. The technical breakout level at $1,036 and the fundamental price targets clustered between $1,300 and $1,513 are pointing at the same outcome, which is rare enough to warrant your attention.
The tension heading into Q4 earnings is singular: has HBM demand structurally changed Micron’s valuation, or is this simply the largest cyclical peak the sector has produced? The bulls have sold-out capacity, near-unanimous buy ratings, and a $25 billion capex commitment on their side. The bears have insider selling, capped contract upside, and a $5.3 billion loss three years ago as proof of what memory can do.
Your decision hinges on the $1,036 neckline. A confirmed break on volume validates the structural thesis and offers a defined entry; a failure below it keeps the cyclical-peak fear alive. Either way, the number to watch is set, and the earnings report is where the market decides which story wins.