
BCA Research Says Warsh Has the AI Inflation Story Backwards
1 hr ago

Micron Technology guided for $33.5 billion in revenue and 81% gross margins for a single quarter. One quarter of projected profit now approaches what some semiconductor companies generate in a full fiscal year. The guidance, issued 18 March 2026, follows a stock that has appreciated over 900% in a year and commands a market capitalisation of approximately $1.2 trillion. Yet shares trade at roughly 14 times earnings. The gap between those two facts is where this analysis sits. What follows is a structured framework for evaluating whether Micron’s extraordinary numbers reflect a durable structural shift in the memory market or the familiar peak of a cycle that has punished investors before. Readers will leave with a clear picture of the bull case, the bear case, and the specific variables that will determine which prevails.
The scale of Micron’s Q2 FY2026 results requires no editorialising. The figures do their own work when placed against their baselines.
| Metric | Year-ago quarter | Prior quarter (Q1 FY2026) | Q2 FY2026 actual | Q3 FY2026 guidance |
|---|---|---|---|---|
| Revenue | $8.05B | $13.64B | $23.86B | $33.5B (±$750M) |
| Gross margin | N/A | N/A | 74.4% (GAAP) | ~81% |
| Net income (GAAP) | N/A | N/A | $13.79B | Not disclosed |
GAAP net income reached $13.79 billion for the quarter, with non-GAAP earnings per share of $12.20. Operating margin stood at approximately 69%. Annualised, the current quarterly run rate extrapolates to roughly $85 billion in profit per year.
Scale in context: Q3 revenue guidance of approximately $33.5 billion alone approaches Micron’s total revenue of roughly $35 billion for the prior full fiscal year. A single quarter now rivals what took twelve months to produce.
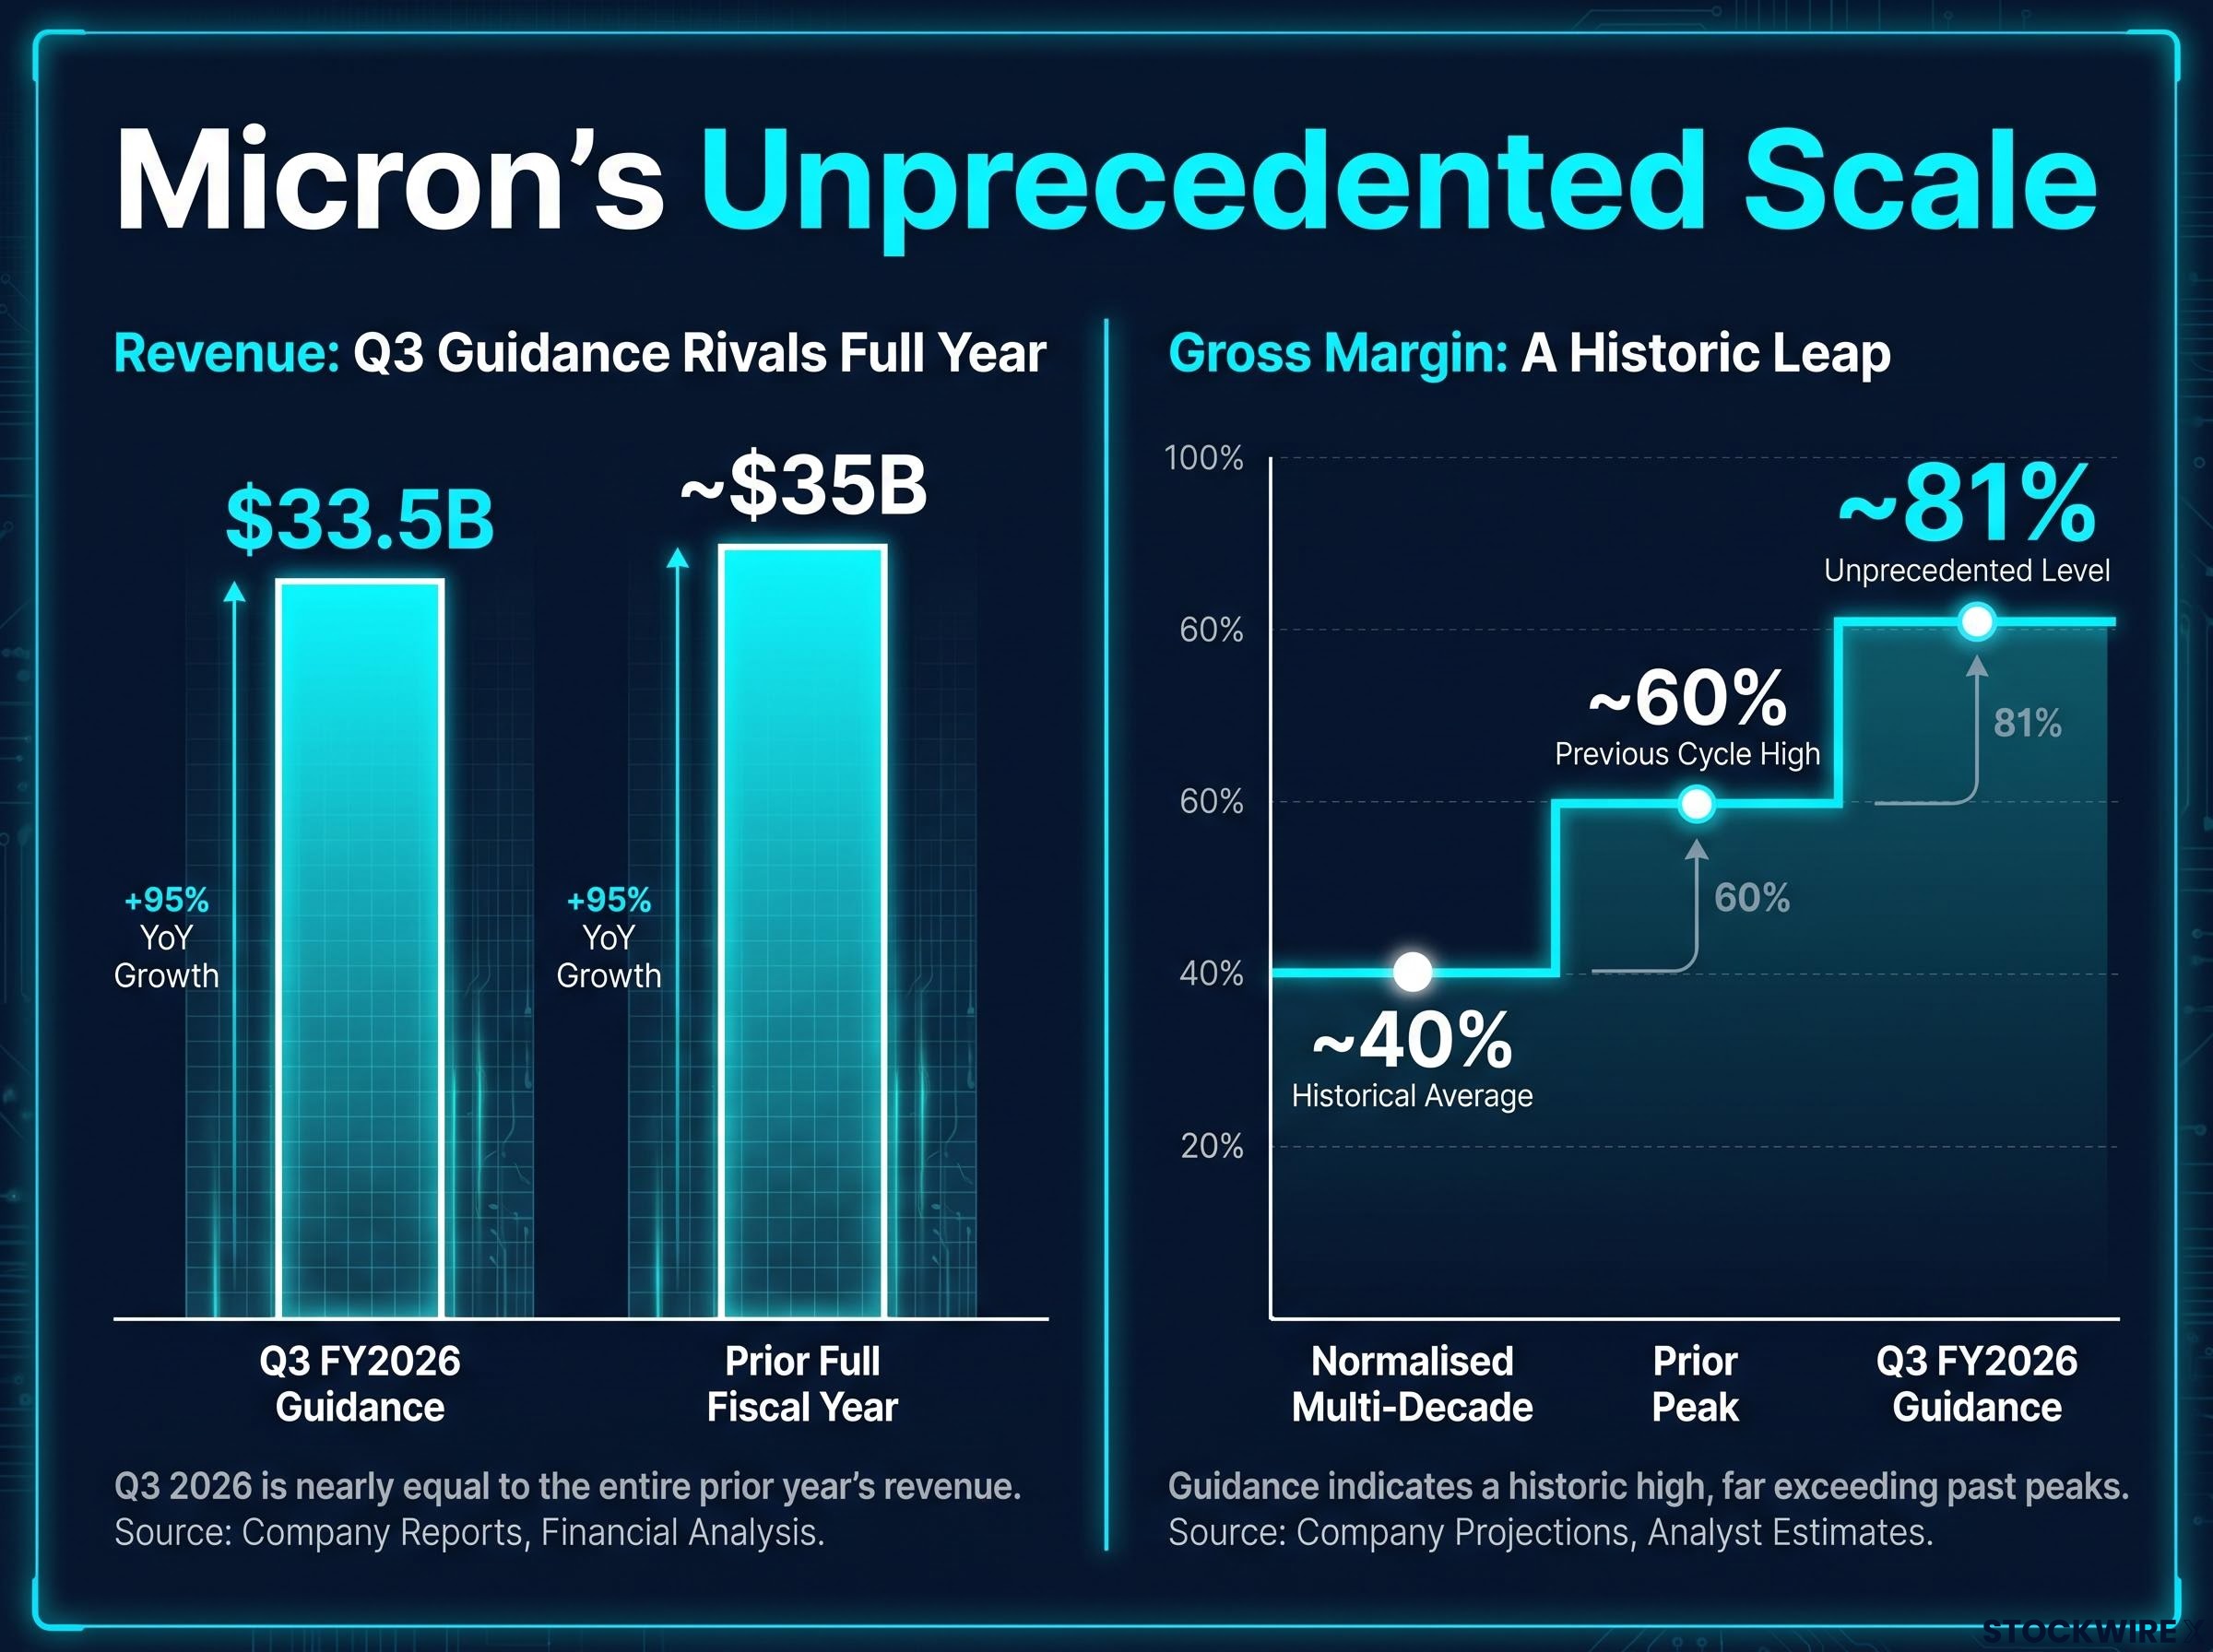
The prior peak gross margin for the company sat near 60%. The normalised multi-decade level hovered closer to 40%. In prior downturns, margins turned negative. The 81% guidance does not represent incremental improvement; it represents a step-change in the company’s financial profile.
The bull case for Micron rests on a structural argument: high bandwidth memory (HBM), the stacked memory chips used in artificial intelligence accelerators, behaves differently from the commodity DRAM that defined prior cycles.
HBM chips are manufactured by stacking multiple layers of memory die and connecting them through advanced packaging techniques. This process is technically complex, requires specialised equipment, and limits how quickly competitors can bring new supply online. The barriers to entry are higher than in conventional DRAM, where production capacity can be expanded more rapidly.
The memory chip supercycle now unfolding differs from prior upcycles in one critical respect: hyperscaler capex commitments from the four largest US cloud operators are projected to reach $725 billion in 2026, with AI data centre operators already accounting for an estimated 70% of total memory shipment volumes, a demand base that has no precedent in any prior DRAM cycle.
The commercial characteristics reinforce the structural distinction:
Unconfirmed market speculation suggests Micron may have locked in approximately 20-30% of peak-priced volume through 2028, though exact contract terms have not been publicly disclosed. If accurate, this would represent a level of forward revenue certainty absent in any prior DRAM cycle.
The upside scenario positions Micron as something resembling a contracted AI memory utility, with durable pricing relationships rather than spot-market exposure. That framing remains an upside case, not a base case, and its durability depends on variables examined in the sections that follow.
The memory chip industry has a mechanism, and it has executed that mechanism with remarkable consistency across decades. Understanding the causal chain matters more than simply noting that “cycles happen.”
Historical anchor: Micron’s gross margins have turned negative in prior downturns, meaning revenue fell below the direct cost of production before any operating expenses were accounted for. The distance from 81% to negative is the full range of this industry’s cyclical amplitude.
Samsung passed Nvidia’s HBM3E qualification tests in September 2025 and entered mass production by late October 2025. The company has confirmed plans for a 50% increase in HBM production capacity during 2026, targeting approximately 250,000 wafers per month, up from approximately 170,000.
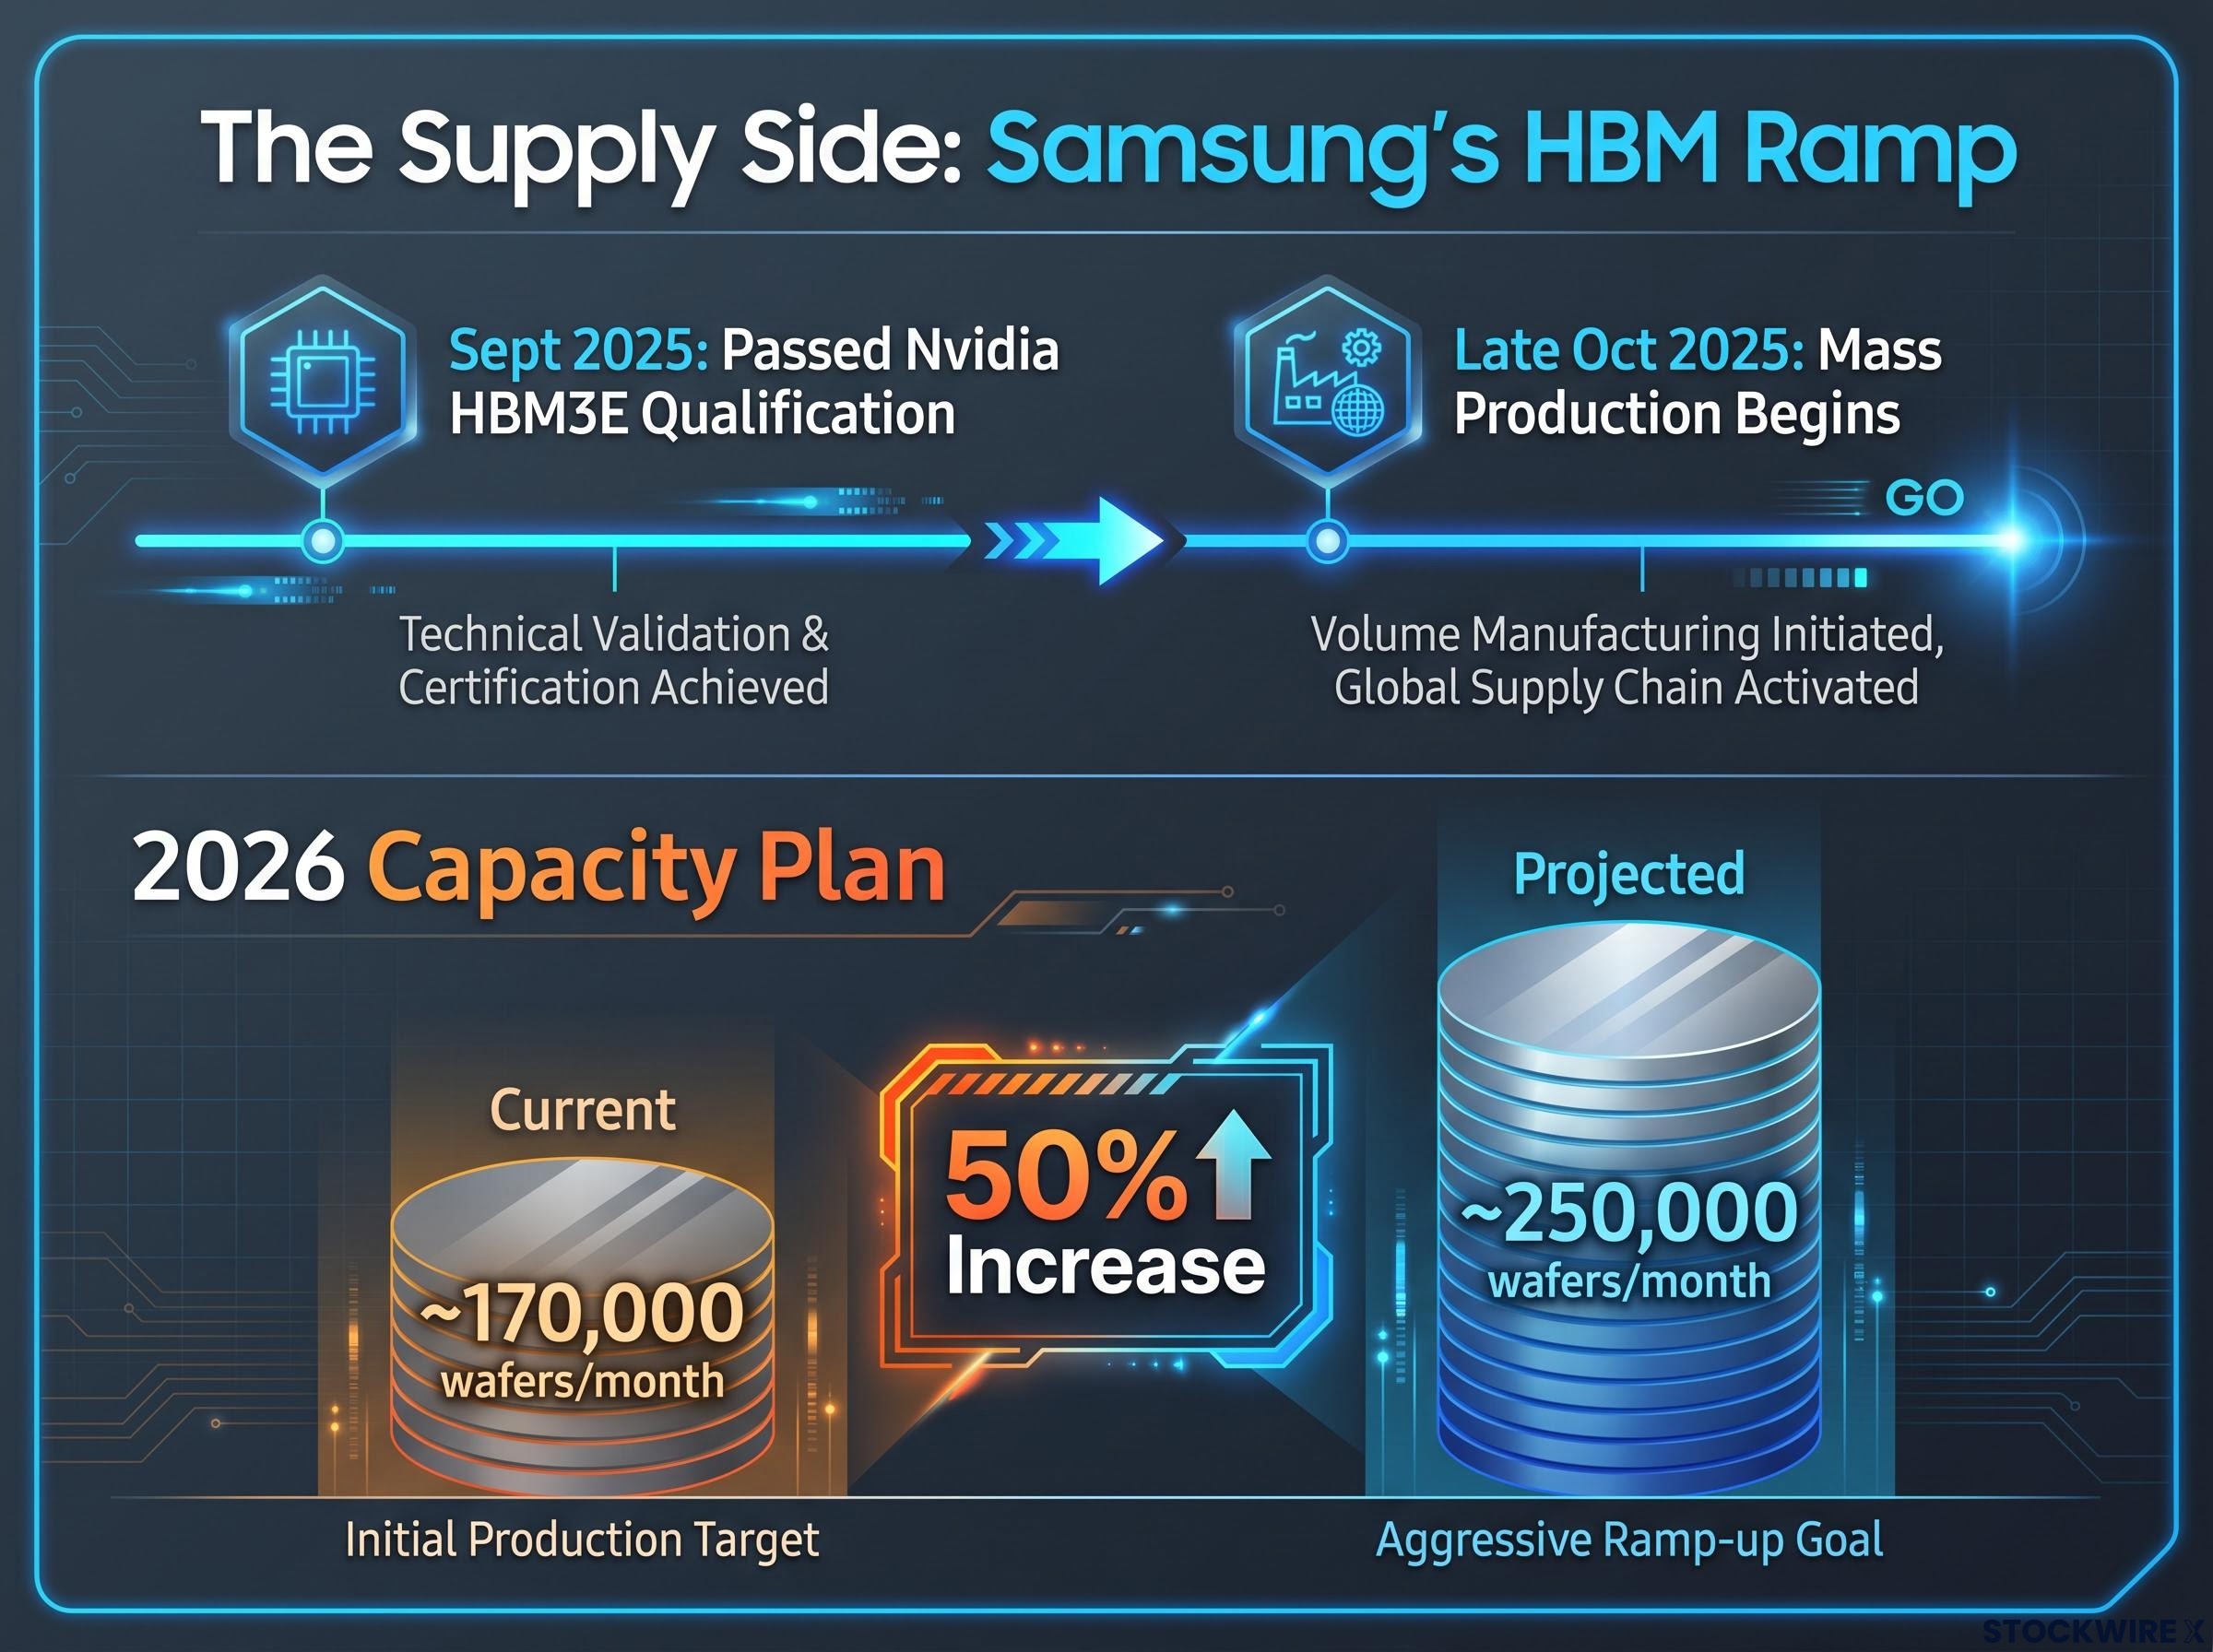
That expansion is the mechanism in motion. Samsung, observing margins near 80%, is responding exactly as theory predicts.
Chinese memory rivals YMTC and CXMT remain constrained by US export control restrictions on semiconductor manufacturing equipment, a policy dimension that has been largely absent from the supply-side analysis focused on Samsung, yet which materially affects how quickly any third source of HBM competition could emerge.
There is also a subtlety in the contract structure argument that deserves scrutiny. Multi-year customer supply agreements may guarantee purchase volumes without locking in specific prices, leaving Micron exposed to quarterly price resets even under long-term contracts. The distinction between volume commitments and price commitments is the difference between durable margin protection and a guaranteed volume of product sold at whatever the market will bear.
Most cyclicality analysis focuses on the supply side: who is building capacity and how fast. The demand side carries a second, independent risk channel that receives less attention.
As memory becomes the binding constraint on AI infrastructure, leading AI developers are incentivised to invest in architectural improvements that reduce memory consumption per unit of AI output. Sundar Pichai has indicated that AI models could become approximately 30 times more efficient, though the specific event and date of that statement have not been confirmed in available sources.
Efficiency signal: If AI models achieve even a fraction of a 30-times efficiency improvement in memory consumption per workload, the demand trajectory that underpins current HBM pricing could flatten materially, even if total AI spending continues to grow.
The timeline for this risk is three to four years, placing potential demand-side compression in the 2029-2030 window. That timeline overlaps with the period when new HBM capacity from Samsung and others is scheduled to reach full production scale.
The compounding dynamic is the concern: efficiency improvements reducing memory demand per workload at precisely the moment new supply capacity is arriving. Either risk alone could compress margins. Together, they could accelerate the reversion significantly.
AI infrastructure capital commitments from Microsoft and Meta alone exceeded $160 billion for 2026, a concentration of demand that both supports the bull case for sustained memory pricing and introduces the single largest downside risk: any pullback from a small number of hyperscalers could drive an estimated 20% correction in chip-related equities without any change in the underlying supply picture.
A 14 times earnings multiple appears inexpensive for a $1.217 trillion company producing the infrastructure layer of artificial intelligence. The appearance dissolves once the baseline assumption is tested.
14 times earnings is cheap only if current earnings represent a sustainable baseline. If margins normalise, the multiple expands on an unchanged stock price, because the denominator (earnings) shrinks. The stock does not become cheaper; it becomes more expensive in real terms.
Goldman Sachs raised its 12-month price target to $550 on 19 March 2026, up from a prior $350. As recently as December 2025, Goldman’s target had been $205, illustrating how rapidly consensus has shifted and how difficult it is to anchor to any single analyst number. Unverified consensus data suggests an average target of approximately $641.97 across 39 analysts as of 3 June 2026, though this figure has not been independently confirmed.
Retail investor behaviour adds a further signal: investors have been observed paying a premium for a newly launched DRAM-focused ETF despite the ability to purchase the underlying holdings directly, suggesting momentum-driven participation rather than valuation-driven positioning.
| Scenario | Revenue | Gross margin | Est. earnings | Implied stock move |
|---|---|---|---|---|
| Base / bull (sustained HBM pricing) | ~$130-150B annual | ~70-80% | ~$80-85B | Limited upside from current levels |
| Partial normalisation | ~$100-120B annual | ~50-60% | ~$40-50B | ~50% decline |
| Full cyclical reversion | ~$100B annual | ~40% | ~$25B | ~80-90% decline |
The observable signals that will indicate which scenario is unfolding are specific and trackable. HBM contract price disclosures (or the absence of them) will reveal whether Micron is locking in prices or merely volumes. Samsung’s capacity ramp execution through 2026, measured in quarterly production disclosures, will establish the pace of supply-side competition. AI efficiency announcements from hyperscalers, particularly whether companies begin quantifying memory savings per workload in public commentary, will signal demand-side trajectory. And Micron’s own quarterly gross margin results, beginning with Q3 FY2026, will provide the most direct empirical test.
Q3 FY2026 results, scheduled for 24 June 2026, will be the first empirical test of whether 81% gross margin guidance converts to reported reality. The gross margin line is the single most important number in the release; revenue growth is already widely expected, but margin durability is the contested variable.
Beyond the earnings release, four observable signals will shape the outlook through the remainder of 2026 and into 2027:
Rather than resolving the bull/bear debate, these data points will resolve it for investors who track them.
The financial results are not in dispute. $23.86 billion in quarterly revenue, $13.79 billion in net income, and guidance for 81% gross margins are reported facts. What is in dispute is whether these numbers represent a new equilibrium or the peak of a cycle that has always reverted.
Micron at current prices suits a specific investor profile: those with a long time horizon, high risk tolerance, and the analytical discipline to distinguish between the three scenarios outlined above as new data arrives. It does not suit investors seeking margin of safety, because the margin of safety depends entirely on which earnings baseline is correct.
The 14 times multiple paradox cuts both ways. It limits downside if the bull case materialises, because the stock already trades at a discount to growth peers. But it provides no protection if earnings normalise, because the multiple expands mechanically on a falling earnings base. A stock trading at 14 times peak earnings and 50 times normalised earnings is not cheap; it is priced for perfection it has never sustained.
Semiconductor earnings revisions across the sector have been upward by more than 20% in 2026, a data point that Bank of America analyst Savita Subramanian uses to distinguish the current cycle from speculative episodes where price appreciation runs ahead of fundamentals, though the analysis also notes that active long-only overweight in the sector sits at approximately 20%, half the 2017 cycle peak, leaving room for further institutional positioning before the extremes associated with prior bubbles are reached.
This article is for informational purposes only and should not be considered financial advice. Investors should conduct their own research and consult with financial professionals before making investment decisions. Past performance does not guarantee future results. Financial projections are subject to market conditions and various risk factors.
—
High bandwidth memory (HBM) is a stacked chip architecture used in AI accelerators that is more technically complex and harder to replicate than conventional DRAM, giving Micron stronger pricing power and longer-duration customer contracts than in prior memory cycles.
Micron's 14 times earnings multiple reflects investor uncertainty about whether current profit levels are sustainable; if margins normalise from their current peak near 81% back toward historical averages, the multiple expands mechanically on a falling earnings base, making the stock more expensive in real terms even at an unchanged share price.
The four key signals to track are Micron's Q3 FY2026 gross margin result versus its 81% guidance, Samsung's quarterly HBM production disclosures against its 250,000 wafer-per-month target, hyperscaler commentary on AI model memory efficiency, and any public confirmation of whether Micron's multi-year contracts lock in price or only volume.
Samsung passed Nvidia's HBM3E qualification in September 2025 and plans a 50% increase in HBM production capacity during 2026, adding a meaningful new supply source at precisely the moment Micron's margins are near all-time highs, following the same supply-response mechanism that has compressed memory margins in every prior cycle.
In a full cyclical reversion, the article models Micron revenue falling to approximately $100 billion annually with gross margins reverting to around 40%, implying earnings of roughly $25 billion and a potential 80-90% decline in the stock price from current levels.


