Oil prices are sitting near cycle highs after weeks of Gulf disruption, and by the rulebook most investors carry in their heads, the dollar should be roaring higher. It is not.
That single fact is the reason this moment is worth your attention. As of early September 2026, USD/JPY is hovering near 153, hedge funds are building positions for a move below 150, diesel refining margins have touched $108 per barrel intraday, gold is trading near $4,400 per ounce, and the 10-year Treasury yield sits around 4.80%.
Look across those four markets at once and a pattern emerges. Something is pulling against the dollar in ways the simple oil-equals-dollar-strength story cannot explain.
After reading this, you will understand the three structural forces working against the greenback right now, why the old rules no longer apply cleanly, and the specific signals to watch as these forces either converge into a broader dollar reversal or stall out. The US Dollar outlook has become genuinely complex, and that complexity is where the opportunity and the risk both live.
The old oil-dollar rule: what it was, and why it is breaking down
Here is the logic you probably absorbed somewhere along the way. A Gulf disruption sends oil prices higher. Oil is priced in dollars, so higher oil means the world needs more dollars to buy the same barrels. Demand for dollars rises, and the dollar strengthens.
Layer a safe-haven reflex on top of that, where scared money runs into dollars during any crisis, and you had a rule that felt about as dependable as gravity for decades.
The trouble is that the rule has quietly stopped working as advertised.
Research from the European Central Bank on the link between oil prices and the US dollar concludes the co-movement between the two “is not likely to be systematic.” The sign and strength of the correlation shift depending on what is actually driving the oil move: a demand shock, a supply shock, a change in risk appetite, or a policy shift. There is no single fixed relationship to lean on.
The current episode makes the point vividly. Despite Gulf disruptions pushing Brent-linked prices sharply higher, the dollar has climbed only around 1.4% against a basket of currencies, and analysts attribute most of even that modest move to yen weakness rather than any broad oil-driven rush into dollars.
The correlation data confirms the flattening. AhaSignals puts the 30-day oil-dollar correlation at roughly -0.15, well off its historical baseline near -0.25. CME Group data shows a correlation of only about 11% between US crude benchmarks and major currency pairs over recent periods. The rolling correlation between the dollar index and Brent crude ranged between -0.15 and +0.20 across 2024 and 2025, a far cry from the strongly negative readings of earlier decades.
ING strategists have argued that NOK/SEK and AUD/NZD now capture Gulf-driven energy risk more reliably than EUR/USD or DXY, because the exporter-versus-importer terms-of-trade differential is visible in those pairs without reserve-currency noise distorting the signal.
What this means for you is direct. A rule you may have applied to currency positioning or portfolio hedging has become unreliable, and applying it mechanically in this environment risks pointing you in exactly the wrong direction.
Before the article resolves the picture, it helps to see the three competing explanations for the dollar’s muted response side by side:
- The safe-haven channel still quietly supports the dollar through crisis-driven demand and delayed rate cuts.
- The gains are modest and driven by yen weakness, not oil, so this is a Japan story wearing an energy costume.
- Dedollarization pressure in energy trade is blunting the automatic boost higher oil once delivered.
How the US exporter shift changed the equation
There is a deeper structural reason the old directional logic no longer holds, and it starts with a change in what the United States actually is.
For most of the twentieth century, the US was a large net oil importer. Higher oil prices widened the trade deficit, sent dollars abroad to pay for crude, and weakened the currency through the trade channel almost mechanically.
The shale revolution flipped that. According to Energy Intelligence, because the US is now a major hydrocarbon exporter, rising dollar-denominated energy prices improve US terms of trade rather than eroding them. The old rule’s foundation has been rebuilt, and it no longer points reliably in the direction most investors still assume.
EIA data on US energy exports confirms the United States has been a net total energy exporter every year since 2019, providing the statistical foundation for why rising oil prices now improve US terms of trade rather than widening the deficit as they once did.
When big ASX news breaks, our subscribers know first
What the diesel crack spread above $100 per barrel is actually telling you
If you want to know how much real-world pain the Gulf disruption is causing, ignore the headline oil price for a moment and look at diesel.
The diesel crack spread is the price premium of ultra-low sulfur diesel (ULSD) futures over WTI crude. It measures how much refiners earn per barrel they process, and its direction and size signal two things at once: how stretched refinery capacity is, and how hungry the real economy is for the fuel.
In 2026 that number did something it had never done before. On 18 August 2026, according to DTN, the ULSD-WTI crack spread closed above $100 per barrel for the first time in history, settling at $102.86. Bloomberg confirmed the same first-ever triple-digit settlement that day and noted the record was surpassed later in the month.
Then it climbed further.
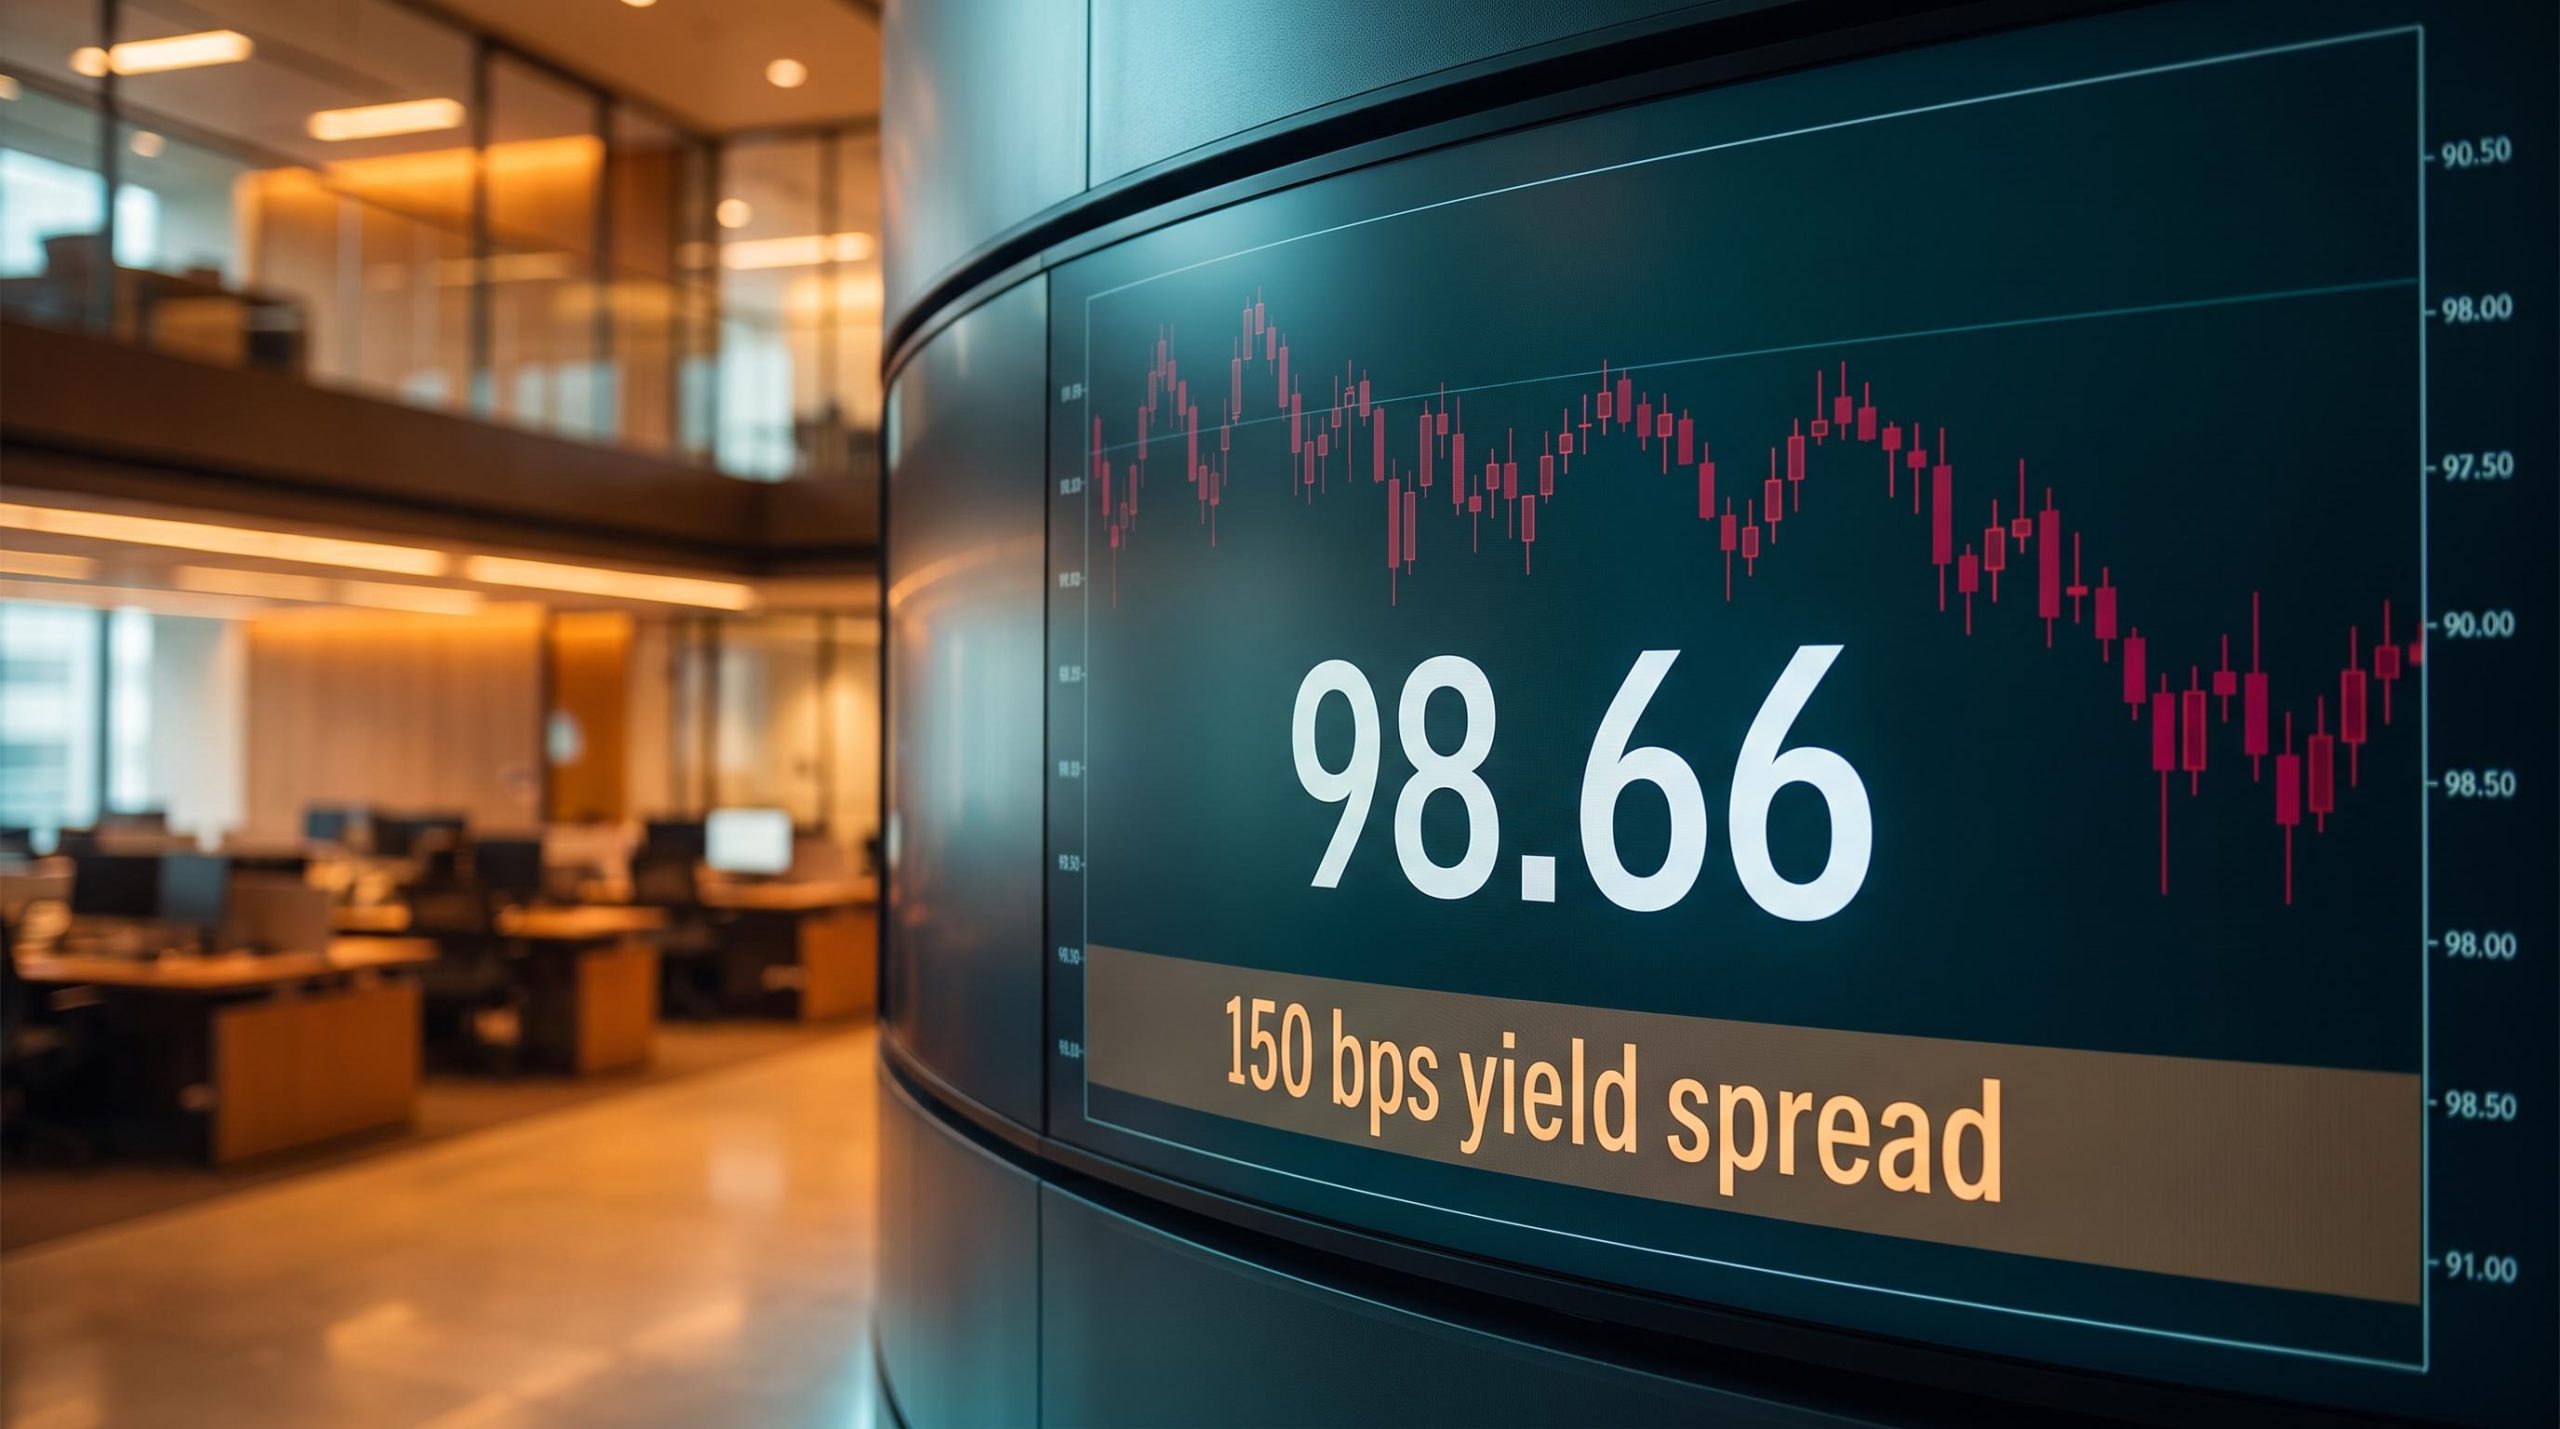
On 3 September 2026, the ULSD-WTI crack spread reached an intraday high of $108.02 per barrel, according to Reuters, before easing back toward $101 later in the session.
The driver is geopolitical. Escalation in the Gulf region, including US-Iran confrontations over the Strait of Hormuz, has stacked supply risk on top of already tight refining conditions. Roughly 20-25% of global seaborne oil trade transits the Strait, and historical disruptions there have driven Brent and WTI up 30-40% in short bursts. The 2026 episode pushed WTI close to $95 per barrel.
Here is the timeline of an unprecedented move:
| Date | Level | Source | Significance |
|---|---|---|---|
| 18 August 2026 | $102.86/bbl (close) | DTN | First close above $100 in history |
| August 2026 | Above $100 (breach) | Bloomberg | Confirmed first triple-digit settlement, then surpassed |
| 3 September 2026 | $108.02/bbl (intraday high) | Reuters | Highest level recorded during the episode |
The reason this matters to you goes far beyond commodity trading desks. Diesel powers freight transport, agricultural machinery, and industrial production. A crack spread above $100 is not a curiosity on a trader’s screen; it is a cost-of-logistics signal telling you that every supply chain using diesel as an input is absorbing an enormous shock. That cost eventually lands somewhere: on consumers, on corporate margins, or on both. It also feeds back into the inflation picture that keeps the Federal Reserve cautious, which loops straight back into the dollar story.
Why the Bank of Japan’s normalisation is the real pressure point on the dollar right now
Here is a fair question if you have been following a story about Gulf oil: why has the Japanese yen suddenly become the main character?
The answer is that the Bank of Japan (BoJ) is doing more near-term work against the dollar than the oil channel is doing for it. And the way to see it is through both the policy path and the money positioning behind it.
The BoJ is exiting decades of ultra-easy policy in deliberate steps. Japan raised rates for the first time in years, then kept going, moving off negative rates for the first time since the 1990s.
| Date | BoJ Policy Rate | Context / Significance |
|---|---|---|
| July 2024 | 0.25% | First step in the normalisation cycle |
| January 2025 | 0.50% | Highest policy rate since 2008 |
| December 2025 | 0.75% | Highest since 1995, framed as continued normalisation |
That progression matters because of what cheap yen used to fund.
The carry trade unwind: what it means in practice
For decades, near-zero Japanese rates made the yen the world’s preferred funding currency for the carry trade, where investors borrow in a cheap currency to buy higher-yielding assets elsewhere.
The yen carry trade persists despite the BoJ’s rate normalisation because a 2.5%-2.75% spread over US rates still makes borrowing in yen and investing in dollars one of the most structurally embedded trades in global capital markets, meaning the unwind pressure builds gradually rather than snapping off at any single rate threshold.
A carry trade unwind works in plain mechanical terms. Positions funded in cheap yen get closed. To repay the funding, traders buy yen back. That buying strengthens the yen against the dollar as a direct consequence.
The important part is that this dynamic operates independently of any view on the US economy. Yen strength can build even when US growth data is perfectly supportive of the dollar. As the BoJ lifts rates, the cost of holding yen-funded positions rises, encouraging exactly this kind of unwinding.
Now look at where professional money sits. CFTC data as of 1 September 2026 shows large speculators net short 92,227 yen futures contracts, and leveraged funds were net short 77,042 contracts as of 25 August 2026. That still-dominant short-yen posture is the consensus long-dollar trade.
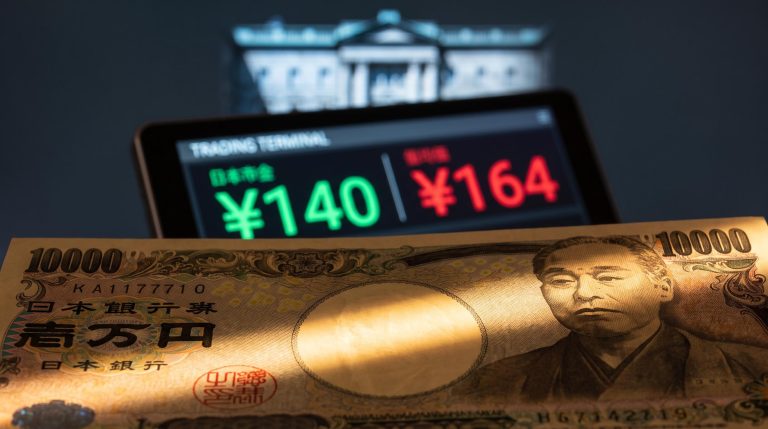
Against that consensus, a specific subset of global macro funds is building for a break below 150 in USD/JPY, a level they frame as a structural inflection point tied to expectations of further BoJ action. The pair was already trading at 153.19 on 9 September 2026, near a seven-month low, according to Wall Street Journal FX data. Strategists at RBC BlueBay Asset Management have added to long-yen positions, viewing levels near 160 as attractive entry points given the risk of further hikes and possible FX intervention. ING analyst Chris Turner identifies USD/JPY instability as a drag on overall dollar performance.
What this coexistence tells you is worth sitting with. Sophisticated macro capital is positioning against the consensus positioning, and that kind of divergence has historically preceded sharper, faster moves than the crowd expects. Add the fact that yen weakness amplifies Japan’s dollar-invoiced energy bill during Gulf disruptions, giving Tokyo extra reason to want a stronger yen, and this becomes an unusually high-stakes currency inflection point for global portfolios.
What could stop this convergence, and what to watch next
Before you read this as a one-way dollar-bearish story, it is worth being honest about the ways the dollar could re-strengthen despite everything above.
There are three credible scenarios. The BoJ could normalise more slowly than expected, leaving real rates negative with inflation near 3% even after the nominal hikes. A US growth or AI productivity surprise could revive the rate-differential support that has long underpinned the dollar. Or an acute global risk-off episode could trigger classic safe-haven dollar demand even as oil spikes.
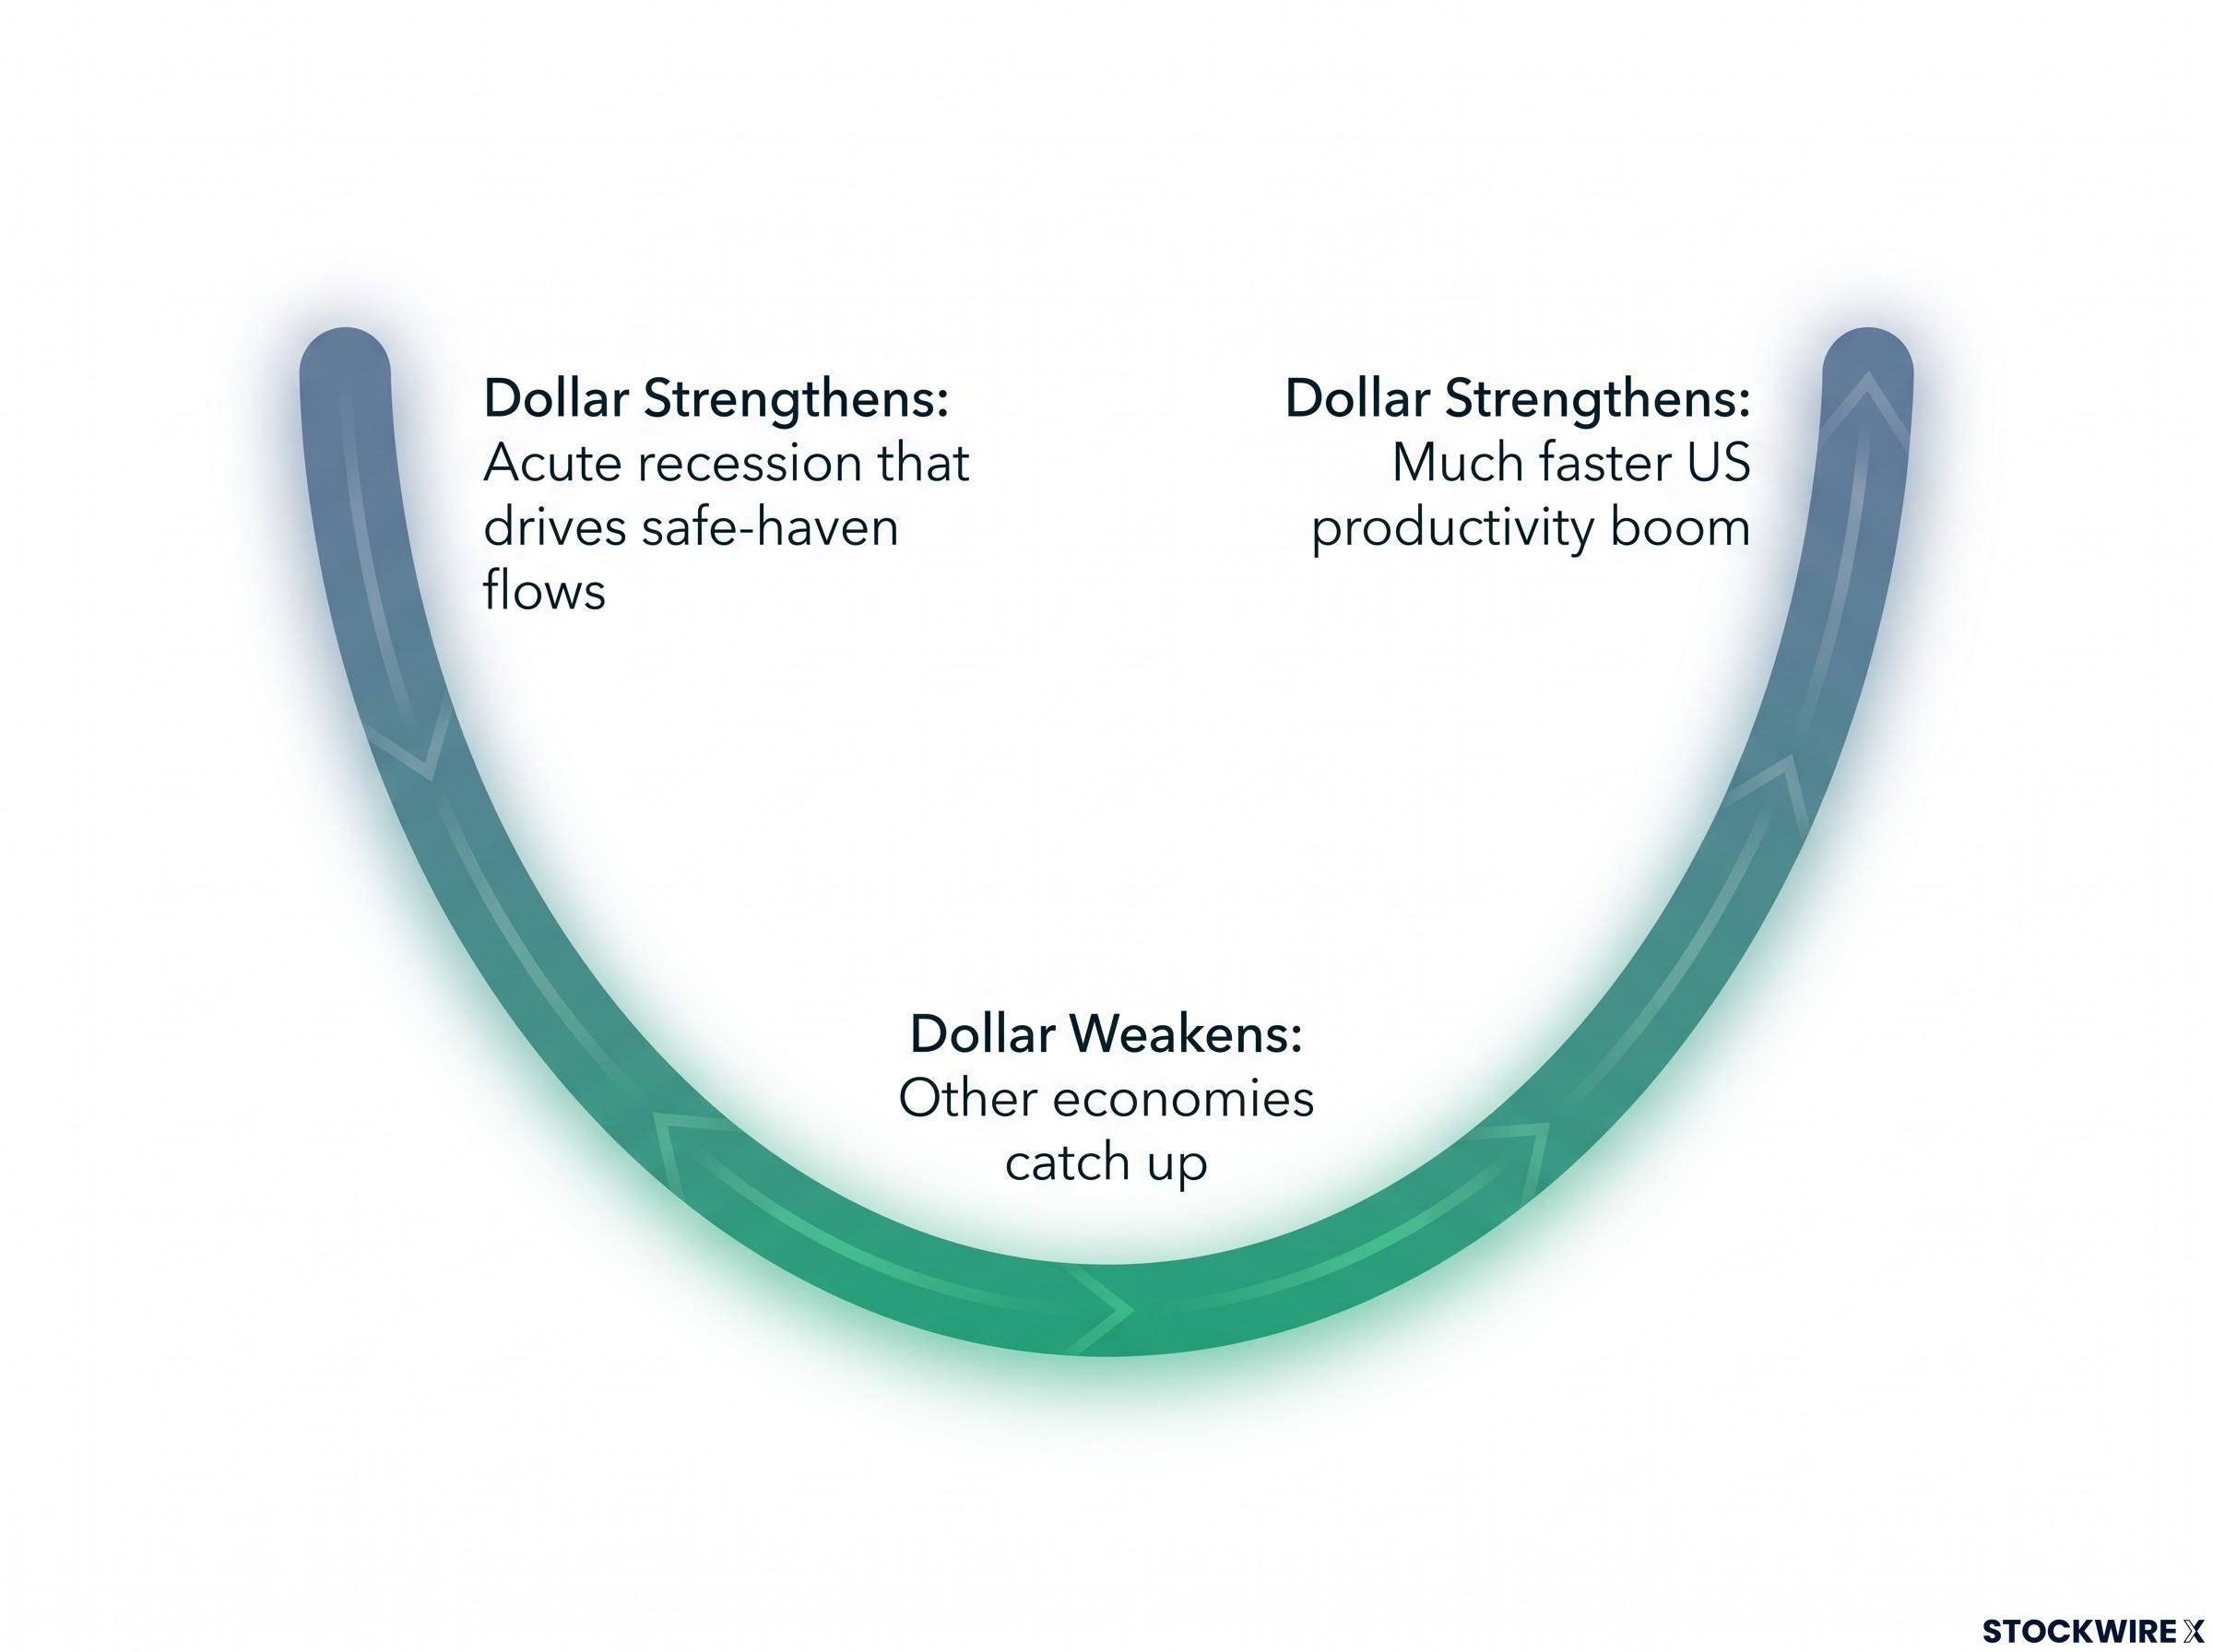
The J.P. Morgan “dollar smile” framework captures this neatly: the dollar strengthens at two extremes, an acute recession that drives safe-haven flows, or a much faster US productivity boom, and weakens in the middle where other economies catch up. Morgan Stanley expects further dollar weakness but cautions that the path depends heavily on rate differentials and the US growth trajectory.
Pulling a different direction entirely is the longer-term dedollarization risk. According to GIS and Fortune, rising pressure to settle energy trade through the yuan, stablecoins, and alternative rails means higher oil prices in this episode are simultaneously stressing the very architecture of dollar dominance. That structural concern does not resolve quickly in either direction.
Dedollarization pressure operates on a different timescale than the carry trade or the crack spread: the dollar’s reserve share has fallen from roughly 72% to 56.8% over two decades, but exchange-rate valuation effects, not active central bank selling, account for a significant portion of that measured decline.
Rather than a prose summary you would need to re-extract later, here is your watchlist:
- USD/JPY relative to 150: A sustained break below confirms the hedge fund directional thesis is materialising. Holding above suggests consensus long-dollar positioning is intact.
- The ULSD crack spread: Staying above $100 signals persistent Hormuz risk pricing and ongoing real-economy stress. A retreat suggests that risk premium is fading.
- The 10-year Treasury yield near 4.80%: Elevated yields are still propping up the dollar through rate differentials. That support erodes if the Fed cuts, and could spike unpredictably if fiscal stress hits instead.
Focus on that last number, because it is the most important figure in the room for the dollar right now. On 8 September 2026, the 10-year yield traded between 4.786% and 4.812%, closing near 4.80%, per CNBC and YCharts data. Gold closing near $4,389 per ounce the same day, with an intraday range of $4,383-$4,443 according to TwelveData, is a corroborating signal of underlying dollar stress. Whether the 10-year yield holds, rises from fiscal strain, or falls from Fed cuts will largely determine which of the three scenarios above actually plays out.
Fortune describes the 2026 Hormuz episode as placing “maximum stress on the architecture of dollar dominance at its most physical chokepoint.”
Reading the dollar’s next move in a world where the old rules no longer apply
Step back and the three forces stack into a single framework you can carry forward.
The oil-dollar correlation has fractured, sitting near -0.15 against its -0.25 historical baseline. The BoJ’s normalisation is doing more near-term currency work than the Gulf energy channel, with USD/JPY near 153 and falling while hedge funds position for sub-150. And the architecture of dollar dominance faces longer-term structural stress from dedollarization that Gulf disruptions are accelerating rather than reversing.
The DXY structural breakdown is also a measurement problem: the euro and yen together account for roughly 72-75% of the entire index, so simultaneous ECB and BoJ tightening mechanically suppresses DXY readings regardless of how the dollar performs against smaller-weight currencies.
None of these forces is individually decisive. Their convergence in the same directional window is what makes this unusual. The absence of a strong dollar response to a major Gulf oil shock, a dollar index up only around 1.4% despite a crack spread that touched $108.02 and WTI near $95, is itself the signal. The burden of proof has shifted onto the dollar bulls.
The 1970s petrodollar recycling episode is a reminder that Gulf-driven dollar stress has produced system-level consequences before. It is context, not prophecy.
The conditions under which the old rules reassert themselves remain real: a BoJ pause, a global recession that sparks safe-haven flows, or a US productivity surge. But you should now approach the dollar’s next move with a conditional, multi-variable framework rather than the single mechanical rule the old oil-dollar logic offered. The honest conclusion is not a directional call. It is that the environment has become genuinely complex, and knowing which variables to watch is worth more than a confident guess.
This article is for informational purposes only and should not be considered financial advice. Investors should conduct their own research and consult with financial professionals before making investment decisions. Past performance does not guarantee future results. Financial projections are subject to market conditions and various risk factors, and forward-looking statements are speculative and subject to change based on market developments.