On 17 September 2019, overnight borrowing rates in a corner of the financial system most investors had never heard of spiked past 10%, forcing an emergency Federal Reserve intervention within hours.
The Fed’s benchmark rate that morning was beside the point. The plumbing had seized.
The Federal Reserve’s policy rate is the story that fills headlines and drives portfolio decisions. But the architecture underneath it, specifically the overnight repo market, determines whether that rate can even reach the real economy at all.
You are now in a late-cycle environment where the same conditions that produced the 2019 spike and the March 2020 Treasury dislocation are quietly accumulating again. That makes repo market functioning, and its role in financial stability, a subject worth understanding before it becomes a headline.
Here is what the repo market actually is, why it sits at the centre of every major liquidity crisis, and the specific signals that tell you stress is building well before it surfaces in the news.
The $14 trillion overnight machine most investors ignore
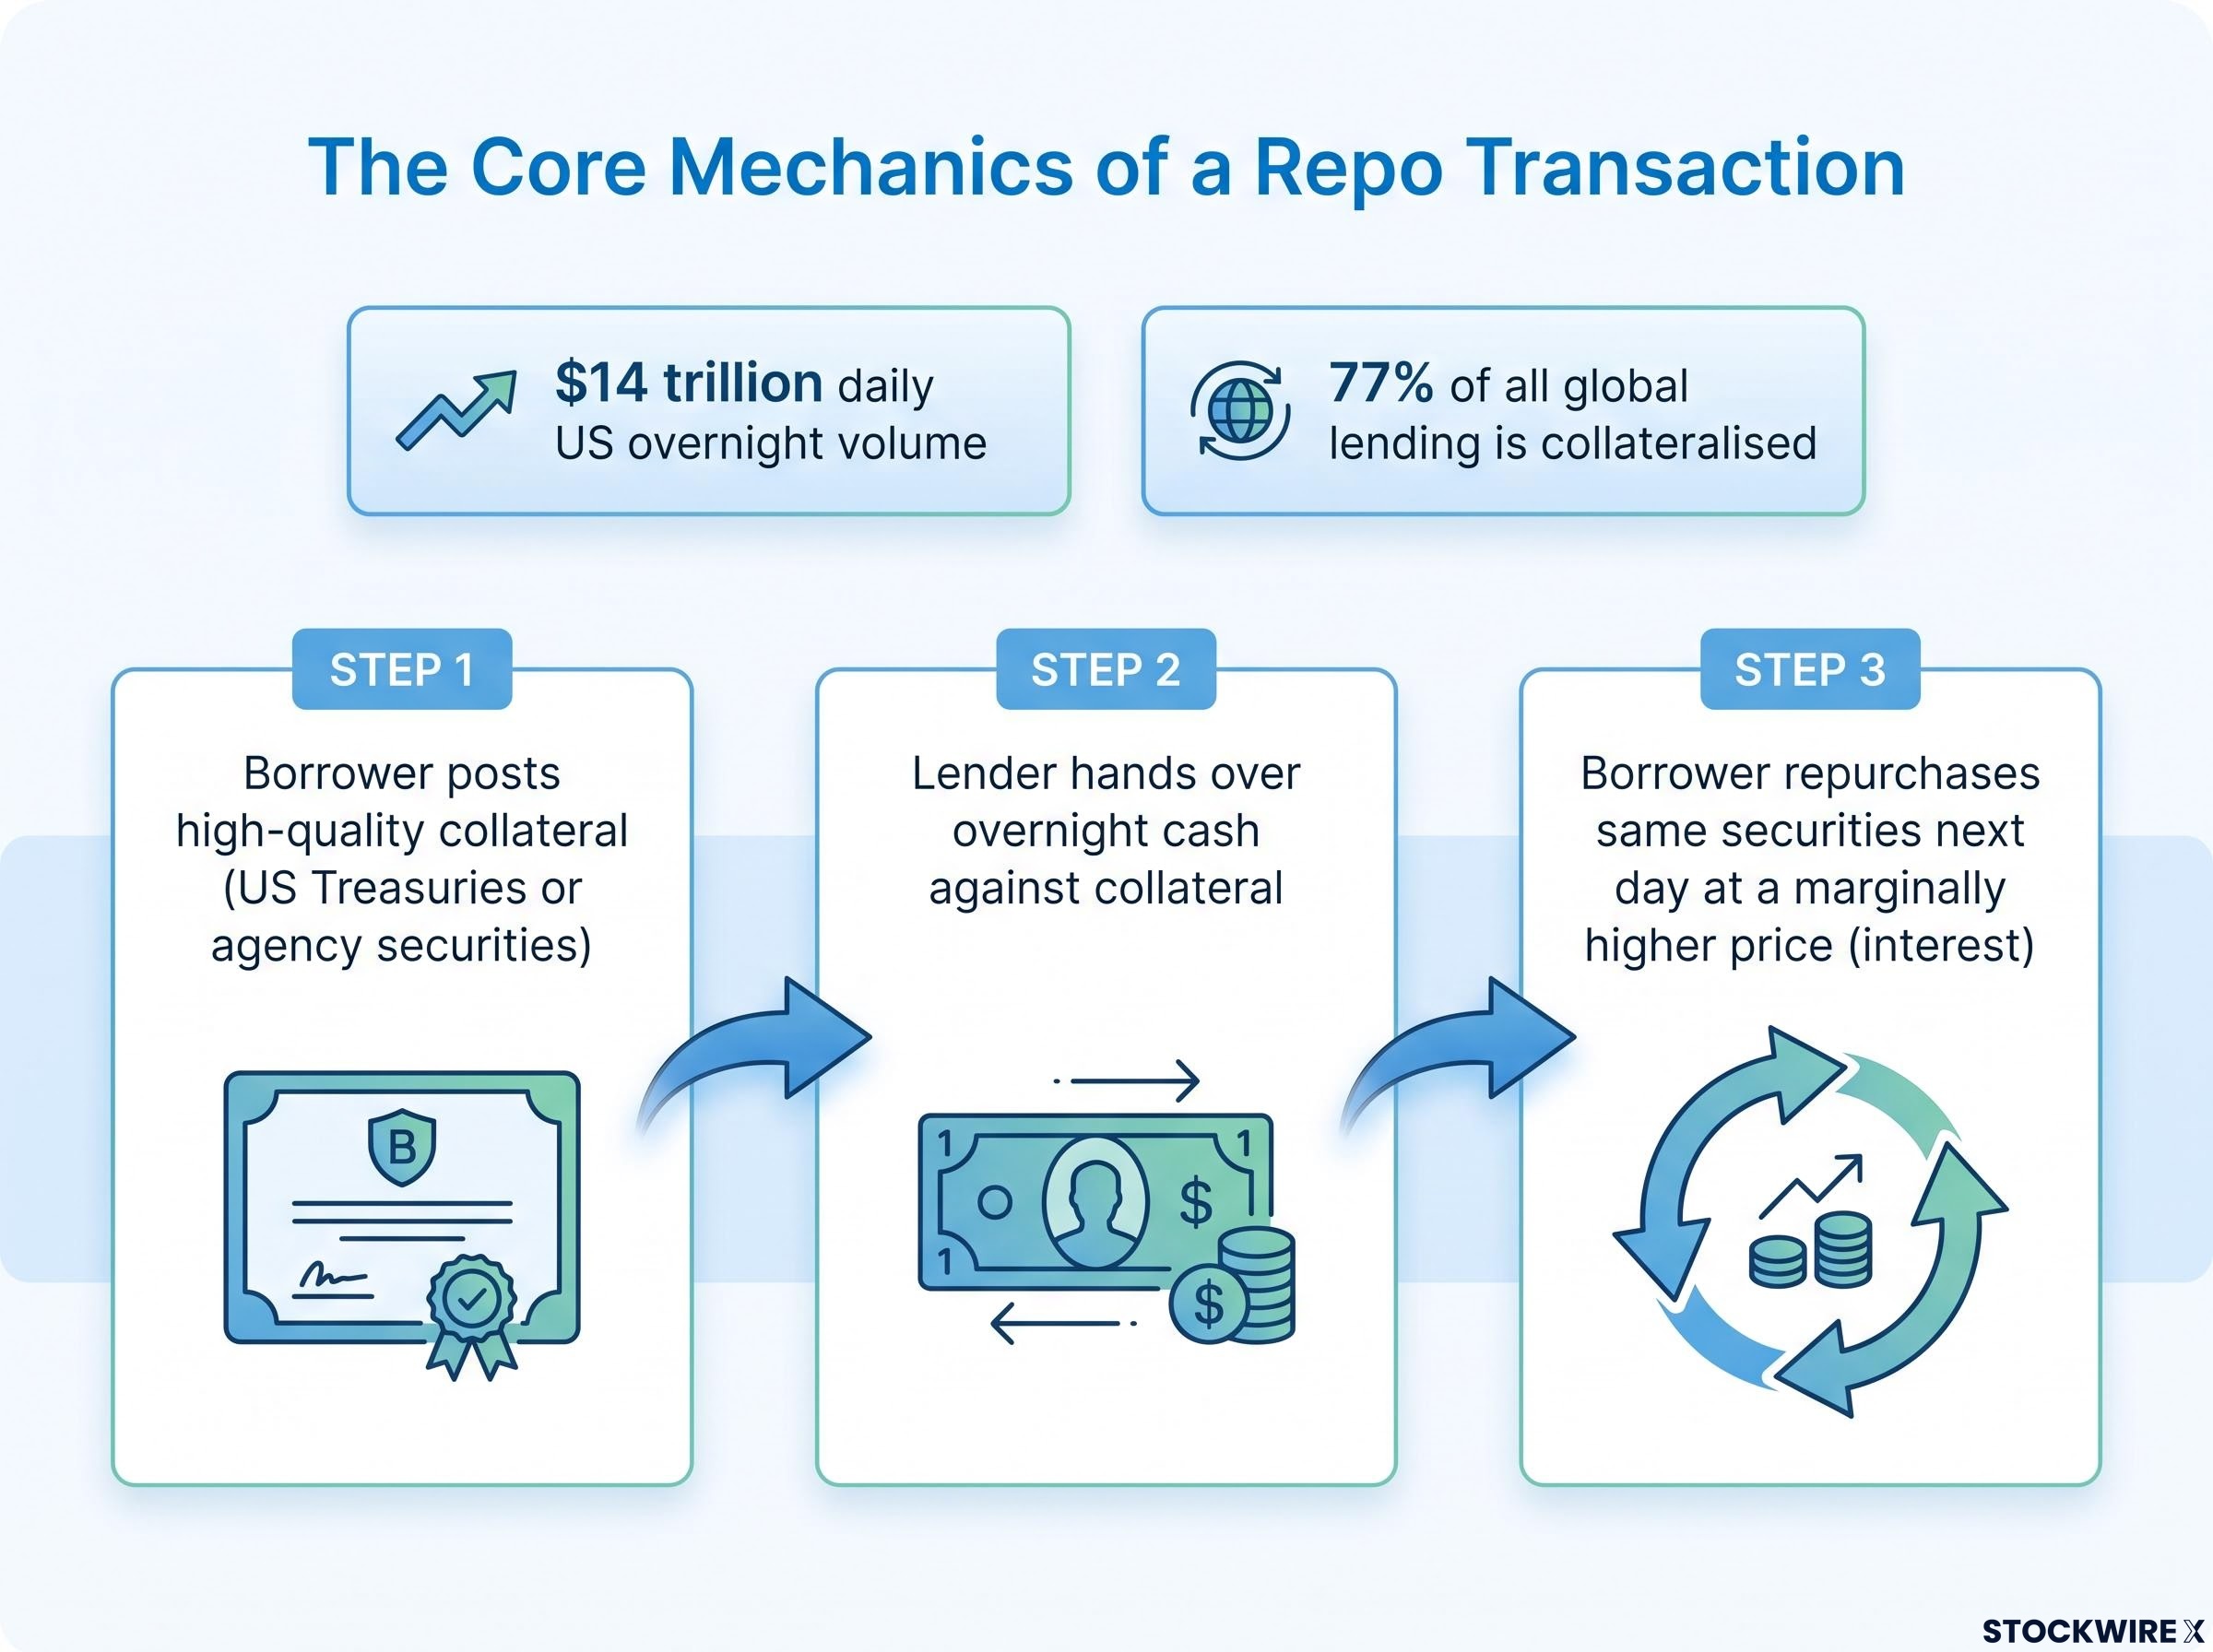
The scale is difficult to absorb. Estimates for the daily US repo market run to roughly $14 trillion in overnight volume, and even the more conservative figures are enormous.
This is not a niche instrument for specialists. It is the central artery through which short-term credit is created every single day, funding banks, dealers, and leveraged investors who need cash tonight and will pay it back tomorrow.
A repo transaction, short for repurchase agreement, is simpler than the size suggests. Three components define it:
The New York Fed’s framework for the Treasury repo market identifies dealers as the critical intermediaries who sit between cash providers and borrowers, a structural position that makes their own funding health inseparable from the system’s ability to function on any given day.
- The borrower posts high-quality collateral, typically US Treasuries or agency securities.
- The lender hands over overnight cash against that collateral.
- The borrower agrees to repurchase the same securities the next day at a marginally higher price, the difference being the interest.
The figures vary depending on what you count. Some research pegs total US repo exposures, including longer-dated term deals, at around $12.6 trillion in daily exposures in Q3 2025, while the overnight Treasury segment that feeds the benchmark rate calculation sits closer to $3 trillion per day. The exact number matters less than the structure it describes.
Roughly 77% of all global lending is now collateralised, according to World Bank data. The system runs on posted assets, not trust.
Why “overnight” changes everything
Here is the part that turns size into fragility. The vulnerability is not the $14 trillion figure. It is the word “overnight.”
Term funding, borrowed for weeks or months, gives a borrower breathing room. If a lender pulls back, there is time to arrange an alternative.
Overnight funding gives you until the next morning. Every participant must roll their borrowing forward each day, and if the cash does not appear, the only option is to sell the collateral immediately.
That is why the 2019 spike unfolded in hours rather than weeks. When the mechanism operates on a 24-hour cycle, so does the crisis. What looks like a stable, fully collateralised system can seize inside a single business day, and that speed is the documented mechanism behind every major liquidity crisis since 2000.
When big ASX news breaks, our subscribers know first
Why the debt-to-liquidity ratio is the metric that actually matters
You have probably seen debt-to-GDP figures quoted as the ultimate measure of financial danger. It is the wrong lens, and the reason why is instructive.
The analytical framework developed by CrossBorder Capital points to a different diagnostic: the debt-to-liquidity ratio. This compares the stock of debt not to the size of the economy, but to the supply of liquidity available to refinance it.
Consider the countries that should already be in crisis if debt-to-GDP were the trigger.
The debt-to-liquidity framework sits on a foundation that debt-to-GDP limitations make necessary: Japan has carried debt near 400% of GDP for years without a funding seizure, demonstrating that the ratio tells you almost nothing about when a crisis actually arrives.
| Country | Approx. debt-to-GDP | Repo-triggered crisis to date? |
|---|---|---|
| Japan | ~400% | No |
| China | ~350% | No |
| United States | ~200% | No |
Japan has carried a debt load near 400% of GDP for years without a debt-driven seizure. China sits around 350%, the US near 200%, and none has triggered a repo crisis on that basis alone.
The reason is the denominator. As long as the supply of liquidity keeps pace with the obligations that need refinancing, high debt levels can persist indefinitely.
Historically, crises arrive not when debt is high, but when the debt-to-liquidity ratio spikes sharply upward. That is the common thread. For you, this reframe changes what you watch: not headline deficit projections, but whether the supply of high-quality liquid assets is keeping up with the growth of collateralised obligations.
What the liquidity denominator actually measures
The liquidity denominator captures the assets that can be turned into cash quickly, or pledged as repo collateral, without losing value. That means bank reserves, Treasury bills, and access to central bank facilities.
When that supply shrinks, the arithmetic turns dangerous even at moderate debt levels. Quantitative tightening, where the Fed shrinks its balance sheet, drains reserves. Heavy Treasury bill issuance soaks up cash. Collateral hoarding during stress removes usable assets from circulation.
The lesson is that a stable-looking system can become fragile without the debt number changing at all. What moves is the liquidity beneath it.
The leverage architecture that turns a hiccup into a seizure
The fragility is built in layers, and each one stacks on the last. Start with the haircut.
A haircut is the discount a lender applies to posted collateral. A 2% haircut means you receive 98 cents of cash per dollar of Treasuries pledged, which allows leverage of up to 50 times on the securities you hold.
Now watch what happens when that number moves. A shift from a 2% to a 4% haircut does not sound dramatic, but it forces immediate, large-scale deleveraging across the whole system at once.
Then there is the Treasury basis trade, a structure that concentrates the risk. Hedge funds buy cash Treasuries, finance them in repo, and short Treasury futures, pocketing the small spread between the two. It is profitable in calm markets and destabilising the moment volatility rises, because higher volatility means bigger margin calls on the futures leg.
The concentration figures are the part that should give you pause.
The ECB Macroprudential Bulletin (January 2025) estimated that relative-value hedge funds carry gross repo borrowing of 20 times their net asset value, and more than 37 times their cash holdings. These figures are reported but not independently confirmed.
Reuters reported in December 2025 that roughly 70% of hedge-fund bilateral repos in dollars carry a zero haircut, which permits almost unlimited leverage. The Bank of England found in September 2025 that a small number of hedge funds account for around 90% of net gilt repo borrowing. The FSOC 2025 Annual Report put overall hedge-fund leverage at a new high of 2.6 times by mid-2025. Each of these figures is drawn from reporting that has not been independently verified.
Margin debt concentration across the broader leveraged investor base reinforces the repo fragility picture: at a record $1.416 trillion in May 2026 and growing at roughly 2.5 times the pace of S&P 500 returns, the aggregate leverage that feeds repo demand is accumulating at a historically unusual speed.
Here is why it matters to you. When zero-haircut borrowing meets 20-times gross leverage, you do not need a market crash to start a fire. A modest tightening of funding conditions is enough to force selling, and the selling produces the very volatility the funds were exposed to. The cascade runs like this:
- A stress event pushes haircuts higher.
- Higher haircuts and margin calls hit leveraged positions.
- Funds dump Treasuries to raise cash.
- The selling spikes bond volatility.
- Rising volatility pushes haircuts higher still, and the loop repeats.

Rollover risk and money market fund fragility
Money market funds sit on the other side of this. They are a primary source of the cash that flows into repo, lending heavily to dealers and leveraged funds.
The problem is a mismatch. Money market funds promise investors daily liquidity, yet hold assets that can be difficult to sell quickly in a stressed market, which leaves them exposed to runs.
In a stress event, that fragility works both ways. Money market fund withdrawals tighten funding for dealers and leveraged funds at the same moment, squeezing the supply of repo cash exactly when demand for it is highest.
Two indicators that tell you stress is building before the headlines do
You do not need institutional data access to watch this market. Two publicly available indicators do most of the work, and understanding them puts a genuine early-warning tool in your hands.
The first is the spread between the Secured Overnight Financing Rate (SOFR) and the Federal Funds Rate. SOFR reflects the actual cost of borrowing cash against Treasuries in the repo market. When it drifts above the Fed’s policy rate, it signals that repo funding is tightening faster than policy intends.
The second is the MOVE Index, which measures expected volatility in US Treasury yields. Think of it as the bond market’s equivalent of the VIX. It matters because bond volatility is the direct channel through which repo stress transmits into every asset priced off Treasuries.
Term premium dynamics have become an increasingly important input to the MOVE Index readings that drive repo stress: the 30-year Treasury yield’s rise to 5.311% in August 2026 was predominantly a fiscal supply and risk-premium story rather than an inflation-expectations story, which means the mechanism transmitting bond volatility into repo funding costs is operating through a different channel than prior cycles.
| Indicator | Recent reading | Interpretation |
|---|---|---|
| SOFR vs Fed Funds spread | SOFR 3.70%, EFFR 3.64%, spread +6.0bps (March 2026) | Above normal, watch closely |
| MOVE Index | 76.14, up 4.16% from 73.10 (September 2026) | Elevated but not alarming |
The snapshot figures above, drawn from FinExus (March 2026) and ICE BofAML data (September 2026), are reported but not independently confirmed. Use them as illustrations of how to read the levels, not as fixed thresholds.
A simple three-tier framework helps you interpret both:
- Normal: SOFR sits at or just below Fed Funds, and the MOVE Index reads in its long-run range.
- Watch closely: the SOFR spread turns positive by several basis points, or the MOVE Index climbs steadily.
- Alarm: the spread widens sharply while the MOVE Index rises at the same time.
On 17 September 2019, intraday repo rates rose more than 300 basis points above the Fed funds target, with some trades reaching 10%. That is what an alarm-level reading eventually became.
The interpretive point is the one to keep. When the SOFR-Fed Funds spread widens and the MOVE Index rises together, you are watching a funding market tightening faster than policy is loosening. That combination is the historical fingerprint of the conditions preceding a repo seizure, which is why Fed Chair Jerome Powell has repeatedly stressed, at Jackson Hole and in FOMC press conferences, the importance of keeping money market liquidity and bank reserves adequate.
What the Fed’s backstops can and cannot fix
The honest answer is that the system has real shock absorbers it lacked in 2008. It also has a structural problem those absorbers cannot touch.
The Standing Repo Facility (SRF) is the Fed’s main post-2019 backstop. It lets eligible institutions borrow cash against Treasuries on demand, capping how high repo rates can spike. It reduces rollover risk, but it does not remove it, because access and stigma still shape who uses it and when.
The New York Fed’s Standing Repo Facility FAQ sets out the operational parameters in detail, including the eligible counterparties, securities accepted as collateral, and the rate structure that is designed to cap how far overnight repo rates can rise above the Fed’s policy target.
On the Treasury side, Secretary Scott Bessent’s approach has been described as “yield volatility control.” Rather than trying to move yield levels, the Treasury runs modest buyback operations aimed at calming the volatility backdrop, which is precisely what stabilises leveraged hedge-fund positions. The US Treasury launched its buyback programme on 1 May 2024, with weekly liquidity-support buybacks sized up to $4 billion per operation and quarterly caps near $30 billion, according to reporting that has not been independently confirmed.
The distinction that matters for you is what these tools reach and what they miss:
- What they can address: short-term rate spikes, acute funding squeezes, and the volatility backdrop that triggers margin calls.
- What they cannot address: the accumulation of leverage itself, the haircut dynamics that force liquidations, and money market fund fragility.
A 2024 IMF report warned that the concentration of short positions in US Treasury futures financed via repo threatens both US and global financial stability. The finding is reported but not independently confirmed.
Two camps, one market
This is where the experts genuinely split, and the disagreement is worth tracking.
One camp, including the BIS, ECB, Bank of England, and FSOC, views current leverage terms as fragile and rising. The other, reflected in the Fed’s own Financial Stability Reports from Spring 2025 through May 2026, classifies funding risks as “moderate” and broadly in line with historical norms, pointing to stronger bank capital, central clearing, and the SRF. Both characterisations rest on reporting that has not been independently confirmed.
Neither side is obviously wrong. And the disagreement is consequential, because the scale and speed of the policy response to the next stress event will depend heavily on which camp turns out to be right. The takeaway is not panic or comfort, but recognition that resilience and fragility can coexist. Each backstop activation works, and each one quietly raises the floor of intervention the system now depends on.
Watching the plumbing, not the headlines
Pull the threads together and the picture is clear. The Fed’s rate decisions matter, but the daily functioning of the repo market is the truer measure of whether the financial system is stable or under strain.
The pattern repeats. The September 2019 spike (a 300-plus basis point intraday surge), the March 2020 dislocation (which drew roughly $1 trillion in Fed Treasury purchases in Q1 2020), and the continued short-term rate pressure through late 2023 to 2025 all trace the same shape: a funding market tightening, a forced unwind, and a central bank stepping in.
You now have a monitoring posture that requires no institutional infrastructure:
- Track the SOFR-Fed Funds spread weekly.
- Watch the MOVE Index for rises that coincide with a widening spread.
- Follow Fed balance sheet data for signs of reserve scarcity.
Central banks fundamentally exist to protect the integrity of debt markets. Their interventions follow a predictable cycle: stress, intervention, moral hazard, and re-accumulated leverage. That cycle is itself the thing to track.
Because fiscal austerity is politically constrained and debt growth is structurally embedded, periodic repo stress is a feature of this regime rather than a passing concern. Structural analyst Lynn Alden frames the expansionary debt trajectory as politically difficult to reverse, which points to hard assets as a long-term hedge against monetary debasement, even as cash remains the dominant safe haven inside the acute crisis window itself.
For investors tracking how the leverage and debt dynamics described here interact with longer-term structural questions, our deep-dive into dollar reserve currency risk examines why hedge fund Treasury exposures of approximately $4 trillion make the repo market a live variable in any serious de-dollarisation scenario.
The question, then, is not whether repo stress will recur. It is whether you will see it building early enough to act, and the tools to do exactly that are now in your hands.
This article is for informational purposes only and should not be considered financial advice. Investors should conduct their own research and consult with financial professionals before making investment decisions. Past performance does not guarantee future results, and these statements are speculative and subject to change based on market developments.