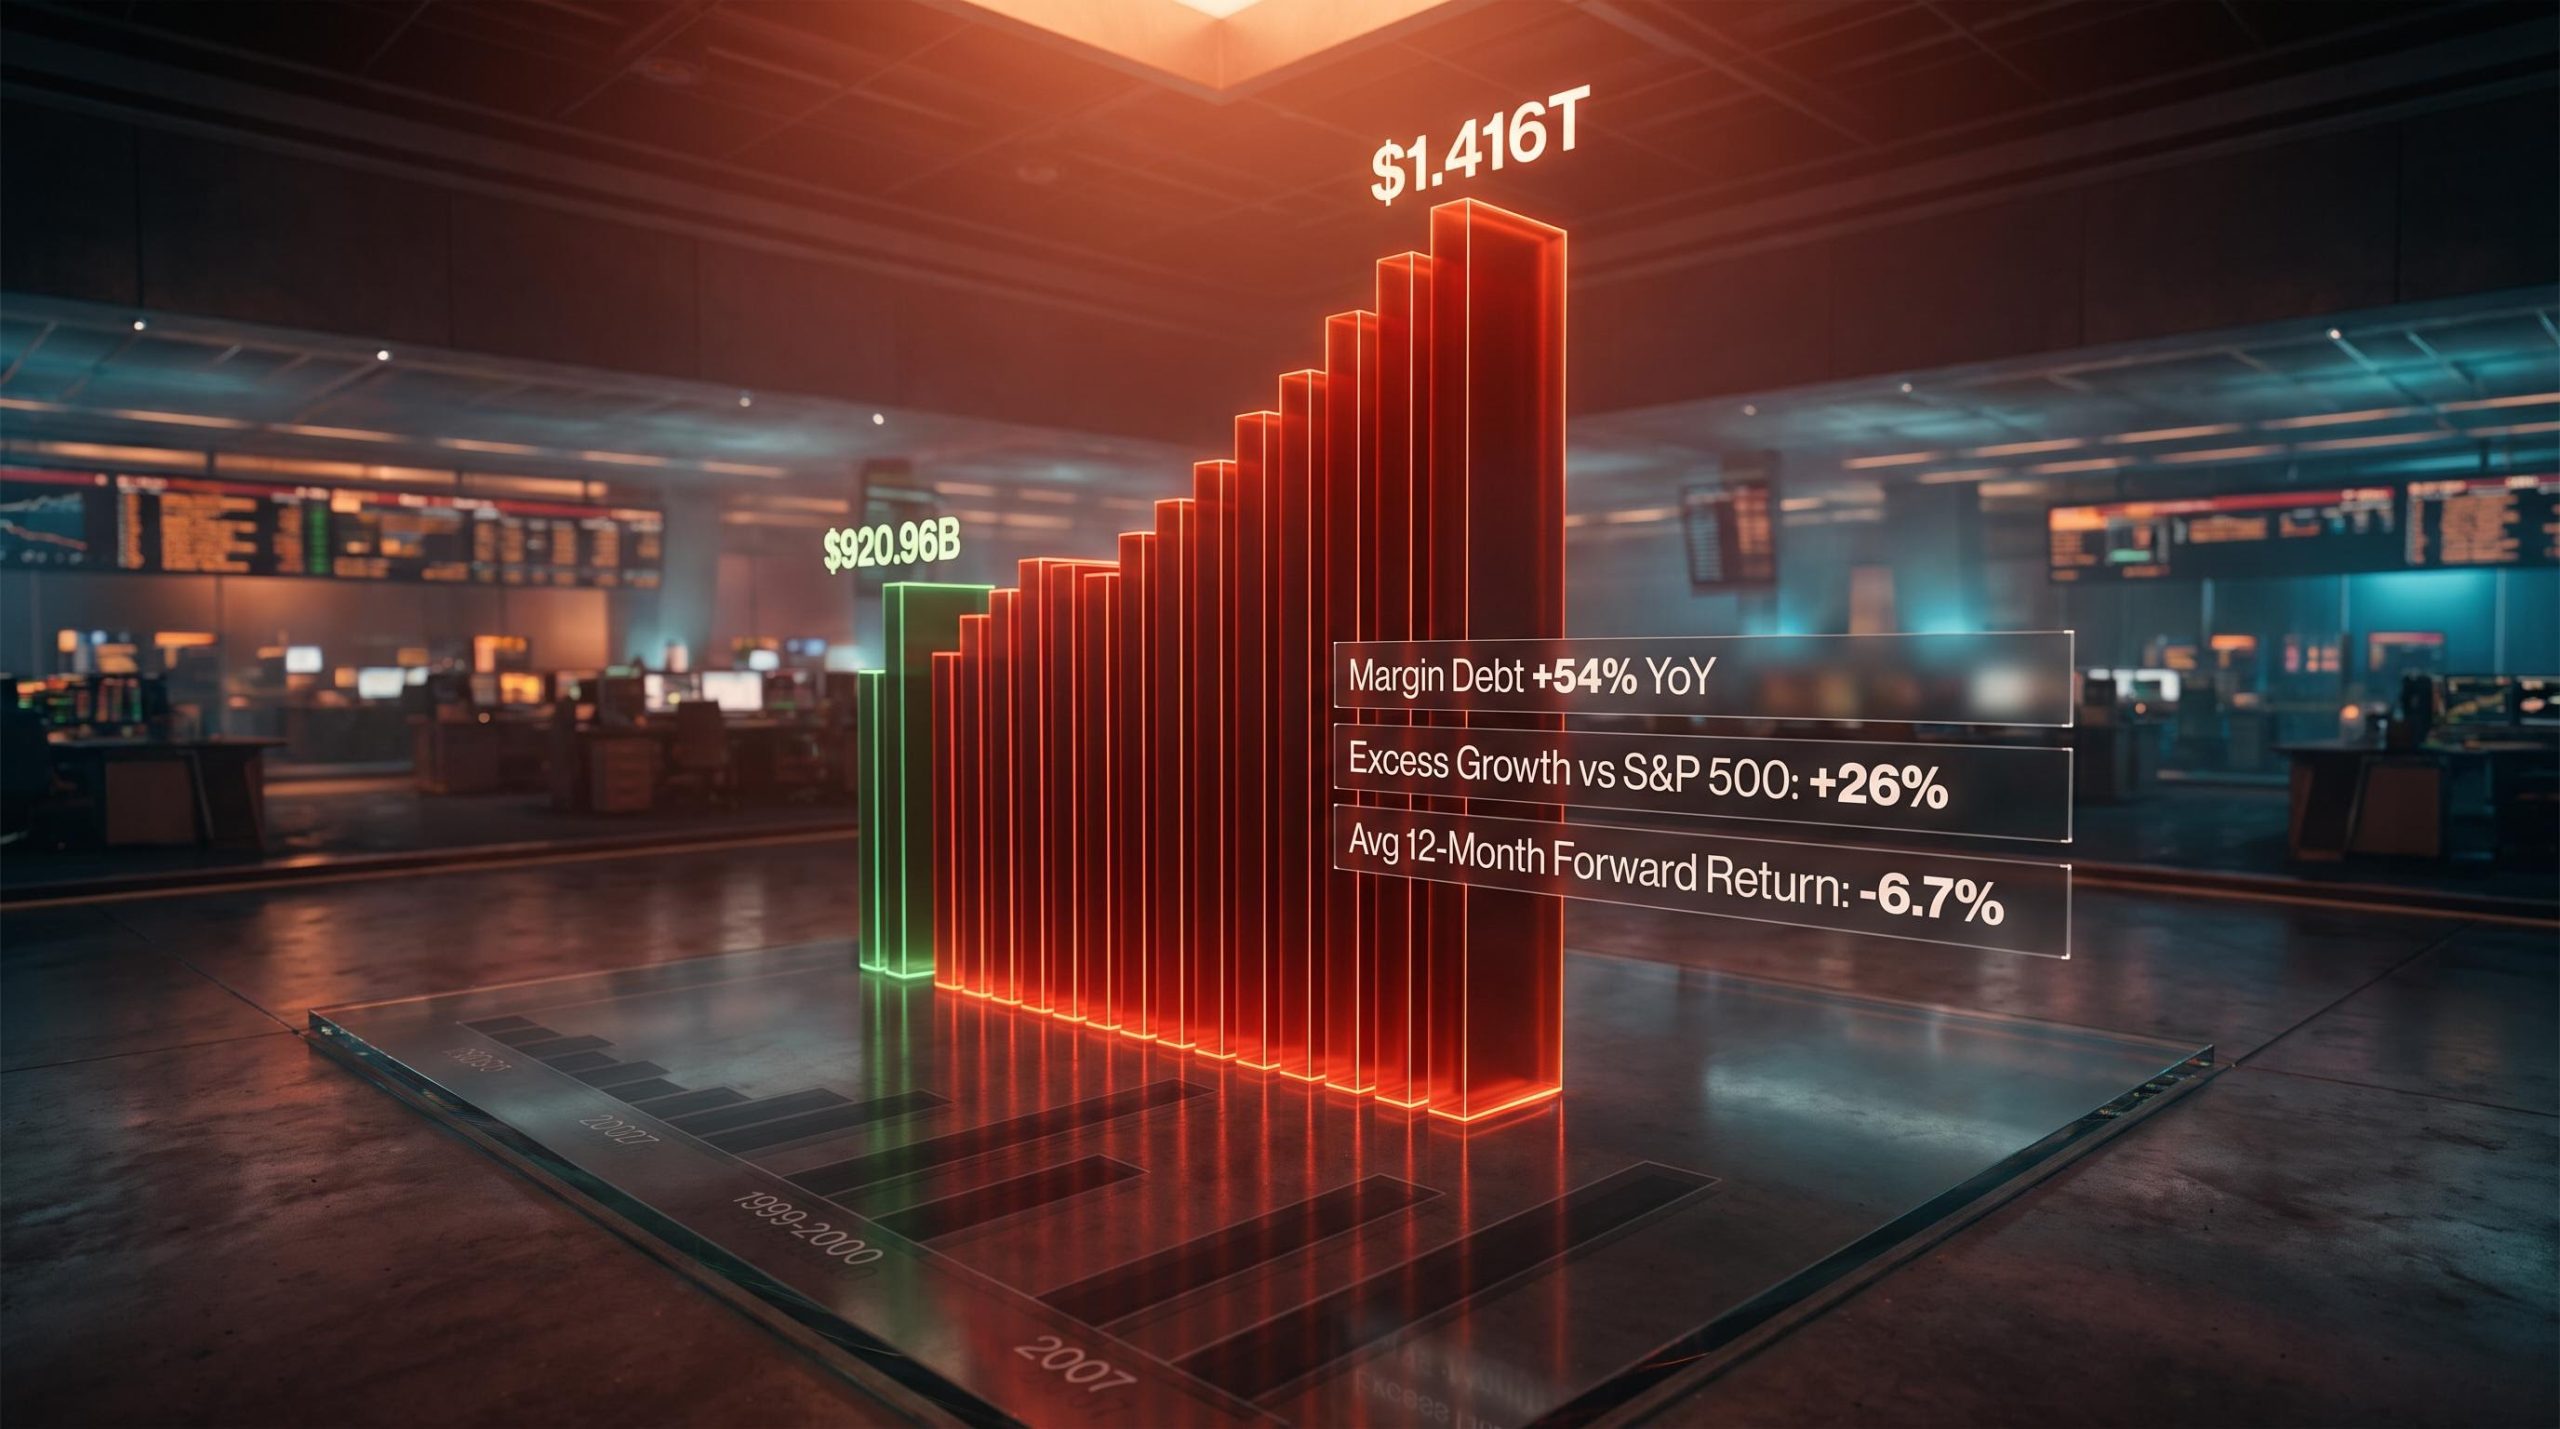
Margin debt just hit $1.416 trillion. That is up 54% in twelve months, according to FINRA data through May 2026, a pace roughly two and a half times faster than the S&P 500’s return over the same window. The arithmetic gap between how fast investors are borrowing and how fast their collateral is growing has only been this wide three times in the past twenty-five years.
The absolute level matters less than the speed. Borrowing against a portfolio is normal; borrowing at a rate that massively outpaces the portfolio’s gains is the condition that turns a routine pullback into something sharper. And that is exactly what the data shows right now.
Here is what the numbers actually tell you about where we sit in the cycle, what the historical pattern looks like when leverage runs this hot, and how to use the signal without overreacting to it. This is a framework for calibrating risk, not a call to sell everything.
The numbers behind the surge: what FINRA data shows for May 2026
The raw figures build a progressively uncomfortable picture. Start with the headline, then watch the pace come into focus:
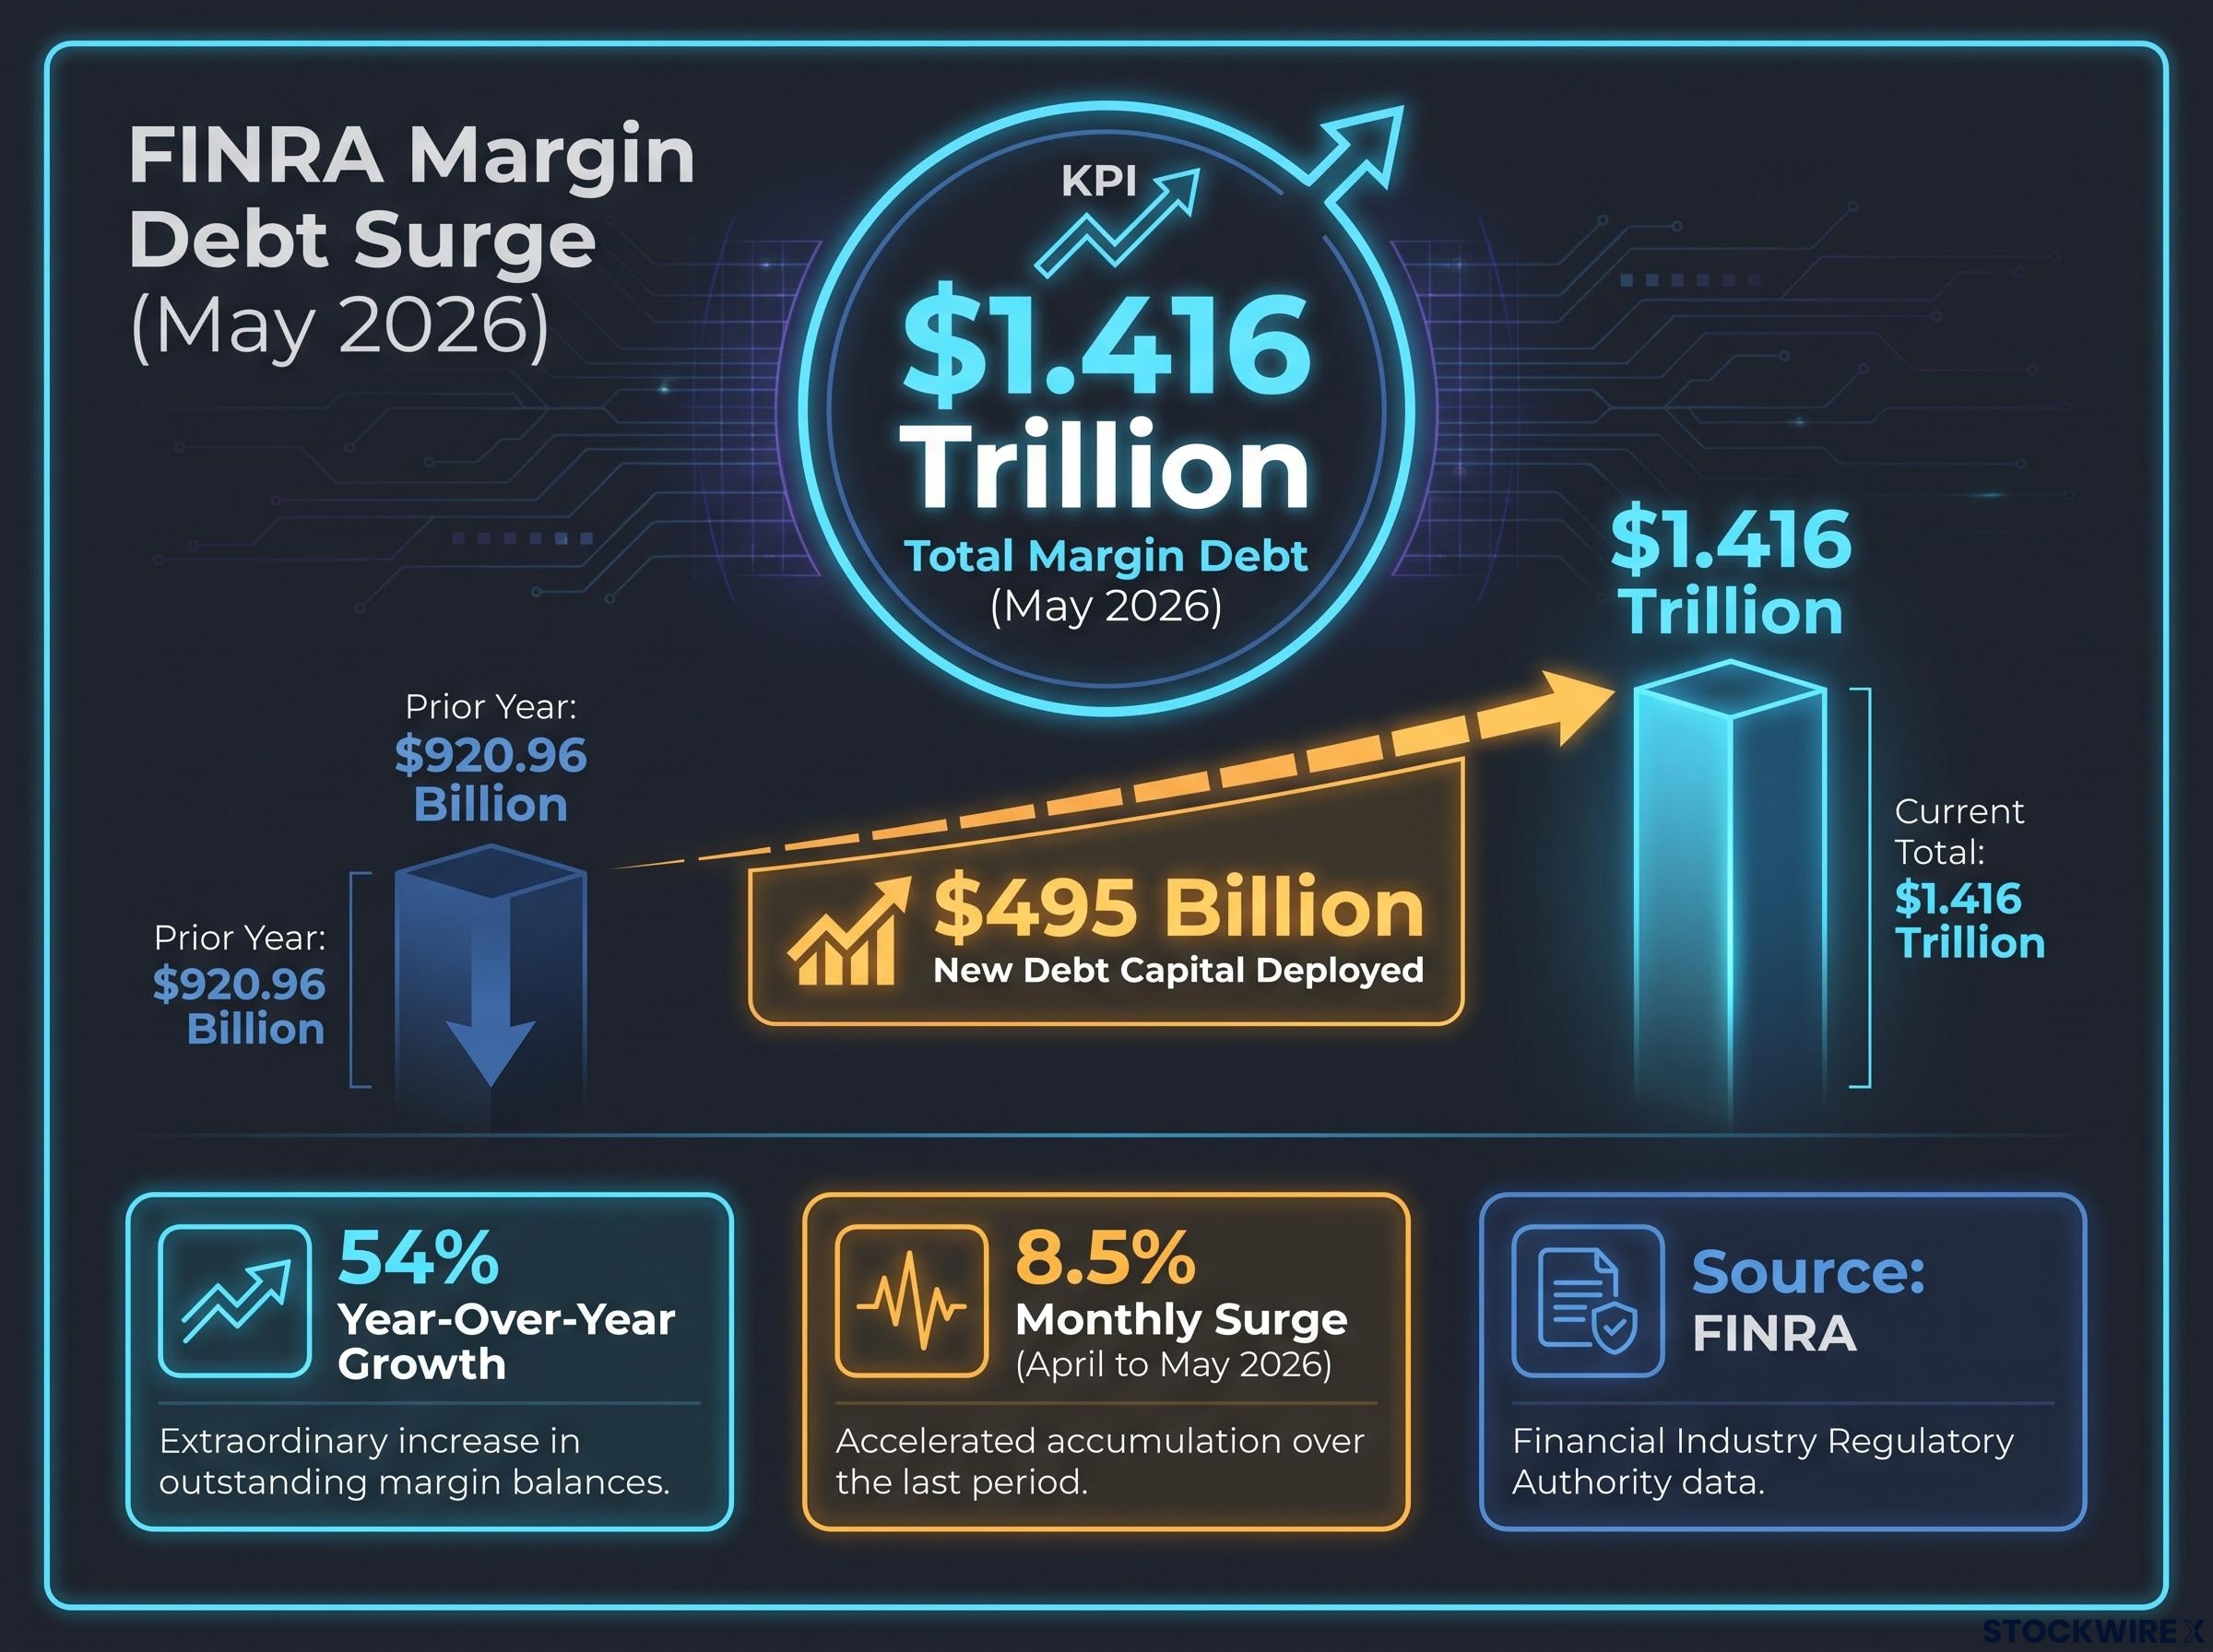
- Margin debt level: $1.416 trillion (May 2026, FINRA), the highest reading in the dataset back to 1997
- Prior year level: $920.96 billion
- Year-over-year growth: approximately 54%
- Monthly surge: margin debt rose 8.5% in a single month from April to May 2026
- New debt capital deployed: roughly $495 billion in additional borrowed money entered markets over twelve months
According to the Leuthold Group’s research, both the 54% absolute year-over-year margin debt growth figure and the excess growth measure breach the firm’s historically defined warning thresholds, levels that have been associated with weak forward returns in each prior comparable episode.
That $495 billion is not an abstraction. It is borrowed money that did not exist in the market a year ago, and it behaves differently from buy-and-hold equity. Every dollar of it is price-sensitive: if portfolio values fall, that capital does not sit patiently. It gets called back. The scale of new leveraged capital entering markets in this window is larger than the entire market capitalisation of most S&P 500 constituents.
The FINRA margin statistics are compiled monthly under Rule 4521(d), which requires member firms to report aggregate debit balances in securities margin accounts, making this dataset the authoritative baseline for any analysis of leverage conditions across U.S. equity markets.
When big ASX news breaks, our subscribers know first
How margin debt actually works, and why speed matters more than size
Margin borrowing is straightforward in theory: investors borrow from their broker, using existing holdings as collateral, to buy more securities. If the portfolio rises, the gains are amplified. If it falls, the losses are amplified too.
The danger is mechanical. When prices drop, leveraged investors hit loss thresholds sooner. Brokers issue margin calls, demanding more cash or forcing liquidation of positions. When this happens across many accounts simultaneously, it creates forced, price-insensitive selling. That forced selling pushes prices lower, which triggers more margin calls. The cycle feeds itself.
Federal Reserve Bank of New York research on leverage cycles documents precisely how deleveraging mechanisms and collateral runs amplify initial price declines into broader liquidity spirals, providing the academic framework that underpins the forced-selling cascade described here.
Why the Leuthold thresholds signal elevated risk
The analytically relevant variable is not how much margin debt exists but how fast it is growing relative to the market’s return.
| Metric | Current reading | Leuthold warning threshold | Status |
|---|---|---|---|
| Absolute YoY margin debt growth | 54% | Historically rare above 50% | Breached |
| Excess growth over market returns | 26% | 26% excess growth | Breached |
Including reinvested dividends, the S&P 500 posted total returns of roughly 22% over the trailing twelve months in question. Margin debt expanded at approximately 2.5 times that pace. The Leuthold Group’s framework focuses on precisely this gap: when debt growth massively outstrips market returns, investors collectively hold more debt than their gains justify. The collateral base underpinning all that borrowing is relatively thin compared to the debt sitting on top of it.
Both thresholds being breached simultaneously is historically unusual. Prior episodes show that the Leuthold Group’s warning metrics have typically not stayed elevated for long before the configuration shifted, meaning the current setup has historically resolved, one way or another, rather than persisting indefinitely.
Three moments this century when margin debt looked the same
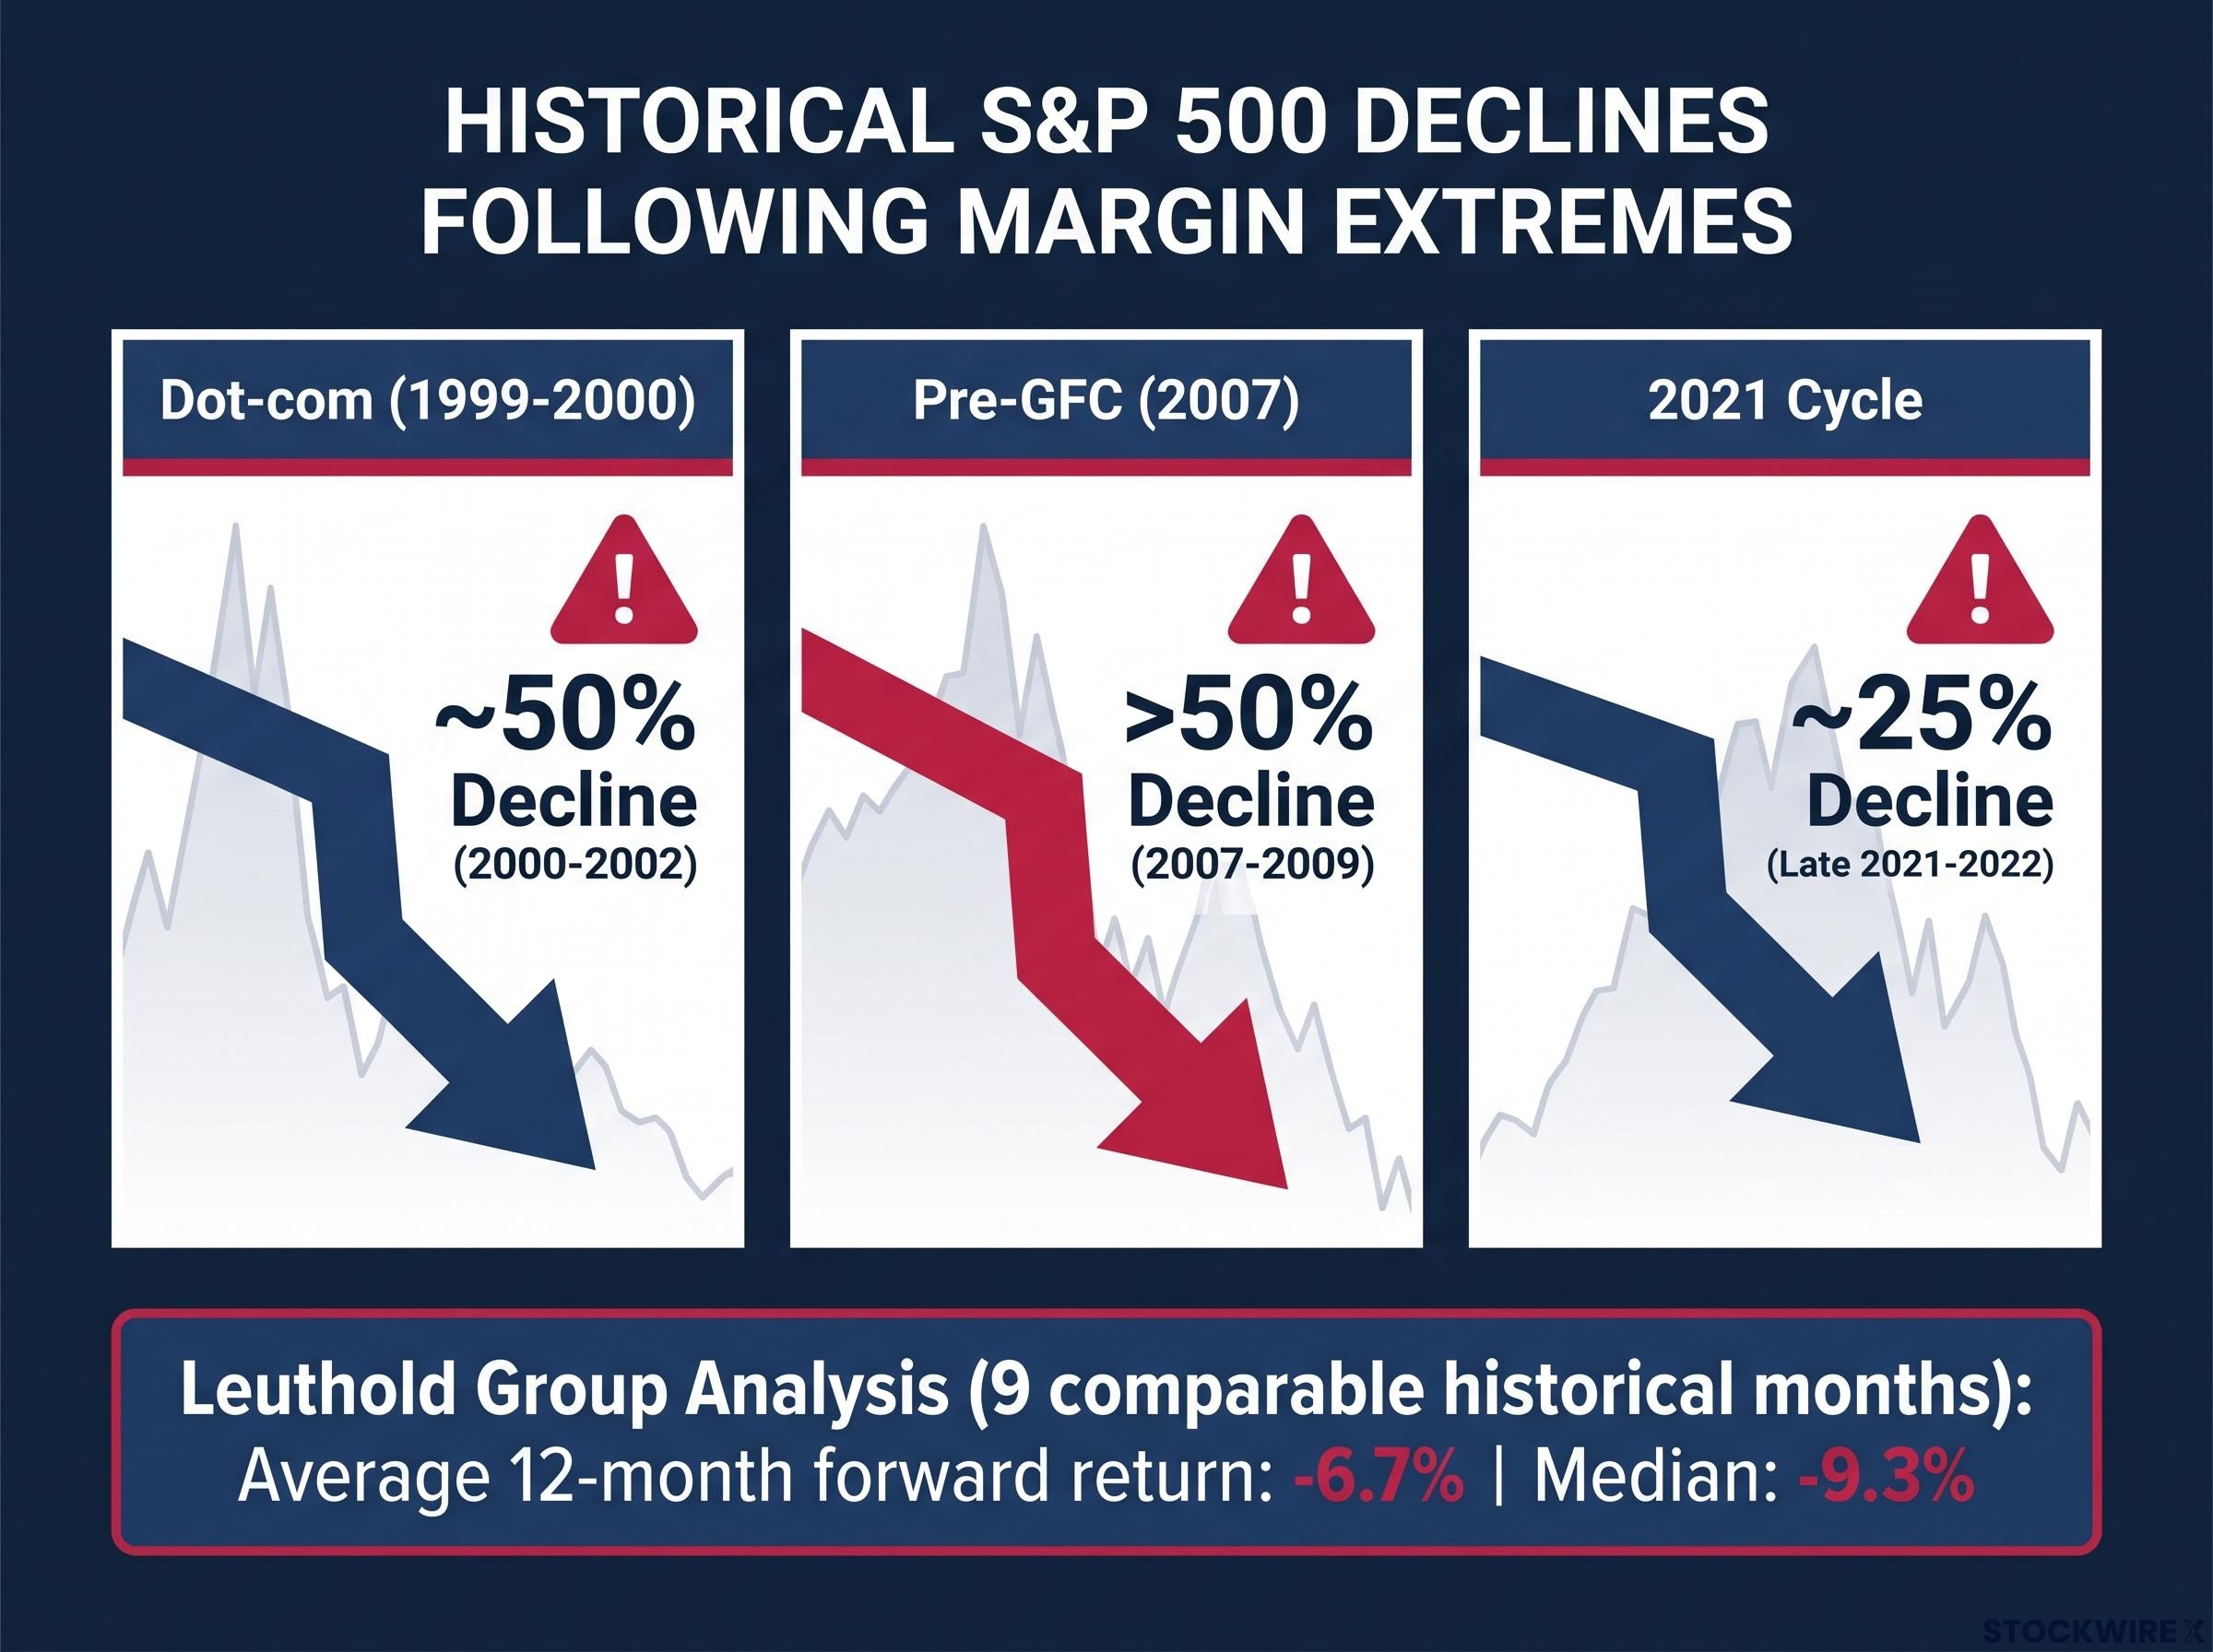
The Leuthold Group identified only three prior clusters where margin debt growth reached a comparable profile: late 1999-2000, mid-2007, and spring 2021. Each episode carried a distinct macro backdrop, but the leverage dynamics shared the same structure.
| Episode | Approximate peak margin debt growth | Subsequent S&P 500 peak-to-trough decline | Timeframe of decline |
|---|---|---|---|
| Dot-com (1999-2000) | Comparable to current levels | ~50% | 2000-2002 |
| Pre-GFC (2007) | Comparable to current levels | >50% | 2007-2009 |
| 2021 cycle | Comparable to current levels | ~25% (growth stocks fell further) | Late 2021-2022 |
The pattern that emerges is not subtle. In 2000, the S&P 500 lost roughly half its value in the bear market that followed. In 2007, it lost more than half from peak to trough during the global financial crisis. In 2021, margin debt peaked in autumn, a few months ahead of a roughly 25% drawdown in the index and significantly steeper declines in growth and technology stocks.
Across nine historical months with comparable extreme margin debt growth, the average 12-month forward S&P 500 return was approximately -6.7%, with a median of -9.3%.
The sample is small, and that matters. Nine months of comparable data is not a statistically overwhelming dataset. But the consistency of direction is what the Leuthold Group and independent researchers treat as analytically significant: every comparable prior episode saw the probability-weighted forward outcome turn negative. That changes the risk calculus for how much exposure to carry at current levels.
Leveraged ETFs nearly doubled in two months: a second signal pointing the same way
Margin debt is not the only indicator flashing. A parallel surge in leveraged exchange-traded funds (ETFs), products designed to deliver 2x or 3x the daily move of an index, points in the same direction from a completely different part of the market.
Key characteristics of leveraged ETFs versus traditional margin:
- Instrument type: packaged fund products versus direct broker lending
- Reset frequency: leveraged ETFs rebalance daily, which creates volatility decay (gradual value erosion in choppy markets) over longer holding periods
- Risk profile: amplify both gains and losses by their stated multiple on a daily basis
- Typical user: predominantly short-term, speculative traders rather than long-term holders
Leuthold Group data showed that across a two-month window in spring 2026, total assets held in leveraged ETF products approximately doubled in size. Concurrent with that, trading in options tied to leveraged ETF products also surged.
The doubling of leveraged ETF assets in two months compounds a structural problem that operates independently of market direction: volatility drag erodes the value of these products even when the underlying index is flat, because percentage losses require proportionally larger gains to recover on a daily-resetting capital base.
What it means when multiple leverage signals converge
The margin debt surge and the leveraged ETF expansion are two independent readings of the same underlying condition: elevated speculative appetite distributed across multiple instruments simultaneously. Margin debt up 54% year-over-year, leveraged ETF assets up approximately 100% in two months. Two instruments, one directional signal.
This matters for systemic risk even if you personally do not use margin or leveraged ETFs. Cascading selloffs tend to be deeper when leverage is distributed across multiple instruments, because forced selling can originate from more locations simultaneously. In a sharp drawdown, the amplified volatility from leveraged ETF rebalancing compounds alongside margin call liquidations, creating selling pressure that affects the entire market, including unleveraged positions.
What margin debt does not tell you, and why that matters as much as what it does
The signal is real, but it has boundaries. Understanding where those boundaries sit is what separates useful risk awareness from reactive market-timing:
- Timing imprecision: rapid margin debt growth has preceded weak 12-month returns historically, but peaks and subsequent downturns do not align with predictable lags. The 1999 reading preceded a decline by months; the 2021 reading by weeks.
- Small historical sample: nine comparable months over a quarter-century provide a consistent directional pattern but limited statistical confidence. The pattern may hold again, or this cycle’s macro conditions may produce a different outcome.
- Macro dependency: earnings trajectory, interest rate environment, credit spreads, and policy responses can moderate or amplify how leverage-related vulnerabilities play out. The same leverage configuration in a strong earnings cycle may resolve differently than in a weakening one.
The Leuthold Group frames these as warning thresholds, not predictive triggers. The distinction matters: the data describes the risk environment with elevated precision, but it does not specify the timing or magnitude of what follows.
The limitations do not neutralise the signal. They define the precision with which you should act on it. This is one input among fundamentals, valuations, credit conditions, and your own investment goals. Treating it as anything more, or dismissing it entirely, both represent calibration errors.
Adjusting for risk without calling the top
The data does not demand an exit. It demands that you know exactly how exposed you are before volatility arrives, because a margin call during a selloff removes decision-making from your hands entirely.
Four risk management considerations worth evaluating against your own situation:
- Audit your own leverage: if you are using margin, options, or leveraged ETFs, define clear loss limits and stress-test scenarios now, before a correction forces the decision under pressure.
- Assess portfolio volatility exposure: review whether high-beta, speculative, or concentrated positions still match your actual risk tolerance, or whether a rising market has drifted your allocation beyond your comfort zone.
- Strengthen resilience through diversification and liquidity: trimming outsized risk positions, improving diversification, and ensuring adequate defensive allocation costs relatively little in a rising market and matters enormously in a falling one.
- Use margin debt data as one input among several: no single indicator, including this one, should drive major allocation decisions without corroboration.
Combining margin debt data with other indicators
The complementary signals worth monitoring alongside leverage data include earnings trajectory, credit spreads, valuation metrics such as forward price-to-earnings ratios, and your own investment time horizon. When multiple indicators align in the same direction, the combined signal carries more weight than any individual reading. When they diverge, patience and further research are more productive than binary positioning.
Equity sentiment indicators from Goldman Sachs registered similarly cautionary readings in May 2026, with the firm’s U.S. Equity Sentiment Indicator hitting 1.7, a level historically associated with below-average S&P 500 returns over the following two to eight weeks, corroborating the leverage data from an independent sentiment-based framework.
This article is for informational purposes only and should not be considered financial advice. Investors should conduct their own research and consult with financial professionals before making investment decisions.
Past performance does not guarantee future results. Financial projections are subject to market conditions and various risk factors.
What a 54% leverage surge signals about where we are in the cycle
Three analytical threads converge at the same point:
- Record margin debt with extreme growth: $1.4 trillion in outstanding margin debt, 54% year-over-year growth, and 26% excess growth over market returns, both breaching the Leuthold Group’s warning thresholds
- Leuthold threshold breaches with consistent historical precedent: the only three prior episodes with comparable readings preceded the dot-com crash, the global financial crisis, and the 2022 drawdown, with an average 12-month forward return of -6.7%
- Corroborating leveraged ETF expansion: assets in leveraged products nearly doubling in two months, confirming that speculative appetite is elevated across multiple instruments, not isolated to traditional margin accounts
In the Leuthold Group’s historical analysis, readings at this level of both warning metrics have consistently given way within a relatively short timeframe rather than becoming the new normal. The data does not support the assumption that such elevated readings can be maintained indefinitely.
What the data tells you is not what will happen next. It tells you where you are: the market is currently configured the way it has been configured at previous late-cycle peaks. That awareness alone is a material advantage. Investors who understand the risk environment can calibrate their exposure, stress-test their positions, and make deliberate choices. Investors who are not monitoring it will discover the leverage problem only when the margin calls arrive.
For readers wanting to understand the long-run mathematical case for loss avoidance over return-chasing, our full explainer on defensive investing examines how a fund that never ranked in the top quarter in any single year still finished in the top 4% over 14 years through consistent drawdown discipline.
The signal describes the risk posture, not the destiny. Use it accordingly.