Your stock just moved 9% on earnings. The VIX is sitting at 15. Neither of those facts is wrong, and together they are telling you something important about how modern markets actually work.
The instinct is to treat a calm VIX as a signal that everything is fine, but that reading has become structurally misleading. A specific set of options market mechanics, driven by the enormous scale of structured product issuance and zero-day-to-expiration trading, now actively suppresses volatility at the index level while leaving individual stocks entirely exposed.
This piece walks through the mechanics step by step, from why the VIX measures what it measures, to how dealer hedging pins the S&P 500, to what elevated skew actually signals about the reliability of market flows. After this, the data your brokerage shows you will read differently, and you will understand why the gap between these two realities matters for anyone trying to make sense of portfolio behaviour in 2026.
The VIX is not broken, it is just measuring the wrong thing for your portfolio
You watch a name in your portfolio gap up or down double digits on a single print, then you glance at the VIX and it barely twitched. That mismatch feels like one of the two readings must be lying to you. Neither is.
The VIX is derived exclusively from S&P 500 index-level options pricing. It does not look at individual stock options, sector ETFs, or how much your specific holdings are diverging from one another. It measures the expected volatility of the index as a single blended object, and nothing else.
The VIX is itself a product of implied volatility, the market’s real-time collective expectation of future price movement magnitude extracted by reverse-engineering live options prices, a concept that underpins every number discussed in this article.
The CBOE VIX methodology confirms this narrowness explicitly: the index is constructed solely from S&P 500 index options, using a strip of near- and next-term puts and calls to extract a single forward-looking variance estimate for the index as a whole.
So when the VIX reads low, that is a factually accurate statement about index-implied volatility. It is not a misprint and it is not a broken instrument. It is simply answering a much narrower question than most investors assume they are asking when they check it.
Here is where the gap becomes visible in the numbers.
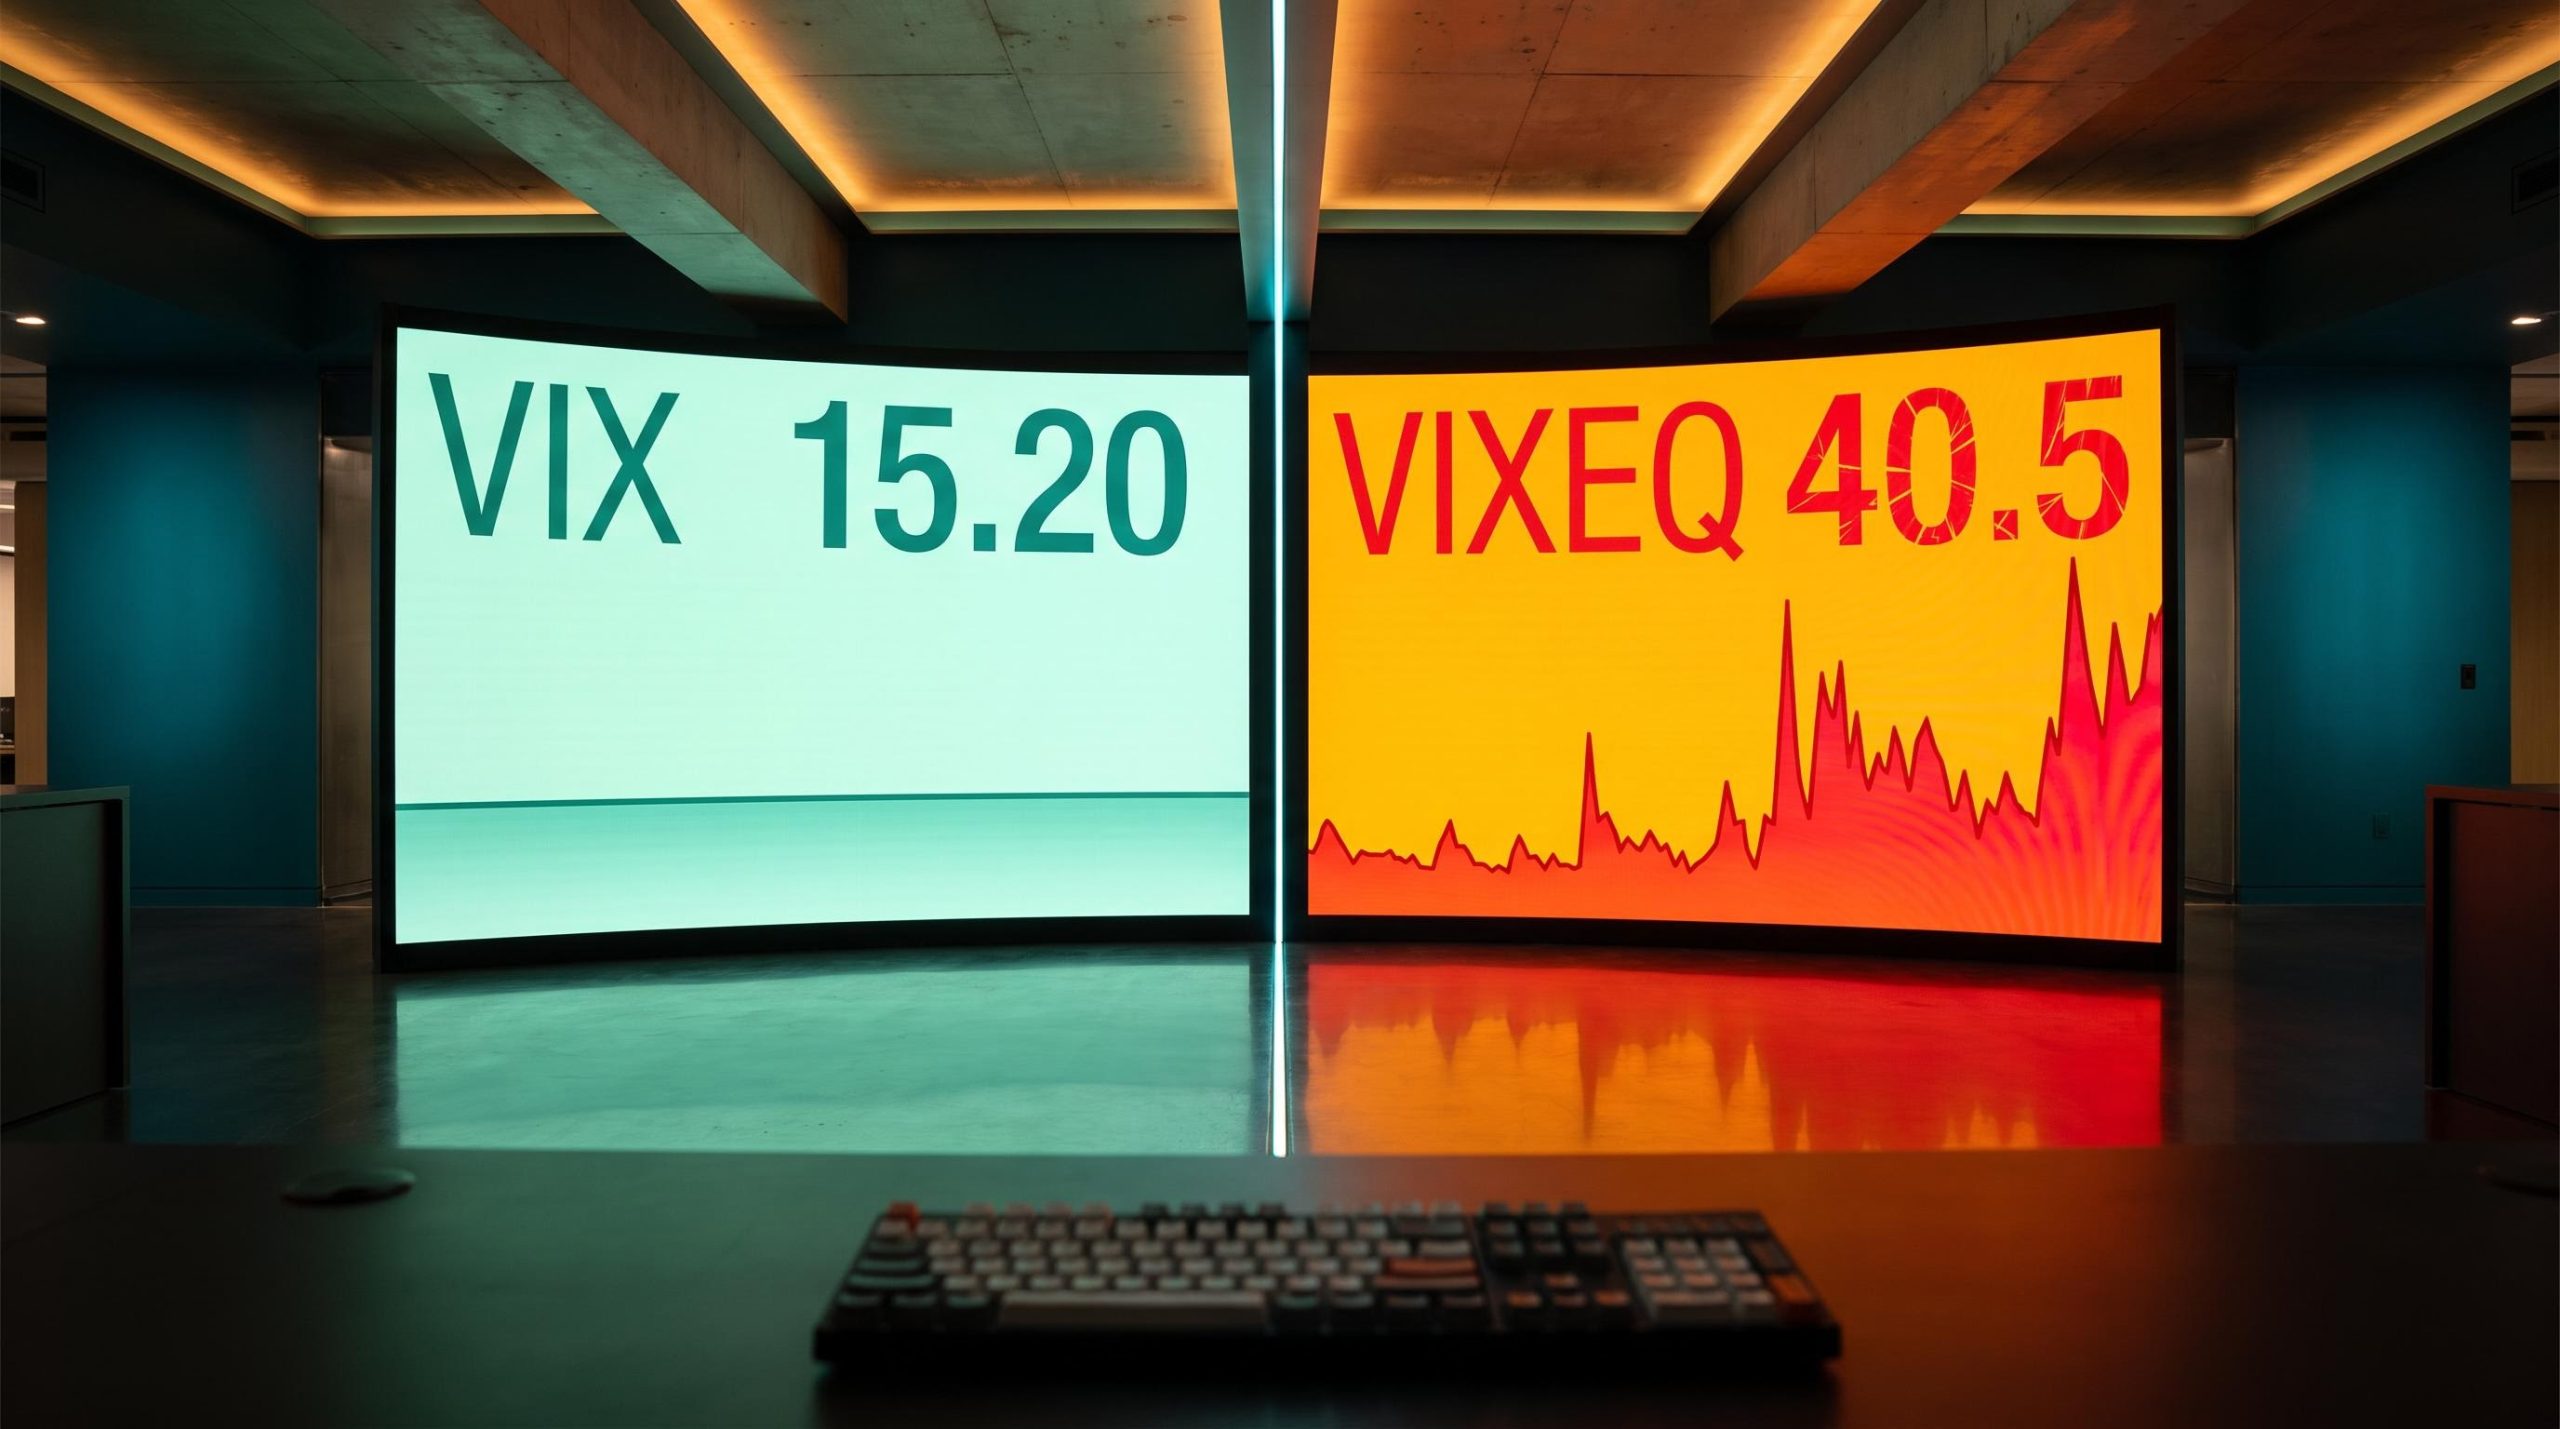
- The VIX closed at 15.20 as of 2 September 2026, a calm reading by any historical standard.
- The VIXEQ, which tracks implied single-stock volatility, sat at 40.5 in a JPMorgan Asset Management note dated 27 March 2026, running at more than double the index reading.
- Average single-stock daily volatility of roughly 1.7% has run at about double the S&P 500’s aggregate daily volatility of 0.8%.
- Average 3-month pairwise S&P 500 stock correlation sat at just 13%, lower than 98% of observations since 2022.
That last figure is the tell.
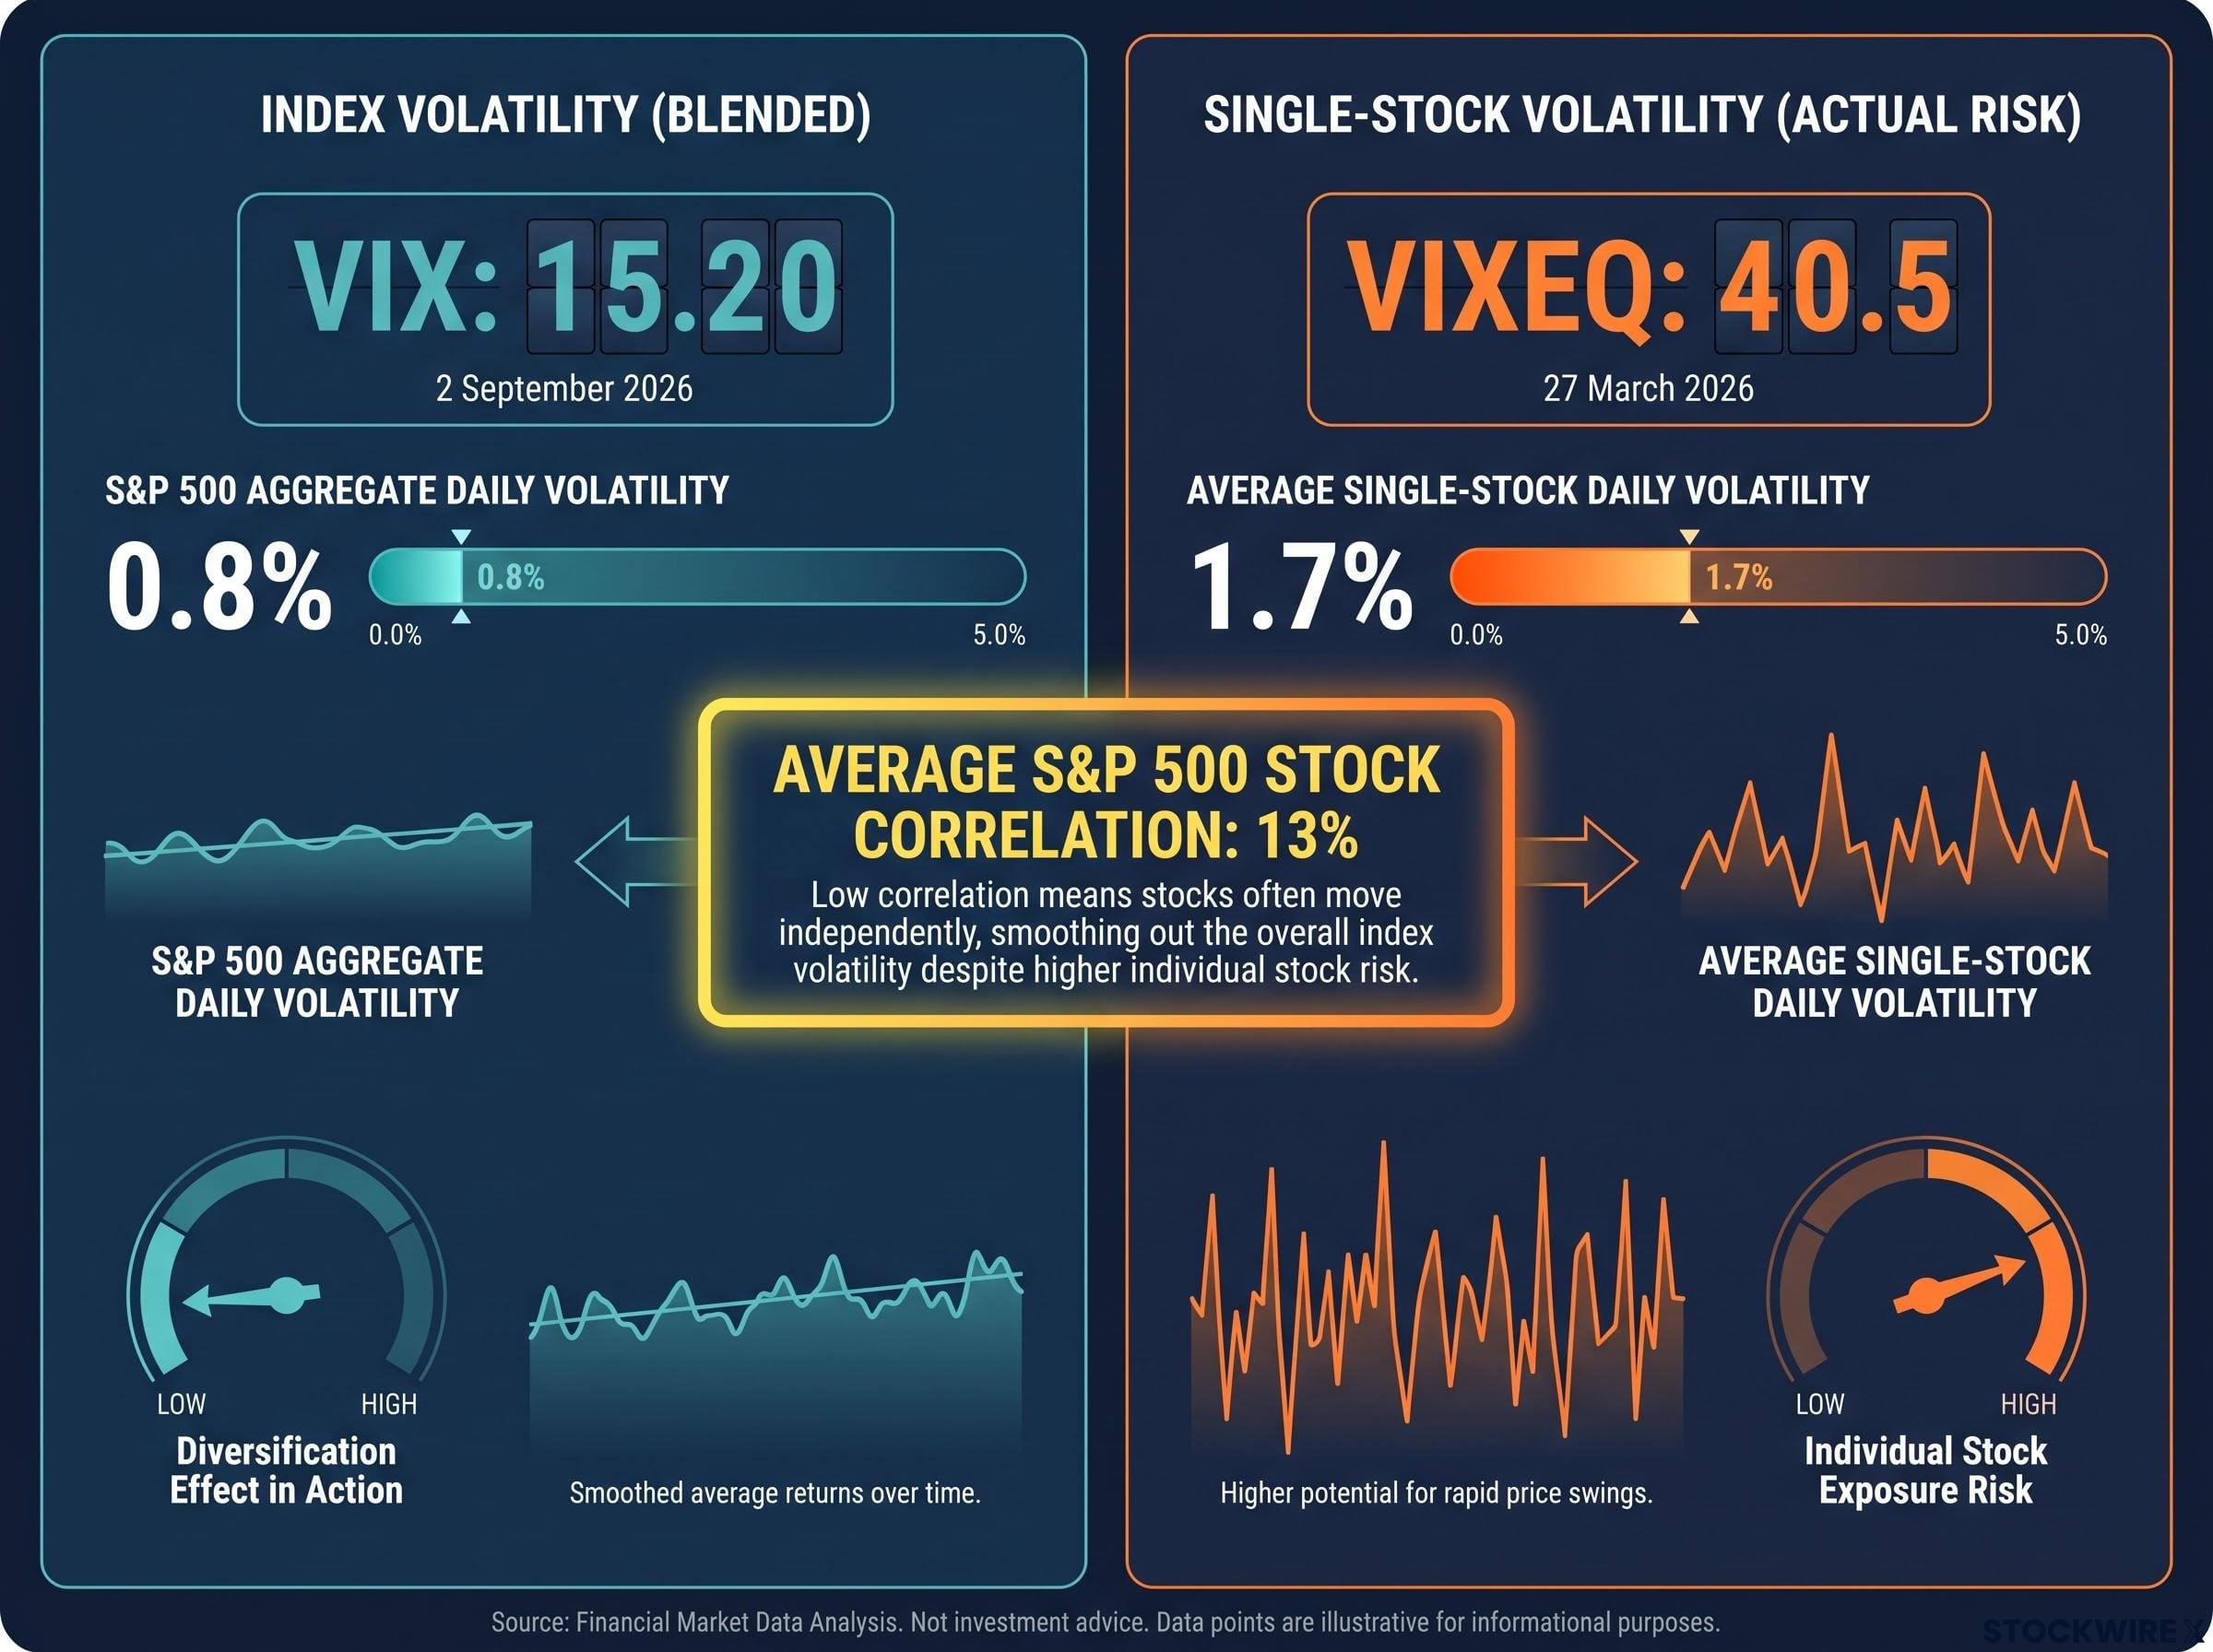
Average pairwise S&P 500 stock correlation sat at just 13%, lower than 98% of observations since 2022.
When correlation is that low, the individual pieces of the index are moving in wildly different directions at the same time, and those moves cancel each other out inside the blended number. The VIXEQ-VIX gap tells you plainly that the VIX is not measuring the risk sitting in your individual holdings. If you lean on it to gauge how turbulent your own account is likely to be, you will consistently understate the exposure you are actually carrying.
When big ASX news breaks, our subscribers know first
How structured products and 0DTE flow pin the index in place
To understand why the index stays so calm, you have to follow the money into the options market. It starts with a product most investors never touch directly but which now shapes the entire index.
Structured products, things like autocallables and equity-linked notes, are yield-enhancing instruments that banks sell to investors hungry for income. To manufacture them, banks effectively sell large volumes of S&P 500 volatility. The U.S. structured products market was estimated at roughly $200 billion in volume for 2025, growing 5-10% year over year.
Someone has to take the other side of all that volatility selling, and that someone is the dealer community. As a consequence, SPX options carry roughly $80 billion in gross gamma, and dealers sit consistently long that gamma. Here is the three-step chain that follows:
- Large-scale structured product issuance leaves dealers holding long gamma positions on the S&P 500 index.
- Being long gamma forces dealers into contrarian hedging: they buy the index as it falls and sell it as it rises to stay delta-neutral.
- That contrarian flow, known as gamma scalping, mechanically dampens index price moves and drags realised volatility lower, which in turn suppresses the VIX.
Staying delta-neutral is not a passive condition; as the index moves, the ratio of the dealer’s directional exposure shifts continuously, forcing repeated trades to rebalance, and the scale of those rebalancing trades at $80 billion in gross gamma is what generates the pinning effect.
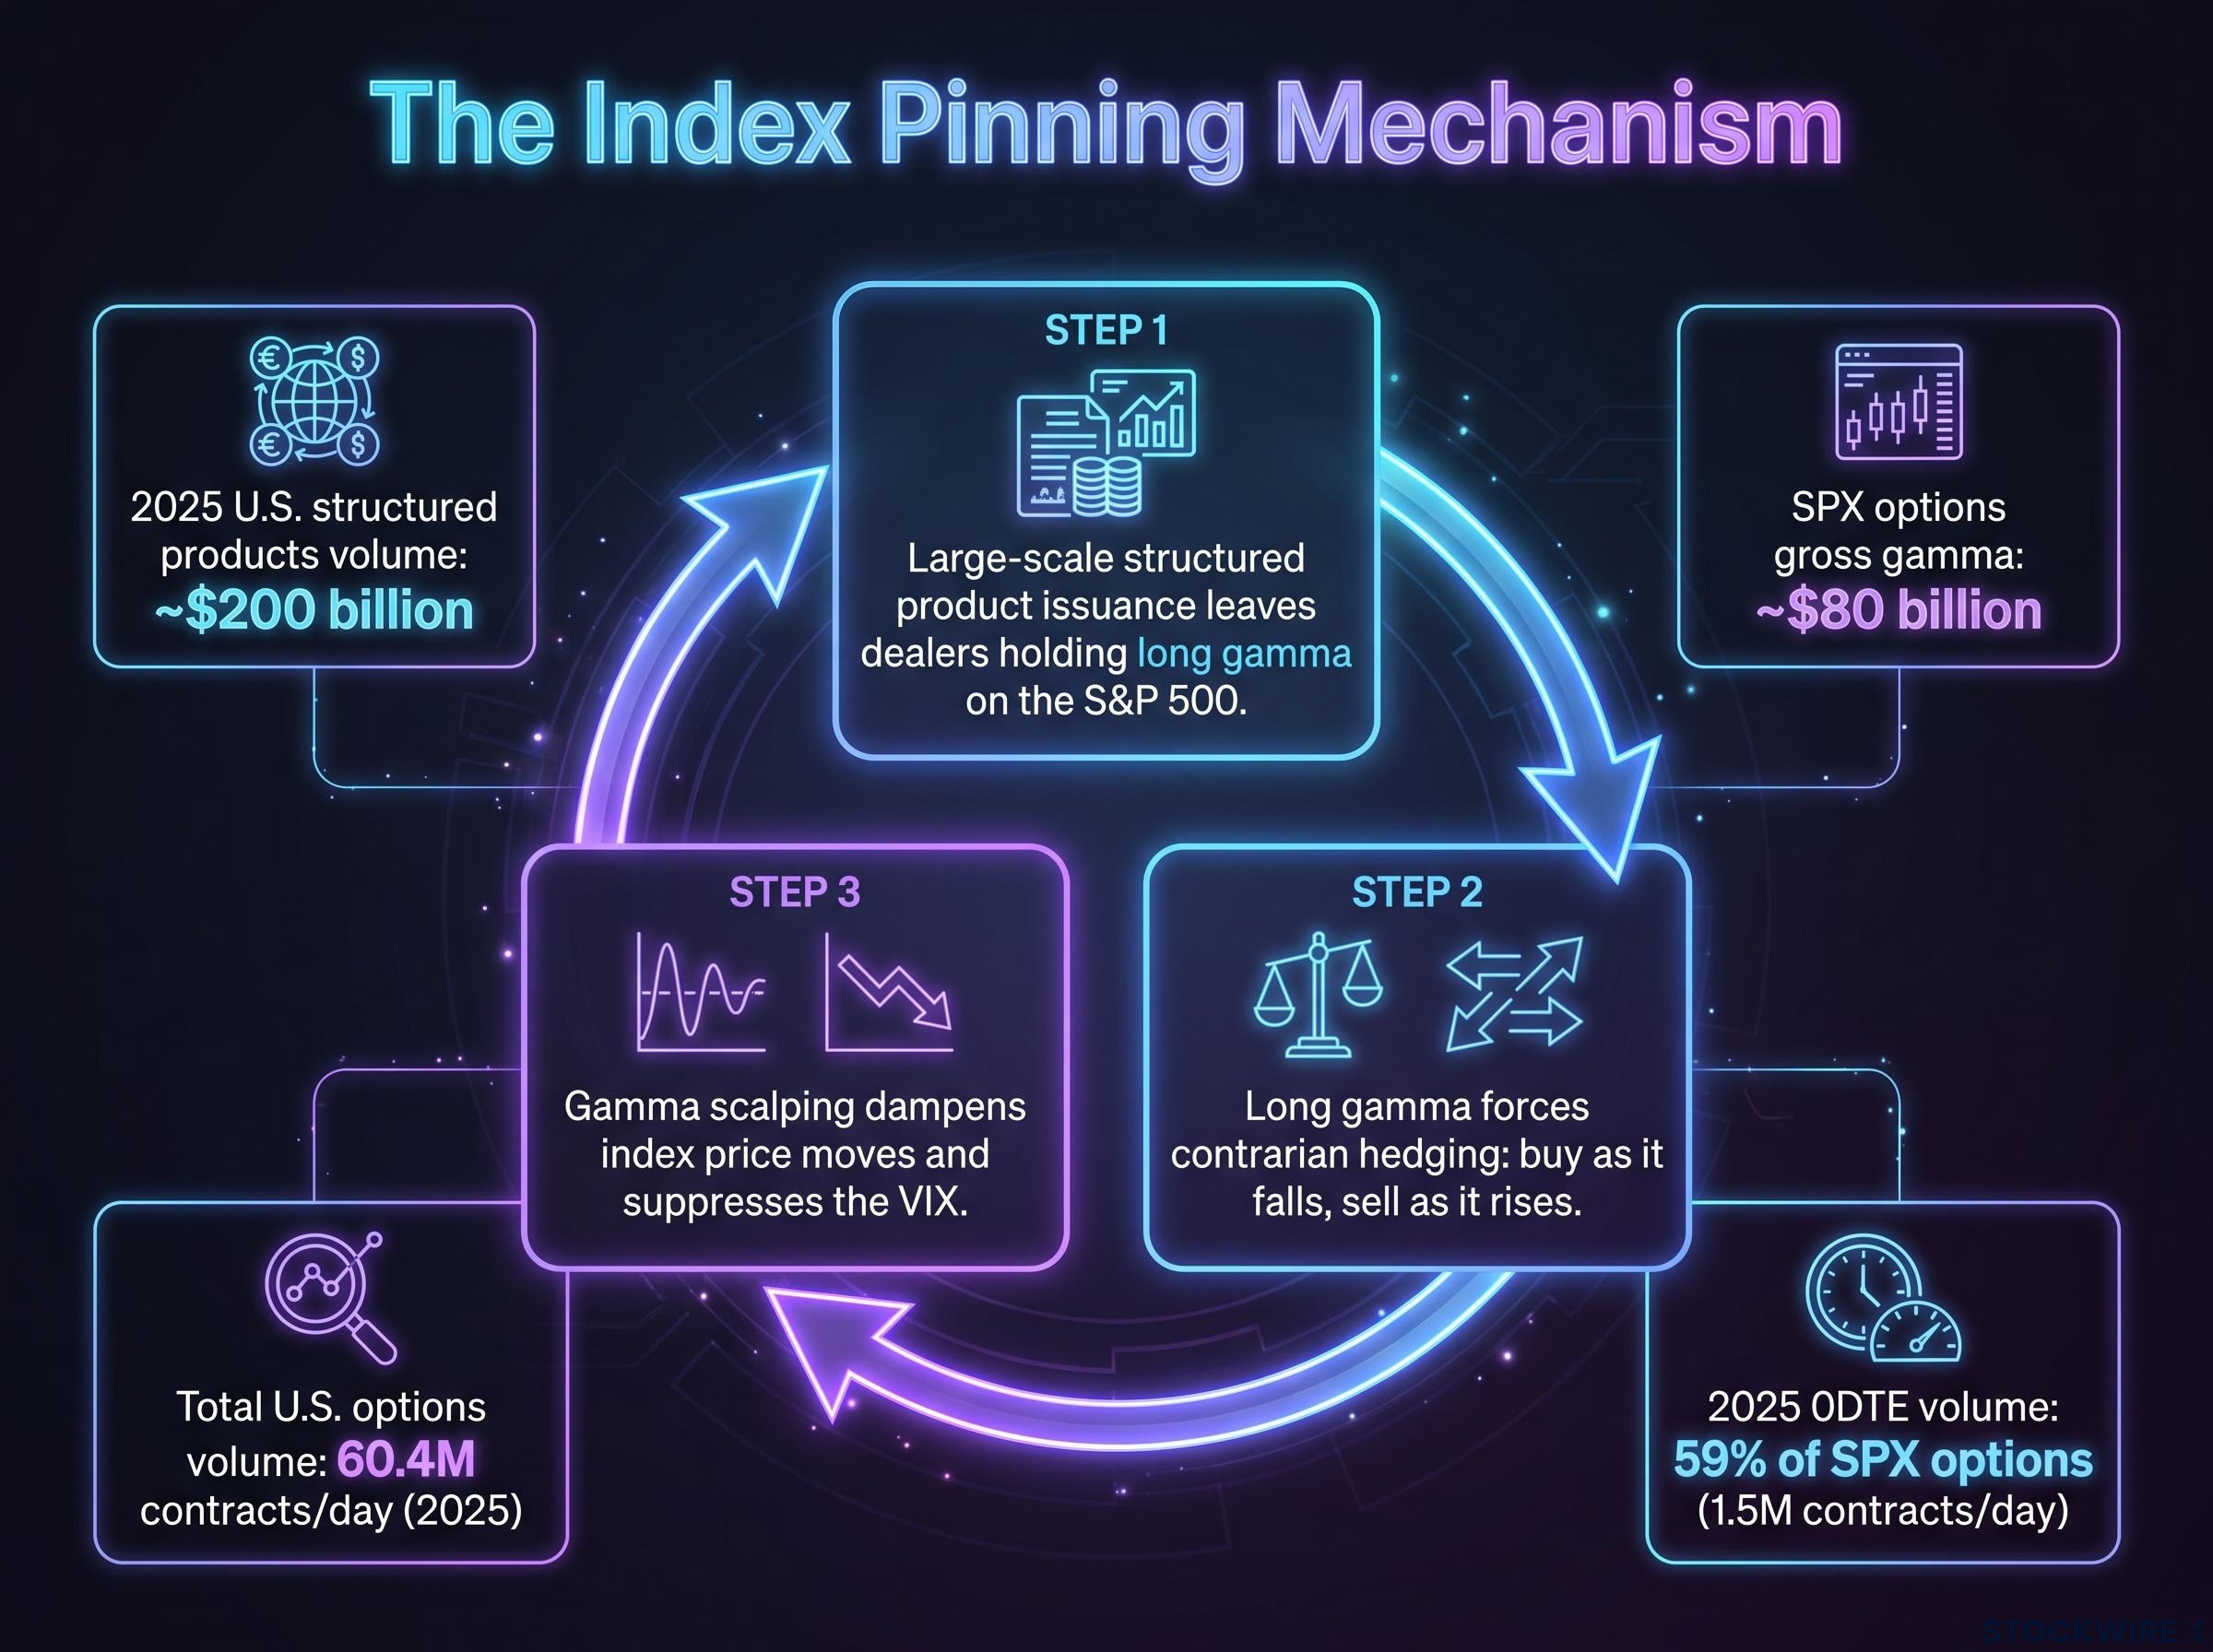
Now layer on the sheer volume of short-dated trading. By 2025, 0DTE options (contracts expiring the same day they are traded) represented roughly 59% of all SPX options volume, averaging around 1.5 million contracts a day. Total listed U.S. options average daily volume hit 60.4 million contracts in 2025. This is not a niche corner of the market. It is the market.
The scale is what makes this matter. Index pinning is not a temporary quirk that shows up on quiet days. It is a persistent structural condition, which means the calm VIX readings you are seeing in 2026 are mechanically manufactured rather than an organic signal that risk is genuinely low.
Why this loop is self-reinforcing
The mechanism feeds itself. Low realised volatility validates the decision to keep selling volatility, so structured product buyers keep coming back, which brings still more gamma onto dealer books and pins the index even harder.
None of this is a scheme or manipulation. It is a rational equilibrium, and it holds right up until an external shock arrives large enough to break it.
What dispersion actually means: your stock absorbs the risk the index cannot show
Dispersion sounds like a term for a quant desk, but you have already lived it. Every time one of your holdings ripped higher on earnings while the index yawned, you were watching dispersion in real time.
Here is the mechanism. When gamma hedging pins the index, company-specific events, an earnings miss, a guidance cut, a regulatory shock, still force large moves in individual stocks. Those moves have to go somewhere.
What happens is that they offset one another inside the index weighting. A semiconductor name surges, a staples name sags, and the two roughly cancel at the headline level. The index barely moves while its components gyrate underneath.
The data makes this concrete.
| Date | VIX Level | VIXEQ / DSPX Level | Notable index behaviour | Notable constituent behaviour |
|---|---|---|---|---|
| Early 2024 | Calm, no sustained daily moves above 2% | Elevated dispersion | Long streaks without a large daily move | SMH up ~30% YTD vs XLP up ~4% |
| June 2024 | Subdued | Record implied dispersion | Avoided major shifts | 30-day implied dispersion at highest since 2014 |
| 13 July 2024 | 17.16 | VIXEQ near 50, DSPX near 47 | Calm at index level | Extreme single-stock volatility |
The 2026 environment tells the same story from a different angle: 56% of S&P 500 stocks were outperforming the index year-to-date, a sign of large performance gaps beneath a placid surface. Individual constituents routinely swung 5-15% around earnings or guidance while the index barely registered.
The implied versus realised volatility gap is itself a defining feature of 2026: with implied volatility running above 23% while realised volatility sits below 14%, the year’s headline numbers have systematically overstated the actual daily price movement investors were experiencing, a mirror image of the single-stock understatement the VIX creates.
30-day implied dispersion hit its highest point since data tracking began in 2014, even as the broader index avoided major shifts.
If you hold concentrated single-stock positions, this is the section that matters most to you. You are experiencing the full volatility that the index-level suppression mechanism is hiding, and the calm VIX gives you no warning that it is happening. Those big swings in your account are not random noise. They are the predictable result of how risk gets redistributed under index suppression.
Vanna, charm, and why elevated skew makes dealer flows more predictable, not less
There is a second layer to dealer hedging beyond simple gamma, and it hinges on something called skew. Skew is the tendency for downside protection (puts) to cost more than upside bets (calls), because more investors want insurance than lottery tickets.
Two mechanical forces flow from that imbalance. Both describe how a dealer’s directional exposure shifts, and both create predictable flows.
- Vanna is the way a dealer’s delta exposure changes as implied volatility moves. When volatility drops after a known event, dealers holding short puts see those positions shrink, forcing them to buy the index back, a reliable supportive bid.
- Charm is the way a dealer’s delta exposure decays as an option approaches expiry. As out-of-the-money options run down toward zero, dealers hedge steadily toward heavy open-interest strikes, creating a mechanical push into the close.
Here is the counterintuitive part. Skew, not the overall level of volatility, is what drives these flows.
Implied volatility skew is the primary driver of vanna and charm flow effects, with the base level of implied volatility acting only as a multiplier.
When skew is absent, meaning downside and upside implied volatility are roughly equal, vanna and charm flows stay essentially neutral no matter how high or low overall volatility is. The current regime is anything but neutral. The CBOE SKEW Index stood at 144.12 as of 2 September 2026, alongside the VIX at 15.20 on the same date.
Why low volatility and high skew is a regime, not a contradiction
These two readings reinforce each other. Gamma pinning suppresses overall implied volatility, while the persistent dealer imbalance (selling demanded puts, buying supplied calls) keeps skew elevated.
Lower total volatility actually makes structural flows more consistent, not less. Speculative positioning stays muted when volatility is low, which lets the mechanical dealer flows dominate and behave predictably. Watching the SKEW Index alongside the VIX gives you a far more complete picture of the flow regime than the VIX alone, because skew is the variable that determines whether those dealer flows are directional. It is also, as the next section shows, a regime that is inherently fragile.
When the structure breaks: what a volatility unwind actually looks like
The best way to understand the fragility is to watch it happen, and it happened recently. The July to August 2024 unwind is the template.
The setup looked exactly like today. In mid-July 2024, dispersion between single-stock and index volatility hit a record spread, the same kind of stretched reading visible now. Then it snapped.
Between 15 July and 5 August 2024, the S&P 500 fell roughly 10% and the Nasdaq roughly 16%, culminating in a volatility spike that sent the VIX to 65 intraday on 5 August 2024. The mechanism behind that violence is the key thing to grasp. Here is the sequence:
- Dispersion reaches an extreme, with single-stock volatility far above the index.
- A shock hits, and stock correlations suddenly rise together.
- Dealer gamma flips from long to short as the move overwhelms their positioning.
- Hedging inverts: instead of dampening moves, dealers now sell weakness and buy strength, amplifying the move.
- The VIX spikes sharply as realised volatility explodes.
Research indicates 0DTE flow measurably raises this tail risk, generating roughly a 10% increase in volatility for each one-standard-deviation rise in 0DTE volume. When the calm breaks, the same flow that pinned the index becomes the accelerant.
What September 2026 conditions suggest about fragility
The current setup carries the same fingerprints. Nomura analysis in September 2026 characterised the extended VIX drop as follows:
Outright capitulation, with bled-out hedges and drastically reduced shock-absorbing capacity.
That matters because it describes a market with less cushion for the next genuine catalyst. Add historically compressed autumn volatility and seasonal patterns that point toward expansion, with some projections anticipating an 8-10% equity decline during the fall window, and the tail-risk window stops looking hypothetical.
VIX seasonality reinforces the structural fragility argument: three decades of data show the late-August to early-October window records the single largest average monthly VIX increase of the year, meaning the current suppressed reading sits at the historically most common entry point for a sharp volatility expansion.
The takeaway for you is not that a crash is imminent. It is that a VIX at 15.20 paired with historically low correlations is a structural condition with a known fragility profile, not durable stability. Once you understand the 2024 precedent, a move from 15 to 65 in three weeks stops being a black swan and becomes a template you can recognise.
Reading the market correctly when the headline number lies
So where does this leave you? Not in panic, and not in complacency, but with a better toolkit than a single number can provide.
The core reframe is simple: the VIX measures index-implied volatility, the VIXEQ measures single-stock implied volatility, and the SKEW Index measures the skew regime that governs how predictable dealer flows are. Together they tell you far more than the VIX alone ever could.
- VIX tells you what the index-level machine is doing. At 15.20 on 2 September 2026, it says the pinning mechanism is firmly in control.
- VIXEQ tells you how much risk your individual holdings are carrying. The widest VIXEQ-VIX spread since January 2023, recorded in late May 2026, confirms this regime has been persistent, not a one-off.
- SKEW tells you whether structural flows are directional and how fragile the calm is. At 144.12, it points to elevated skew sitting beneath a suppressed surface.
Elevated single-stock volatility in a low-VIX world is not noise to dismiss. It is a structurally predictable signal about where risk has been redistributed, straight into your concentrated positions.
The forward-looking posture follows from that. In the current environment, concentrated single-stock exposure carries more risk than the headline number implies, while the same mechanics create more predictable short-term flow patterns for those who read the regime correctly. The August 2024 precedent is your calibration point for what a breakdown looks like when it comes.
This article is for informational purposes only and should not be considered financial advice. Investors should conduct their own research and consult with financial professionals before making investment decisions. Past performance does not guarantee future results, and these statements are speculative and subject to change based on market developments.