The most capital-intensive technology build-out in recorded history is increasingly being financed with borrowed money. That shift, from cash-rich companies spending their own profits to companies issuing bonds at scale, has happened quietly, and it changes the risk profile of the entire boom.
It also arrives at an awkward moment. Real interest rates are contested, monetary policy sits in a grey zone between restrictive and accommodative, and the analytical framework best equipped to explain what a debt-financed investment surge does over time is nearly a century old and almost never cited in mainstream financial coverage.
That framework is Austrian business cycle theory, developed by Ludwig von Mises, Friedrich Hayek, and Murray Rothbard. Treated seriously, it is a rigorous diagnostic tool rather than a contrarian slogan, and it makes specific, testable claims about what an artificial credit expansion concentrated in a single fashionable sector tends to produce.
This piece gives you the analytical vocabulary to judge whether the AI boom is durable capital formation or credit-driven misallocation that rhymes with prior busts. More usefully, it gives you the specific market signals to monitor so that the question becomes a position-sizing decision rather than background noise.
How the AI capex surge became a debt-financed boom
Start with the scale, because the numbers are genuinely without precedent. In 2024, AI-specific infrastructure investment was estimated at roughly $246 billion to $252 billion. By 2025, combined AI-related capital expenditure among the major US technology platforms was projected at approximately $320 billion to $400 billion.
AI spending as a share of GDP reached 4.9% of US output in Q1 2026, surpassing the dot-com era peak of approximately 4.2% and the cloud buildout peak of approximately 3.8%, placing the current cycle at a threshold that has historically coincided with the later, more fragile stages of a technology investment wave.
The company-level guidance gives those aggregates human scale. Amazon planned $100-105 billion in 2025, up from $77 billion the prior year. Alphabet guided to between $75 billion and $93 billion, Microsoft to around $80 billion for AI infrastructure, and Meta to $60-72 billion, up sharply from $39 billion in 2024.
| Company | 2024 Capex | 2025 Projected Capex | Primary Funding Source |
|---|---|---|---|
| Amazon | $77 billion | $100-105 billion | Cash flow, shifting toward debt |
| Alphabet | Not disclosed here | $75-93 billion | Cash flow and bond issuance |
| Microsoft | Not disclosed here | ~$80 billion | Cash flow and bond issuance |
| Meta | $39 billion | $60-72 billion | Cash flow, expanding debt use |
Projections for 2026 push the combined figure into the $700-800 billion range, with some analyst aggregates climbing above $900 billion. That escalation is the headline. The financing shift beneath it is the analysis.
Originally these companies funded their expansion from internal cash flows. That is no longer the case. Hyperscaler bond issuance reportedly exceeded $100 billion in a single recent six-month period, and the 10 largest AI companies were projected to issue more than $120 billion in bonds across 2025.
AI bond market issuance has already reached a scale that is mechanically reshaping the investment-grade index itself: Goldman Sachs estimates close to $500 billion in AI-related debt in 2026 alone, and by mid-year hyperscaler bonds represented roughly 15% of the entire US investment-grade market, concentrating passive bond fund exposure whether holders recognise it or not.
The wider ambition is larger still. Roughly $6 trillion in total funding is estimated to be required by 2030 for AI data centres, energy projects, and the supporting supply chain. If half of that is debt-financed, the resulting credit build would eclipse all broadband infrastructure investment made since the internet began.
Here is why the funding source matters more than the spending total. Cash-funded investment is insulated from credit conditions. Debt-funded investment is not. The shift from retained earnings to bond markets means the AI build-out has become interest-rate sensitive in a way it simply was not two years ago, and if you are evaluating technology sector exposure, the cost of this capital is now a live variable rather than a solved problem.
When big ASX news breaks, our subscribers know first
What Austrian business cycle theory actually predicts here
The Austrian framework begins with a single mechanism: the price of credit. When real interest rates are pushed below the level genuine savings would set, that suppressed rate sends a false signal to entrepreneurs.
Cheap borrowing makes long-dated, capital-heavy projects look profitable that would not survive a truthful cost of capital. Investment extends beyond what real savings can sustain, and it clusters in whatever sector is novel or fashionable at the time. Austrians call the result malinvestment: capital committed to projects that cannot all be completed profitably once the true cost of money reasserts itself.
The theory does not blame human error. It blames the signal. When many entrepreneurs act on the same distorted price at once, they make the same mistake together, which is why busts arrive as a cluster rather than a scattering of isolated failures.
That is the mechanism. The question is whether the current AI cycle carries its fingerprints.
The four Austrian diagnostic markers applied to the AI cycle
The framework flags four conditions. Mapped against current evidence, the pattern is uncomfortably clean.
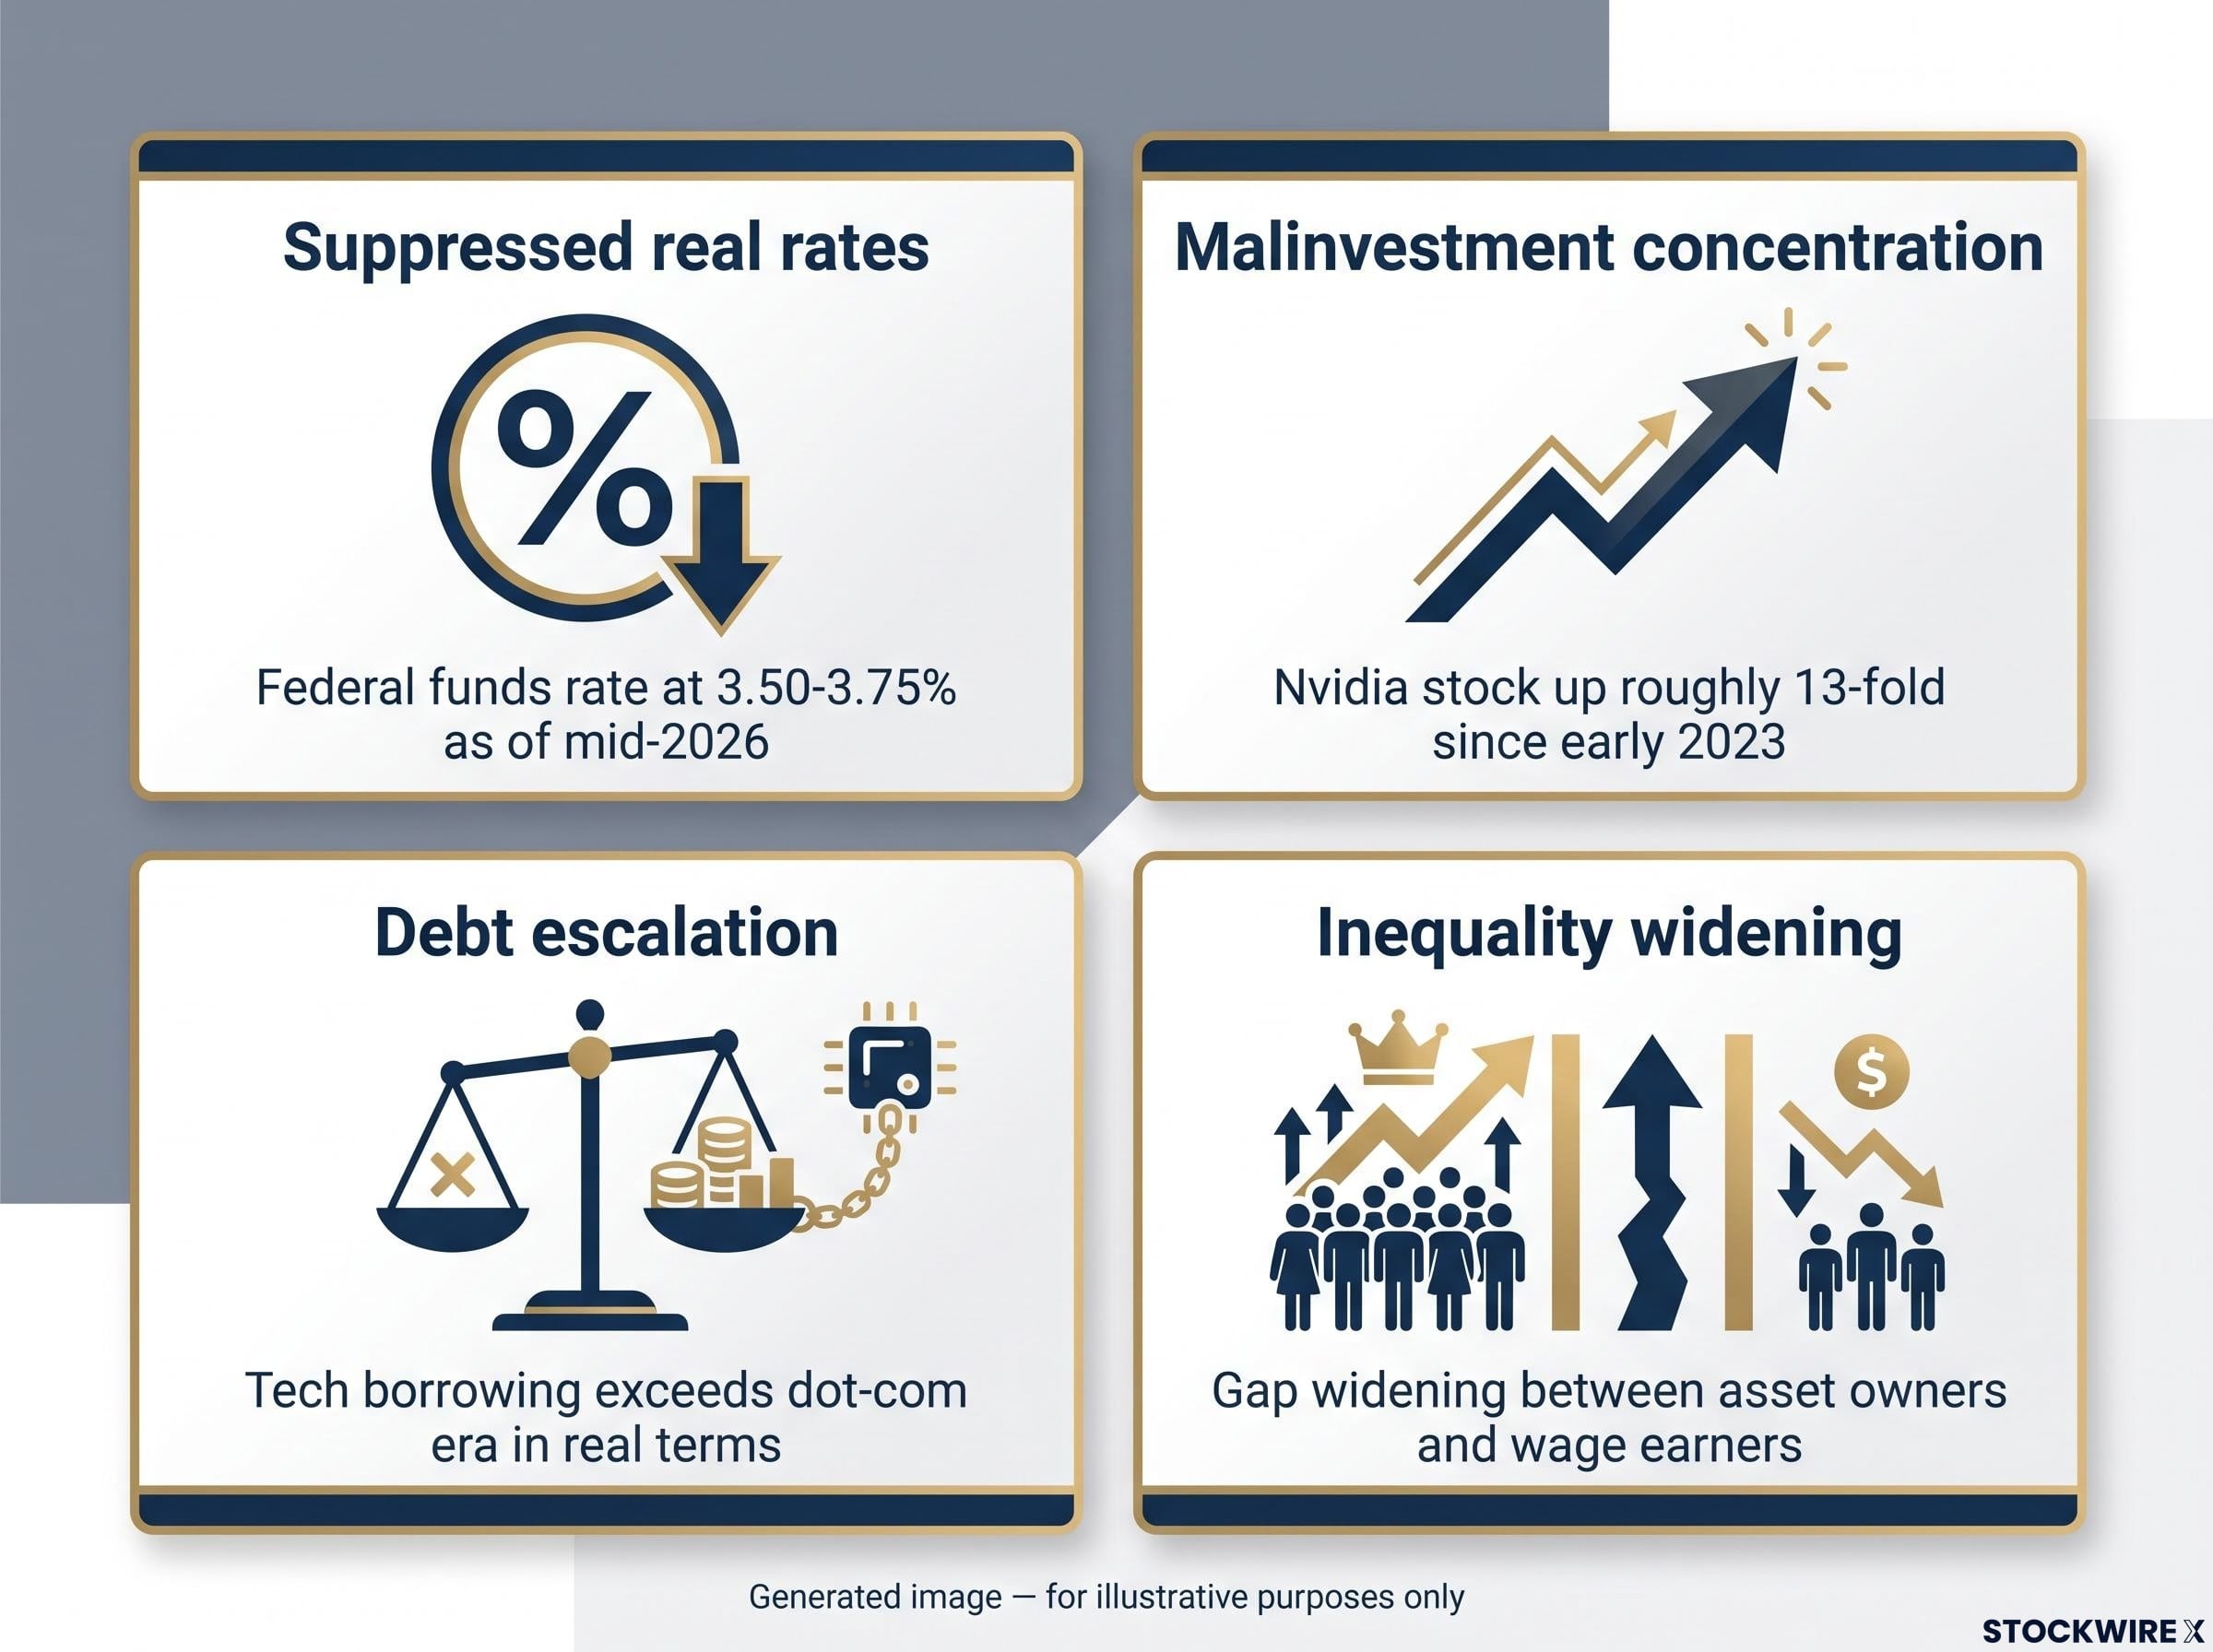
- Suppressed real rates: The nominal federal funds rate sits in the 3.50-3.75% range as of mid-2026. Whether real rates are genuinely suppressed is contested; institutional commentary reads policy as moderately restrictive rather than clearly loose, while the Austrian view holds that rates remain below a productivity-adjusted neutral. This is the one marker where the evidence is disputed rather than clear.
- Malinvestment concentration: Capital is pouring into a single thematic sector at extraordinary intensity. Nvidia’s stock has risen roughly 13-fold since early 2023, a valuation signal Austrians would read as capital crowding into one fashionable trade.
- Debt escalation: Tech-sector borrowing now exceeds dot-com-era levels in inflation-adjusted terms. Capital structure distortion, meaning investment tilting toward long-dated projects funded by cheap credit, is precisely what the theory predicts.
- Inequality widening: The gap between asset owners and wage earners, a recurring feature of credit-driven booms in the Austrian account, is a documented feature of this cycle.
The historical rhyme reinforces the reading. The 1990s dot-com bubble and the mid-2000s housing bubble both showed these structural markers, and the current cycle’s borrowing has surpassed the dot-com peak in real terms.
Historical infrastructure cycles provide the clearest calibration for how the Austrian mechanism plays out in practice: the 1990s fibre-optic overbuild destroyed roughly $5 trillion in equity value before the surviving physical infrastructure became the backbone for the next generation of applications, a sequence the dot-com analogy in Austrian analysis maps directly onto.
Here is the honest limit of the framework, and it is the part that matters for how you weigh the bull case. Austrian theory does not predict a bust on a fixed date. It identifies the conditions under which a bust becomes structurally likely, and three of the four are measurably present now. That should not send you running, but it should change how much certainty you assign to the durable-capital-formation story.
Why AI productivity gains will not contain broad inflation
The strongest bull argument deserves its strongest form. It goes like this: AI-driven productivity gains will compress the prices of final goods and services, keeping consumer inflation contained and explaining why the Federal Reserve’s 2% target has stayed out of reach. This view aligns with Keynesian-influenced commentary, associated with figures such as Kevin Warsh, and it is genuinely coherent. If AI makes production cheaper, prices should fall.
The rebuttal is not that this is silly. It is that it confuses two different things: relative prices and the general price level.
Technology reduces relative prices within specific sectors. It does not lower the economy-wide price level. That distinction, drawn from Austrian price theory, is the entire disagreement.
The refutation runs in three steps.
- Sectoral versus general price level. A price that falls in one sector tells you nothing about the aggregate. AI-related goods are a small share of the overall consumer basket, so even steep declines in compute or software do not mechanically produce broad consumer disinflation.
- The historical template. Personal computers, semiconductors, and flat-screen televisions all fell dramatically in price over decades. Meanwhile healthcare and education costs kept rising and aggregate consumer prices climbed throughout. Cheaper technology and rising overall inflation coexisted comfortably.
- Margin absorption versus consumer pass-through. Cost reductions in intermediate tech inputs are frequently captured as higher corporate margins or reinvested into new features, not handed to consumers as lower prices. Mainstream research largely agrees on this specific point.
The interpretive payoff is where this section earns its place in a portfolio conversation. If AI productivity is not a structural deflationary force for the broad economy, then the monetary conditions fuelling this boom cannot be neutralised by the boom’s own output. The “AI solves inflation” thesis is not a macro stabiliser; it is a risk factor, and any position sized on it carries an unacknowledged assumption about the future path of interest rates.
The crowding-out risk that the bull thesis ignores
There is a dimension of this story that neither camp’s bull case fully accounts for, and it lives in the credit market itself.
When the federal government and corporate borrowers issue large volumes of debt at the same time, they compete for the same finite pool of savings. That competition places upward pressure on long-term interest rates regardless of what the Fed does with short-term policy. Economists call it crowding-out.
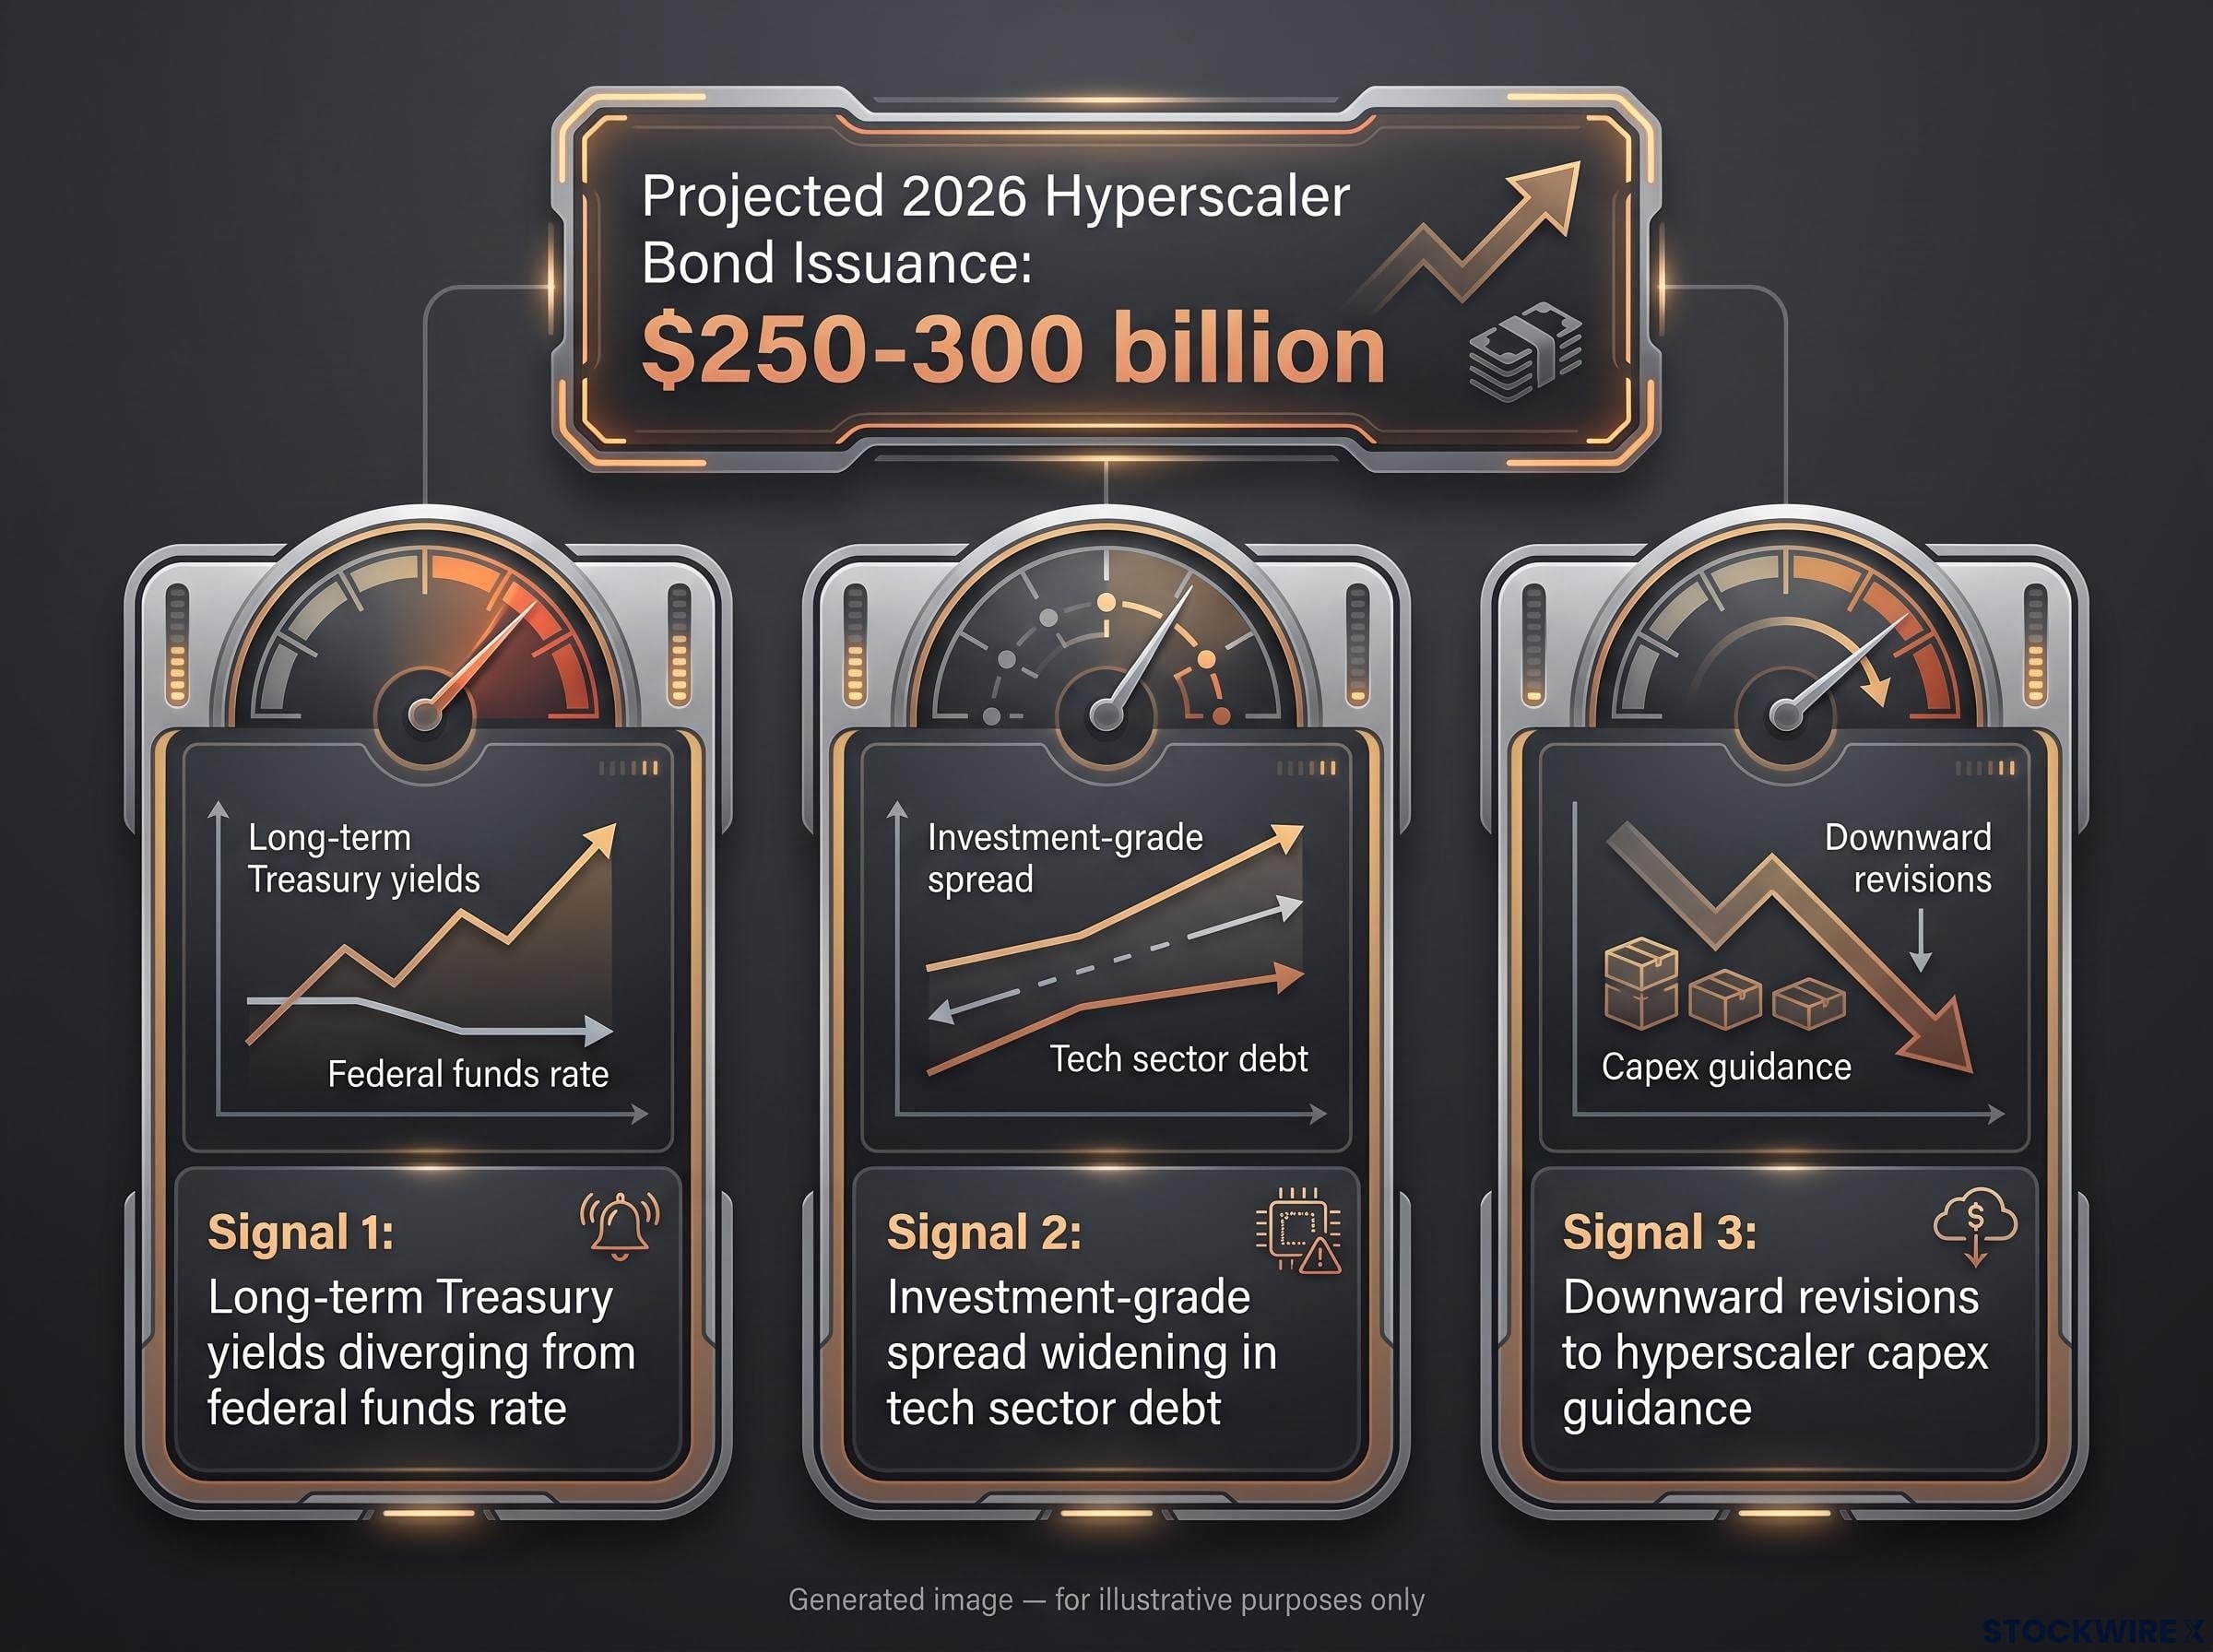
The scale makes this concrete. Projected 2026 hyperscaler bond issuance sits in the $250-300 billion range, arriving alongside substantial federal deficit financing. Two very large borrowers reaching into the same well at once is exactly the setup crowding-out describes.
Three signals to watch for crowding-out pressure
The mechanism becomes a monitoring posture through three specific, observable signals.
- Long-term Treasury yields diverging from the federal funds rate. If long-dated yields rise while the Fed holds short rates steady, that gap is the crowding-out signature.
- Investment-grade spread widening in technology sector debt. Watch the extra yield investors demand to hold tech corporate bonds. Widening spreads specifically in this sector signal the market repricing its risk.
- Downward revisions to hyperscaler capex guidance. A cut to spending plans is a leading indicator that the companies themselves are recalculating the cost of the build.
Investment-grade credit spreads sit at approximately 0.80-0.82 percentage points as of mid-2026, well below their long-run average of roughly 3.8-5%, and the Austrian monitoring posture treats any sustained move above 1.0 percentage point in this measure as an early signal that the market is beginning to reprice the cost of AI-linked debt rather than simply absorbing supply.
The counter-perspective deserves fair weight. Large technology firms hold genuinely strong balance sheets and chose debt as the optimal financing route, not because they had no alternative. If credit markets tighten, they could pivot toward equity or retained earnings. This is a structural vulnerability, not an inevitable bust.
The read for anyone holding hyperscaler exposure is direct. If crowding-out lifts long-term rates, the debt already issued becomes more expensive to refinance and the future capex pipeline more costly to fund, compressing the return profile that justifies today’s valuations. That risk is not priced into the sector at current levels, which makes long-term rate movements a direct earnings and valuation exposure for you, not a distant backdrop variable.
What the Austrian framework actually predicts for AI valuations
The most honest thing the Austrian framework offers is also the most useful, and it is a distinction rather than a forecast.
The theory identifies when conditions are ripe for a correction. It does not tell you when the correction arrives. That distinction between structural fragility and timed prediction is the whole practical value of the lens.
Applied to AI, an Austrian-style bust has a recognisable anatomy. A sudden rise in real interest rates makes the marginal project unprofitable. Capex commitments are abandoned mid-flight. Partially completed data centre builds are written down. Capital flows reverse out of the sector, and equity valuations follow. The dot-com bust is the template: rapid capex wind-down, equity collapse, credit contraction, with Nvidia’s roughly 13-fold rise standing in for the concentration risk that snaps hardest when sentiment turns.
The discipline of the framework is that it is falsifiable. Certain evidence would confirm the fragility is developing. Other evidence would confirm the bull case is intact.
- Signs the bust scenario is developing: real long-term rates rising sharply, a wave of capex abandonments and data centre write-downs, and capital rotating out of the sector.
- Signs the bull case holds: genuine broad productivity gains lifting real output across the economy, sustained credit market access at current spreads without rate pressure, and measurable return on invested capital from AI capex at scale.
Understanding this difference is what lets you hold a nuanced position. You are not forced to dismiss the risk or flee the sector. You size exposure in proportion to the specific conditions you are watching, which is a stance neither pure bull nor pure bear can occupy.
Calibrating risk in the AI cycle without calling the top
Pull the threads together and the framework points somewhere precise rather than alarmist. Four structural risks run through this boom: its sensitivity to debt financing, the Austrian-diagnosed conditions for malinvestment, the flaw in the deflation-containment thesis, and the crowding-out pressure building in credit markets.
The conclusion does not require pessimism, only accuracy. The AI boom exhibits the structural markers of a credit-driven cycle, and the productivity case, while plausible, does not neutralise them.
That turns into a monitoring posture built on observable signals: real long-term interest rates, revisions to hyperscaler capex guidance, and spread behaviour in technology investment-grade debt. The alternative scenario stays open too, confirmed by broad productivity gains, continued credit access at current spreads, and demonstrated returns on AI capital.
This framework does not ask you to be bearish. It asks you to be precise about what you are betting on and which macro conditions must hold for that bet to pay. That precision is the difference between investing and speculating.
This article is for informational purposes only and should not be considered financial advice. Investors should conduct their own research and consult with financial professionals before making investment decisions.
Past performance does not guarantee future results, and the forward-looking scenarios discussed here are speculative and subject to change based on market developments, monetary policy, and company performance.