A single ETF ticker can pay you 8% to 12% a year in cash, dropped into your account like clockwork every month. The appeal is obvious, especially for anyone building an income portfolio. What most buyers do not fully grasp is where that cash actually comes from.
Covered call ETFs have become one of the fastest-growing corners of U.S. retail investing. JPMorgan Equity Premium Income ETF (JEPI), the largest of them, now holds roughly $46.3 billion in assets. The income is real and it lands on schedule, but the mechanism generating it permanently reshapes what your investment can do in a rising market.
This piece gives you the full mechanical picture: how the income is produced, why it carries a hard structural ceiling, and what the newer product variants change about the risk you are taking on. Understand this, and you can evaluate any covered call ETF on its own terms instead of treating a headline yield as a signal in isolation.
The engine underneath: how writing call options creates monthly cash flow
The income does not come from nowhere. A covered call ETF generates cash by writing, meaning selling, call options against the shares it already owns. A call option is a contract that gives the buyer the right to purchase a stock at a fixed price by a set date. The fund sells that right and pockets an immediate payment called the premium.
Here is the catch built into every one of those contracts. The fund agrees to hand over its shares at a pre-set level called the strike price. If the stock climbs above that strike, the gain above it belongs to the option buyer, not the fund. You keep the premium, but you surrender the run.
Where the fund sets that strike changes everything. Writing options at-the-money, meaning at roughly the current share price, generates fatter premiums but caps your upside immediately. Writing slightly out-of-the-money, a little above the current price, pays less but leaves a narrow band where the fund still participates before the cap bites.
Most of these funds run on 30-day cycles, the most common expiry schedule in the category. The premium is collected the moment the option is written, then flows out to you as part of the monthly distribution.
Those distributions are not a single clean stream of option income. They blend three separate sources:
- Option premiums collected from writing the calls
- Ordinary dividends paid by the underlying stocks the fund holds
- Realised capital gains or losses from managing the positions
The point worth sitting with is personal. Every distribution cheque you receive represents a permanent exchange, not a bonus on top of your equity returns. The fund gave away part of your potential upside to generate it.
From premium collected to cash in hand: the distribution pathway
The sequence is straightforward once you see it. The fund writes an option, receives the premium in cash, and its board declares a distribution. That cash then leaves the fund and arrives in your account.
When the distribution is paid, something happens that trips up a lot of first-time buyers.
The NAV drop on ex-dividend date follows the same accounting logic that governs ordinary stock dividends: cash physically leaves the vehicle and the unit price adjusts downward by that amount, which is why total return is the only honest performance measure for any income-producing fund.
Read total return, not the price chart. On the ex-dividend date, the fund’s net asset value (NAV) drops by exactly the amount of the distribution. This is not a loss. It is an accounting reflection of cash physically leaving the fund. Price-only charts therefore understate your true performance, because they ignore the cash you already received. Total return is the only honest measure.
When big ASX news breaks, our subscribers know first
Why upside is capped and what that costs in a bull market
Look at what happened in 2023. The S&P 500 climbed 12.2% over the year. JEPI, tracking a portfolio of quality stocks with a covered call overlay, was down roughly 1.5% year-to-date. The gap was not a mistake. It was the design working exactly as intended.
The Nasdaq story was starker. Global X’s Nasdaq-100 covered call fund gained 5.2% that year while the Nasdaq-100 index itself surged 35%. When markets rally hard, the calls get exercised, the shares get called away at the strike, and the fund is left holding premium instead of gains.
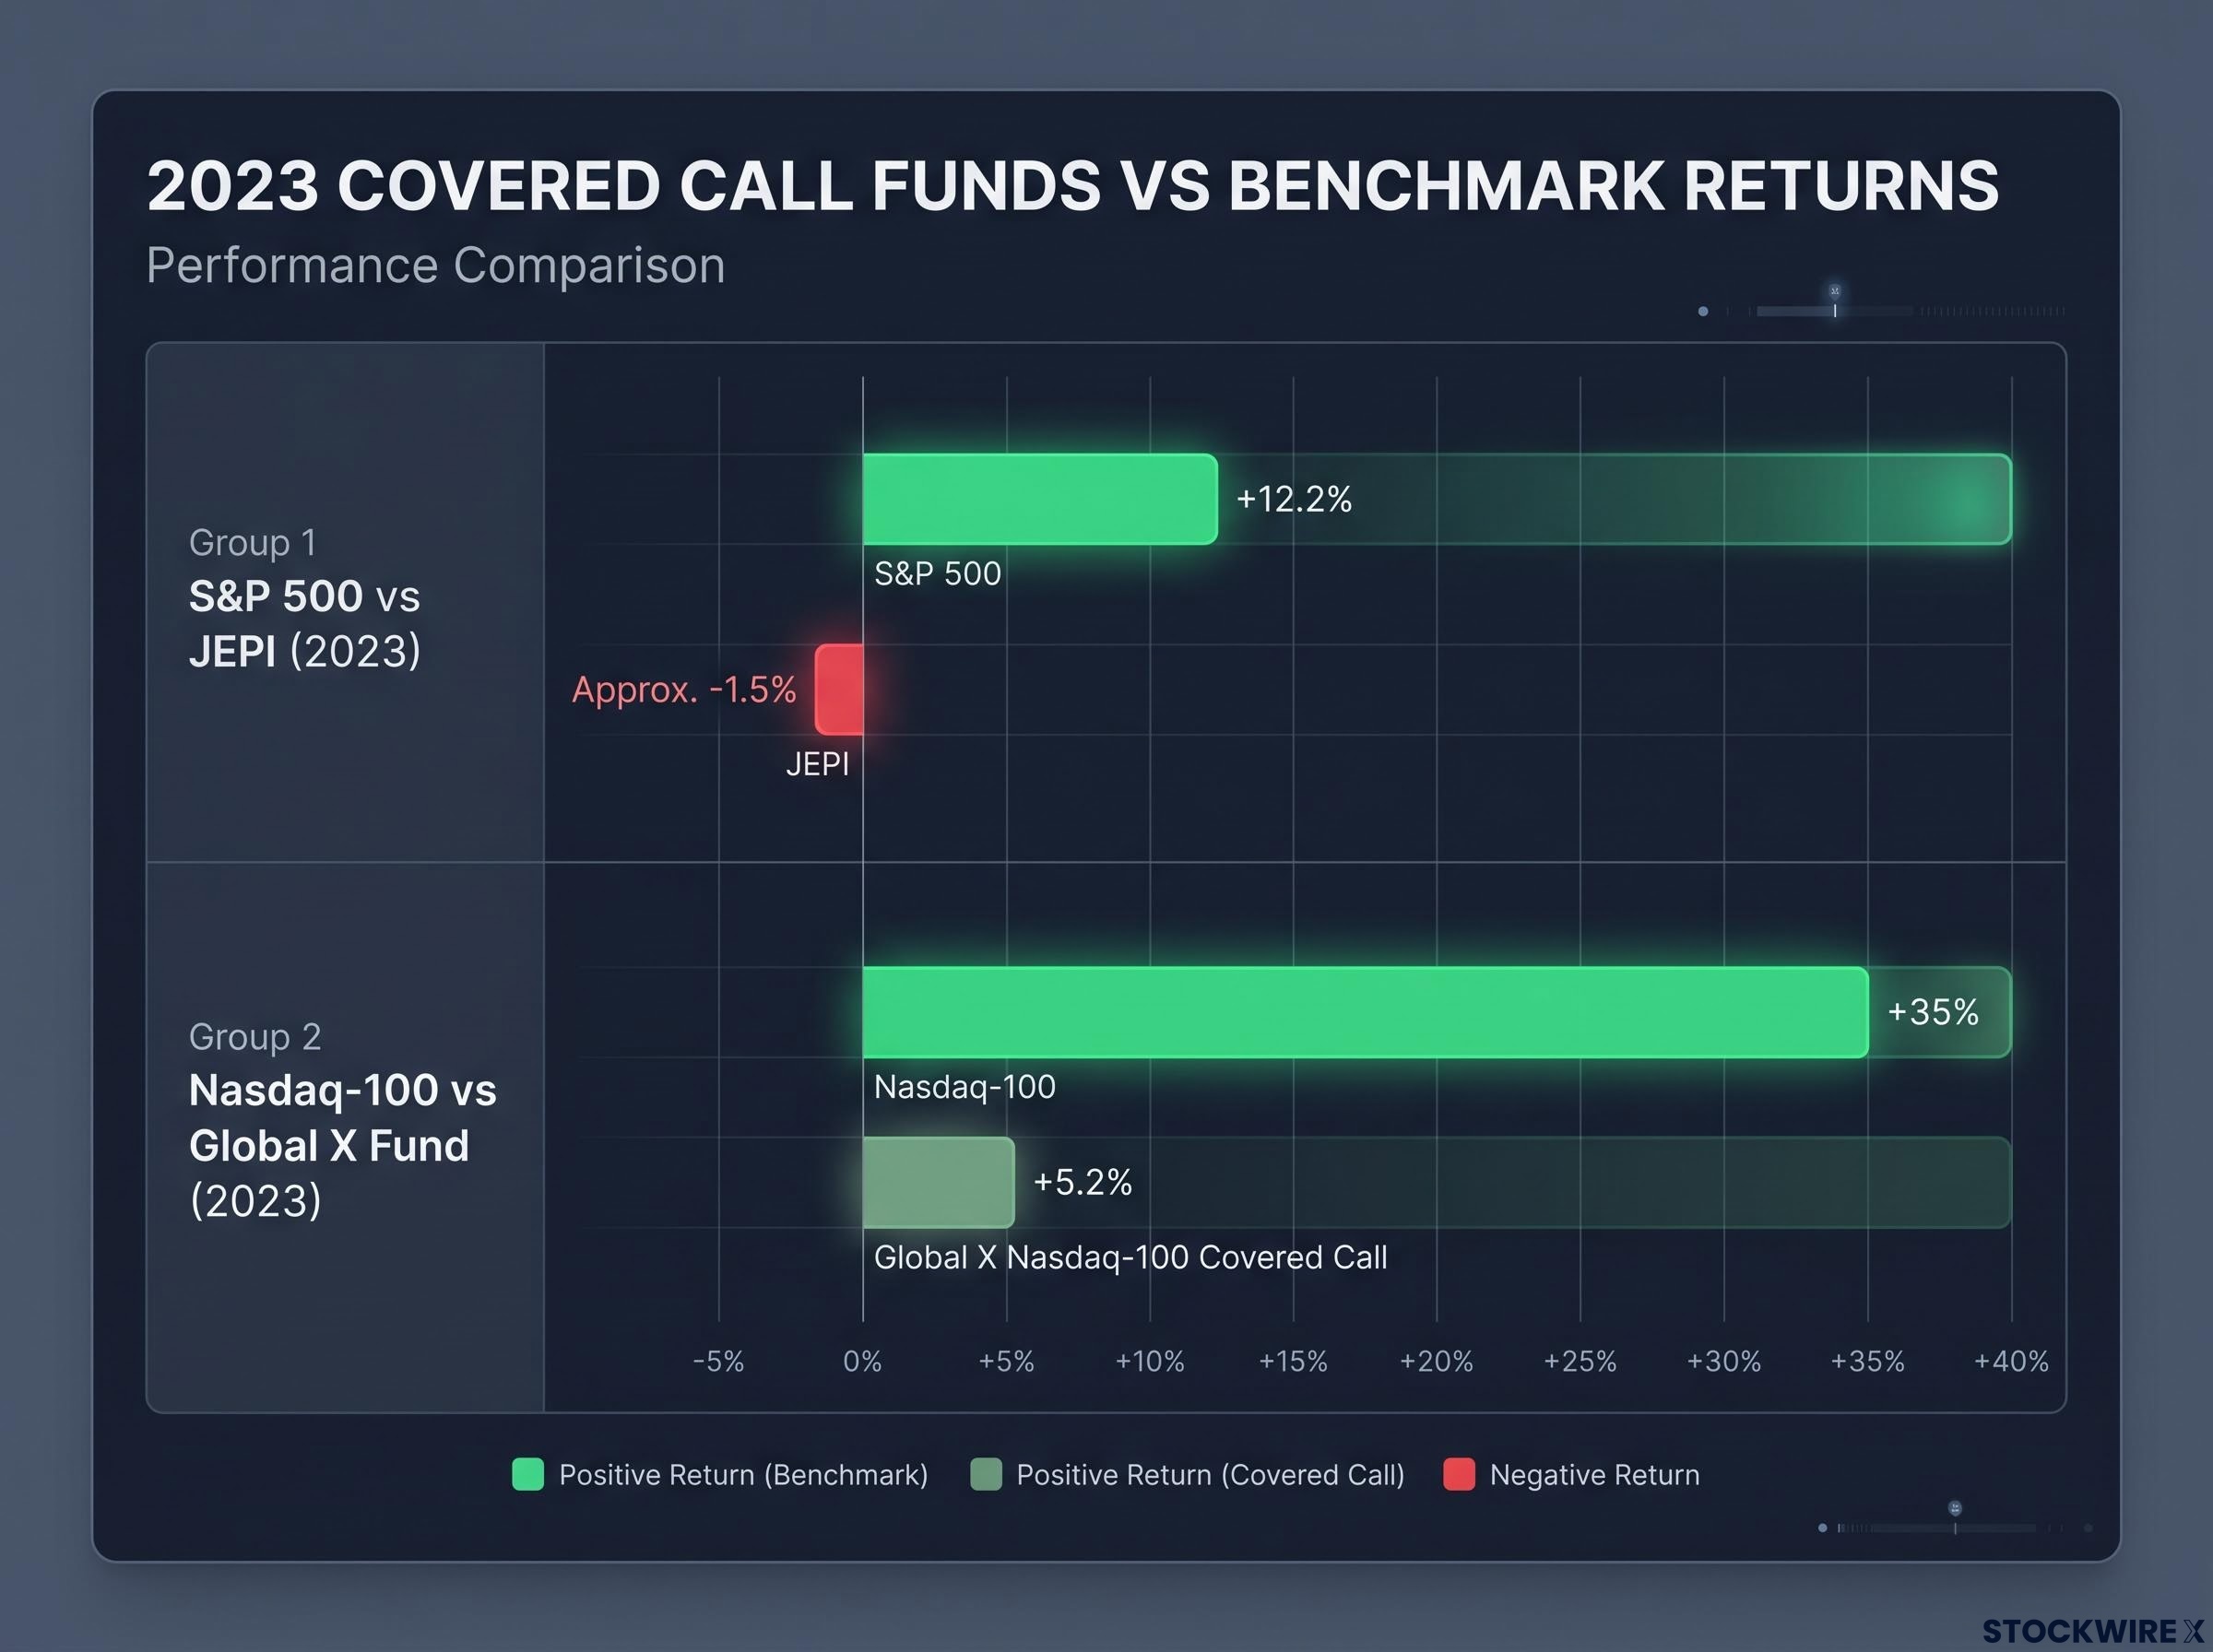
The cap is not a risk you manage around. The fund sold that upside to generate the premium, which means it cannot claw the gains back when the market runs past the strike. This is structural and predictable, not a sign of a manager getting it wrong.
The pattern repeats across periods and products.
| Period | Covered Call Fund | Covered Call Return | Benchmark | Benchmark Return |
|---|---|---|---|---|
| 2023 | JEPI | Approx. -1.5% | S&P 500 | +12.2% |
| 2023 | Global X Nasdaq-100 Covered Call | +5.2% | Nasdaq-100 | +35% |
| 2024 | S&P 500 Dividend Aristocrats Enhanced Covered Call Index | Approx. 5% | Dow Jones U.S. Dividend 100 Index | Approx. 12% |
| 10-year | Cboe S&P 500 BuyWrite Index | Approx. 64% of upside captured | S&P 500 | Approx. 70% of downside captured |
That BuyWrite figure is the cleanest summary of the trade. ProShares analysis shows the Cboe S&P 500 BuyWrite Index captured roughly 64% of the S&P 500’s upside and 70% of its downside over ten years, which adds up to meaningful long-run underperformance. The same lag appears in the widely cited QYLD versus QQQ comparison, where QYLD returned approximately 147% over ten years against roughly 512% for QQQ (a figure worth treating as indicative rather than confirmed).
The most important trade-off. iShares describes capped upside participation as the single most important trade-off in these products. When the underlying rises above the strike, the ETF forfeits the gains beyond that level and can underperform sharply in strong bull markets.
Read these numbers as a calibration tool, not a verdict. They tell you whether the market you expect actually matches the market these products are built for.
When the cap works in investors’ favour
The cap is not always a cost. In flat, choppy, or modestly declining markets, the premium income can beat a plain index position that gains little or nothing on price.
This is the regime these funds were designed for. Global X frames covered calls as a way to monetise sideways volatility, converting directionless price swings into cash flow. Schwab reaches a similar conclusion, noting that covered call funds can perform well in flat to modestly bullish conditions where premiums do the heavy lifting.
If you expect the next few years to grind sideways rather than sprint upward, the maths shifts in your favour.
Strike prices, expiry schedules, and how fund managers tune the income dial
You now understand the output: income in exchange for a cap. What sits behind it are two dials the fund manager can turn, and knowing how they work lets you read a fund’s mandate before you buy.
The first dial is the strike price. At-the-money options pay the highest premiums but slam the cap down immediately, leaving no room for share appreciation. Out-of-the-money options pay less premium but preserve a buffer, a band of gains the fund keeps before the strike surrenders the rest.
The second dial is the expiry schedule. The three main choices produce very different income and risk characters:
- Daily (0DTE): options written and settled within a single trading session, producing frequent premiums but extreme sensitivity to intraday moves
- Weekly: more frequent income than monthly, with correspondingly tighter caps
- Monthly (30-day): the most common structure, balancing premium size against income stability
Yield methodology matters too when you compare funds. JEPI reported a 30-day SEC yield of 8.20% against a trailing 12-month yield of 8.06% through mid-2026, a reminder that two funds quoting different yield measures are not always comparable on the headline number alone.
The premium a fund collects on any given writing cycle is not fixed; it fluctuates with implied volatility, the market’s expectation of future price swings, which means the same strike written in a calm month versus a turbulent one can produce dramatically different income.
Return of capital and why distribution yield can mislead
Here is where a lot of income investors misread their own tax documents. When a fund pays out more than its net income and realised gains, the excess is classified as return of capital (ROC) on your Form 1099.
ROC is your own money coming back. Return of capital is not taxed in the year you receive it. Instead, it reduces your cost basis, the price you are treated as having paid for your shares. The tax is deferred until you sell, at which point the lower basis produces a larger capital gain. Global X and ProShares both stress that ROC is a return of your original investment, not income the strategy earned.
This matters personally because a distribution that is partly a return of your own capital is not the same as earned income. Conflating the two leads you to overestimate how much your fund is genuinely producing.
There is a warning attached. Heavy, chronic ROC use can coincide with long-term NAV stagnation when payouts persistently exceed what premiums and dividends can sustainably fund. The headline yield stays high while the value of your holding quietly erodes.
NAV erosion is the slow, compounding cost that a headline yield number never shows: when distributions persistently exceed what premiums and dividends can sustainably generate, the value of your holding declines even as your monthly cheque arrives on schedule.
On the tax character of the rest: premiums received by U.S. funds are typically short-term capital gains, or for certain index options, Section 1256 gains, which the tax code treats as 60% long-term and 40% short-term regardless of holding period.
What covered call ETFs actually are: a foundational explainer for income investors
Step back and place the product in its proper box. A covered call ETF sits between a pure equity fund and a bond-style income vehicle. It carries the full downside of the stocks it holds while deliberately trading away upside participation in return for current yield.
The structure is a stack. The fund holds equities at the base, and the options writing is layered on top. That ordering matters, because the primary driver of the fund’s price direction is always the underlying stock or index. The options overlay shapes the return; it does not replace the equity engine.
This is where the contrast with a dividend ETF becomes the clearest frame you have:
- Income source: dividend ETFs earn income from company earnings distributions; covered call ETFs earn income by selling part of the upside
- Upside participation: dividend ETFs keep full upside; covered call ETFs cap it at the strike
- Downside exposure: both carry full equity downside
If a higher yield is what drew you to covered call ETFs, that differential is not a free upgrade. It is a structural exchange, and what you give up is the long-term compounding a full-upside position would have delivered in a rising market.
The category has matured from a standing start. The first U.S. covered call ETF launched in 2007, and the space now spans tens of billions in assets across a wide yield spectrum.
| Fund Ticker | Fund Name | AUM (approx.) | Trailing Yield (approx.) | Option Writing Frequency |
|---|---|---|---|---|
| JEPI | JPMorgan Equity Premium Income ETF | $46.3B | 8% | Monthly |
| QYLD | Global X Nasdaq-100 Covered Call ETF | $8.3B | 11-12% | Monthly |
| XYLD | Global X S&P 500 Covered Call ETF | $3.3B | 9-11% | Monthly |
| DIVO | Amplify CWP Enhanced Dividend Income ETF | Not disclosed | 6.2% | Selective |
The yield spread from DIVO’s selective 6.2% to QYLD’s aggressive 11-12% tells you how much premium a fund is writing away. Higher yield means a tighter cap. That framing helps you match the product to what you actually need: current cash flow in flat or choppy conditions, not growth-oriented compounding through a long bull market.
The new generation: 0DTE options, single-stock funds, and structural leverage
The original model has one obvious weakness: it lags plain index funds when markets rise. Each new generation of product is a response to that limitation, and your job is to judge whether each one actually solves the problem or simply reprices it.
The first response was structural leverage. Introduced around 2021 and credited to Hamilton ETFs chairman Rob Wessel, the model applies a modest 25% borrowing ratio specifically to close the performance gap during rising markets. The clever part is what it does to risk: the added leverage roughly offsets the volatility-dampening effect of the option premium, so the overall risk profile normalises back toward the underlying benchmark rather than amplifying dramatically beyond it.
Then came the daily-expiry products. Roundhill’s XDTE, the first ETF to use 0DTE options on the S&P 500, began trading on 7 March 2024, writing and settling options within a single session and paying weekly distributions. The trade-off is severe sensitivity. Interactive Brokers describes 0DTE options as especially sensitive to intraday price moves, implied volatility shifts, and events, with a real risk of total premium loss.
A unique, high-risk, and rapidly growing segment. Schwab characterises 0DTE strategies this way, warning that profits can vanish quickly and that minor price moves can produce large losses, compounded by thin liquidity near expiration.
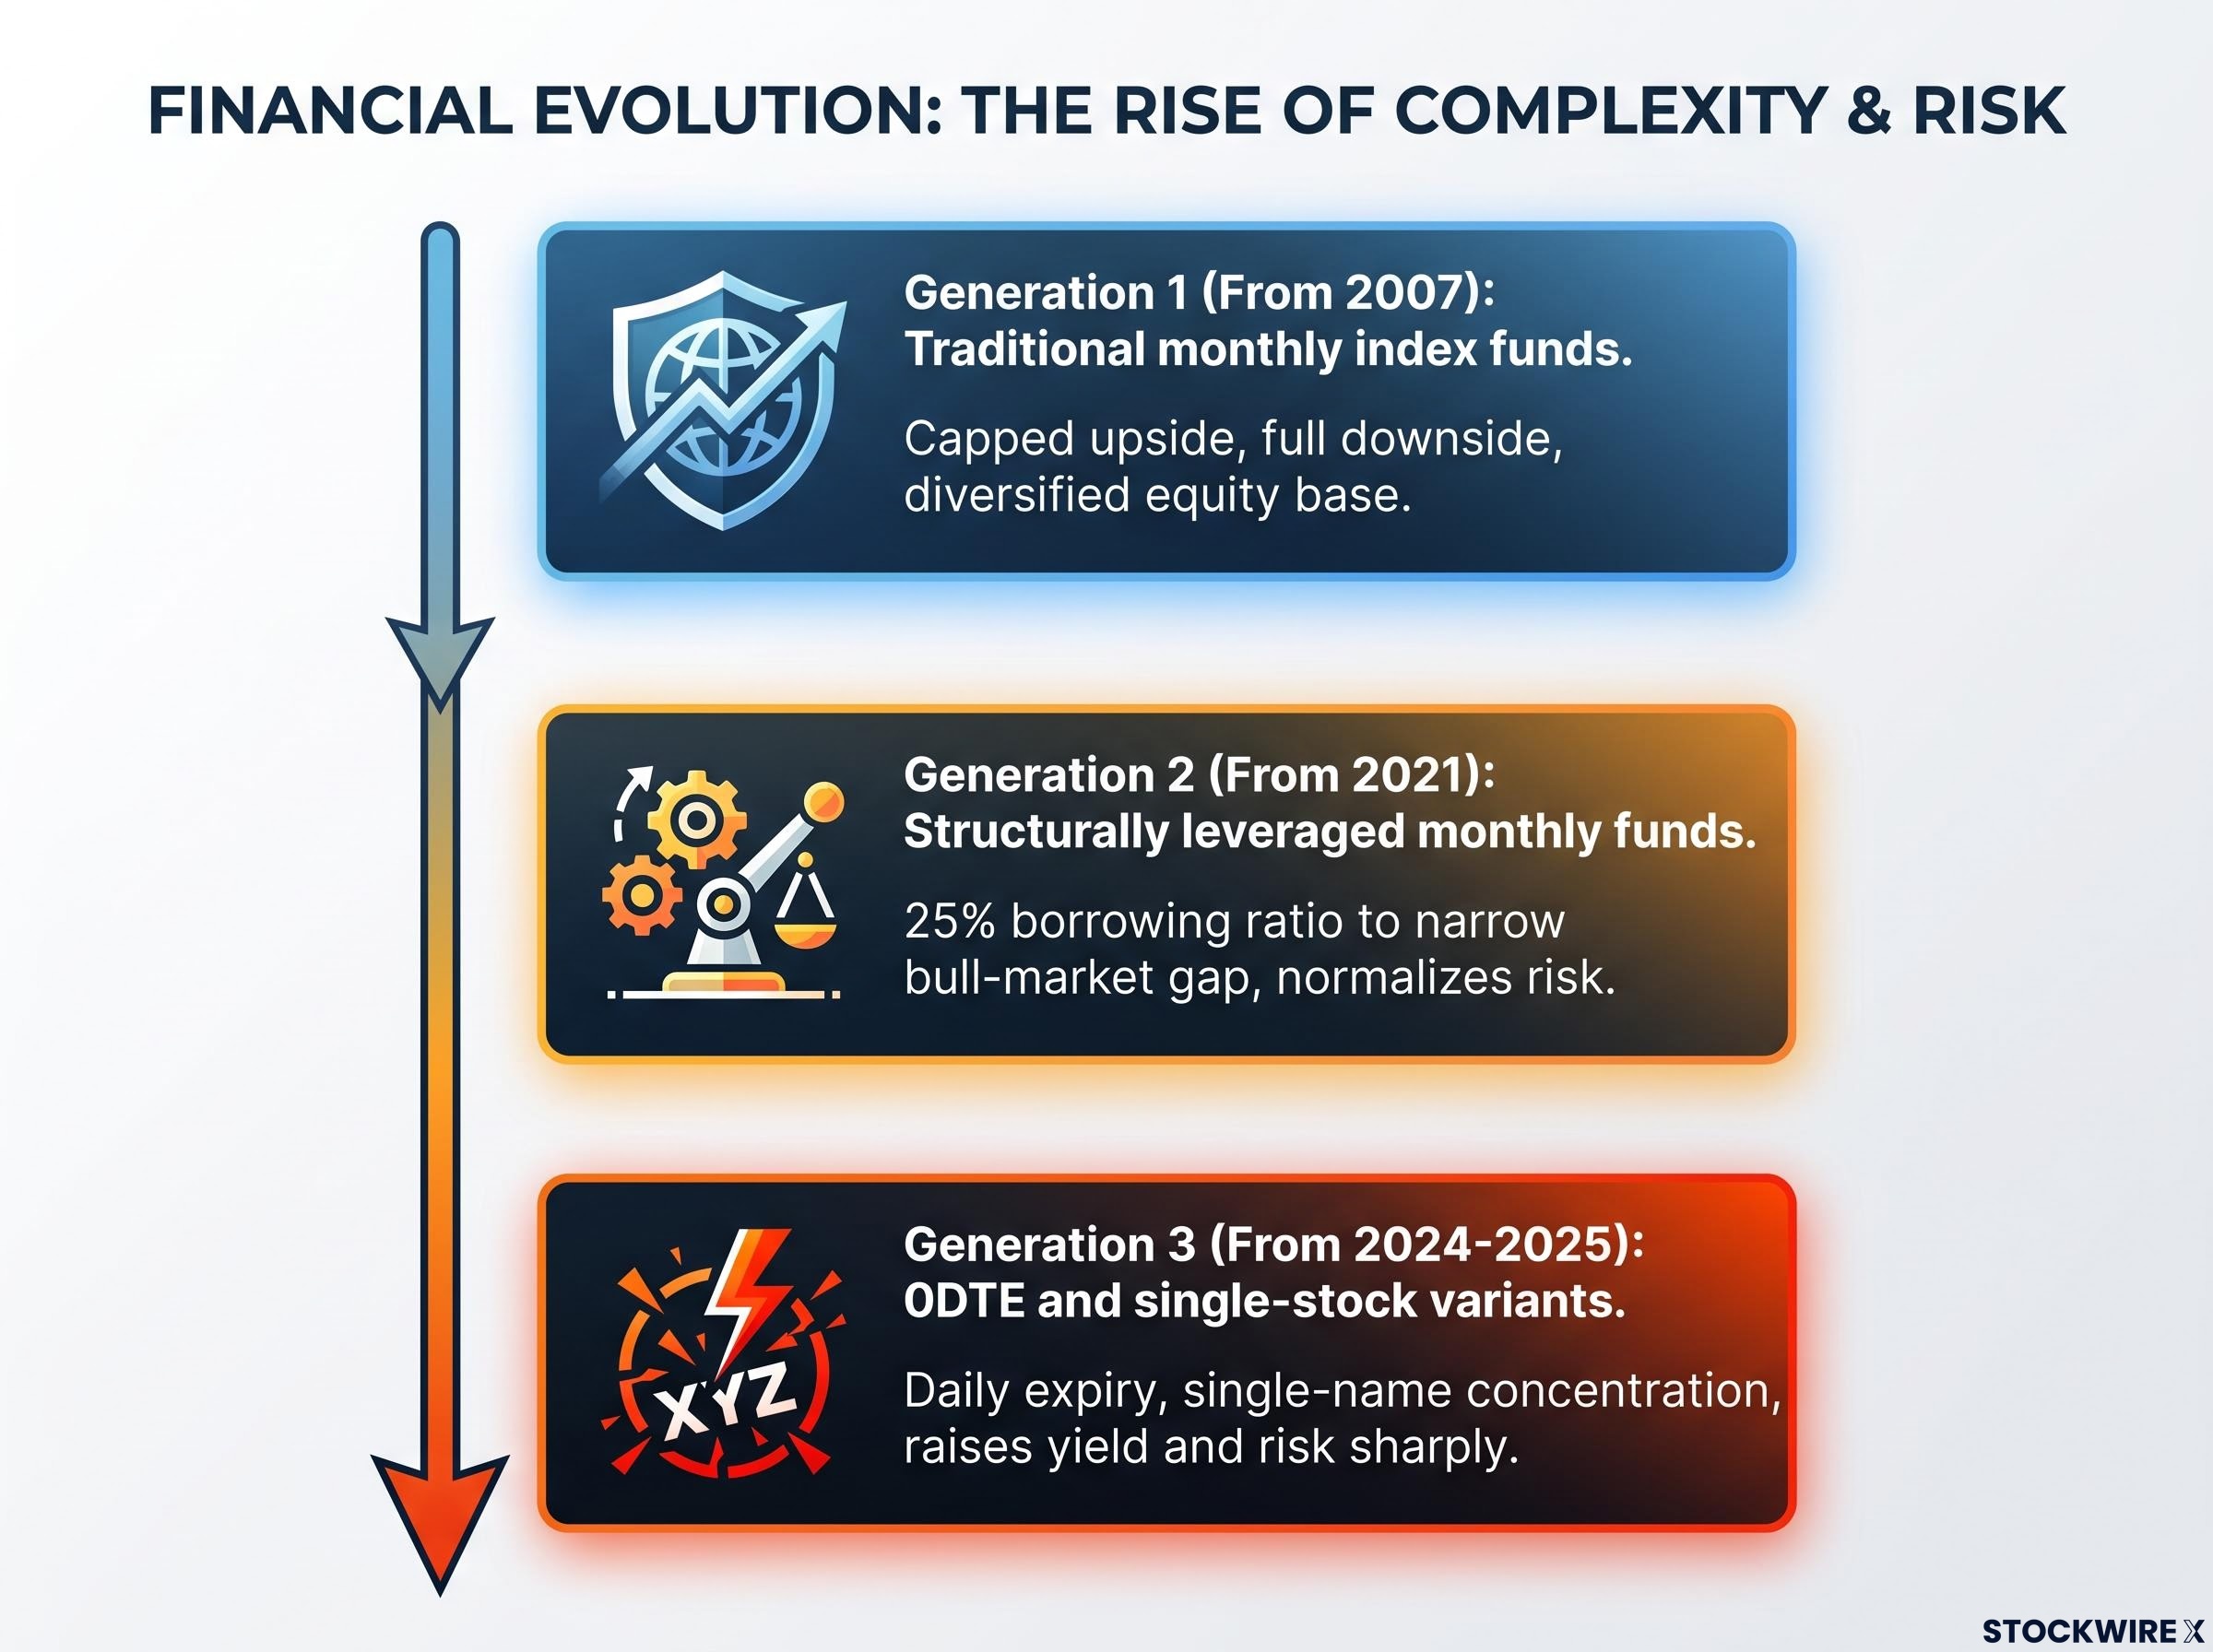
The three generations line up like this:
- Traditional monthly index funds (from 2007): capped upside, full downside, diversified equity base
- Structurally leveraged monthly funds (from 2021): added borrowing to narrow the bull-market gap, normalising risk back toward the index
- 0DTE and single-stock variants (from around 2024-2025): daily expiry and single-name concentration, raising both yield and risk floor sharply
Single-stock and 0DTE funds: what the higher yield is telling you
The single-stock variant is the highest-yield, highest-risk version of the idea. YieldMax products and a suite of Tuttle Capital 0DTE funds, at least nine registered as of May 2025 covering names like AAPL, GOOGL, META, TSLA, NVDA, AMZN, MSFT, MSTR and COIN, write options on one stock at a time.
That concentration erases the diversification benefit of index-based funds. You are now absorbing a single company’s idiosyncratic risk on top of the options overlay risk. YieldMax single-stock funds carry expense ratios around 0.99%, and reported yields ranging from 0% to above 50% (an indicative range rather than a confirmed one) signal extreme variability, not sustainable income.
With minimal track records, these products are hard to evaluate using standard income-investor frameworks. The right question is never “what does this pay?” It is “what am I absorbing in exchange for that number?”
Making a clear-eyed call on covered call ETFs before putting cash to work
Suitability starts with your view of the market ahead. If you expect flat, choppy, or modestly declining conditions, you have a genuine structural case for these funds. If you expect a sustained bull market, model the upside you would forgo at your expected return rate before you commit, because the cap will cost you the most exactly when the market rewards patience most.
Discipline your comparison. Global X and Schwab both identify flat to modestly bullish or choppy markets as the environment where these funds can match or beat a plain index. Test that against a full market cycle on a total return basis, never on yield or a price-only chart. Robert Huebscher has calculated that funds such as PBP and XYLD lagged the S&P 500 by 612 to 623 basis points per year over long horizons (a figure worth treating with caution), and higher expense ratios than passive index funds add drag that compounds over time.
The distinction between total return versus yield is not a minor accounting preference; it is the single most consequential framing decision an income investor makes, because a fund optimised to maximise distributions will systematically sacrifice the compounding that drives long-run wealth accumulation.
Run any covered call ETF through these five questions before buying:
- What market regime do I actually expect, and does it match what this fund is built for?
- How does it compare to a plain index ETF on total return over a full cycle?
- Am I holding it in the right account for the tax character of its distributions?
- How much of the distribution is return of capital rather than earned income?
- Does the fund have enough track record to evaluate properly?
The tax-location point is actionable right now. Because these distributions skew toward ordinary income and short-term gains rather than qualified dividends, holding a covered call ETF in a taxable brokerage account means paying a higher effective rate on every cheque than you would on qualified dividends. Repositioning into a tax-advantaged account like an IRA or 401k keeps more of each distribution in your pocket.
High yield and high total return are not the same outcome. Covered call ETFs are explicitly designed to prioritise current distribution yield over long-run total return. Knowing which one you are buying is the whole game.
This article is for informational purposes only and should not be considered financial advice. Investors should conduct their own research and consult with financial professionals before making investment decisions. Past performance does not guarantee future results. Financial projections are subject to market conditions and various risk factors.