A covered call ETF paying nearly 13% a year sounds like it should crush both a dividend portfolio and a plain index fund on total return. The data over the same stretch tells a more complicated story.
Here is the tension facing a Canadian investor approaching or in retirement. Index funds maximise long-run wealth, but they force you to sell assets to generate spending cash. Dividend portfolios trail because they exclude the high-growth companies that pay nothing. Covered call ETFs throw off cash automatically, but they cap the upside that drives compounding.
This is not a theoretical debate. It is a decision with measurable consequences for how long a portfolio lasts.
What comes next gives you an evidence-based basis for deciding which approach fits your situation. That means the actual return data across bull and bear markets, the structural mechanics that explain those results, and the Canadian tax rules that quietly shift the comparison once you leave a registered account.
What the total-return numbers actually show
Start with a single question the raw performance data forces you to abandon: “do covered call ETFs underperform?” The honest answer is that it depends entirely on which variant you buy and over what horizon you hold it.
Dividend total return is frequently misread by income-focused investors because each distribution reduces the stock price by approximately the same amount on the ex-dividend date, meaning yield and wealth creation are not the same variable, which is precisely why high-dividend portfolios can trail broad indices even in years when their payout records look healthy.
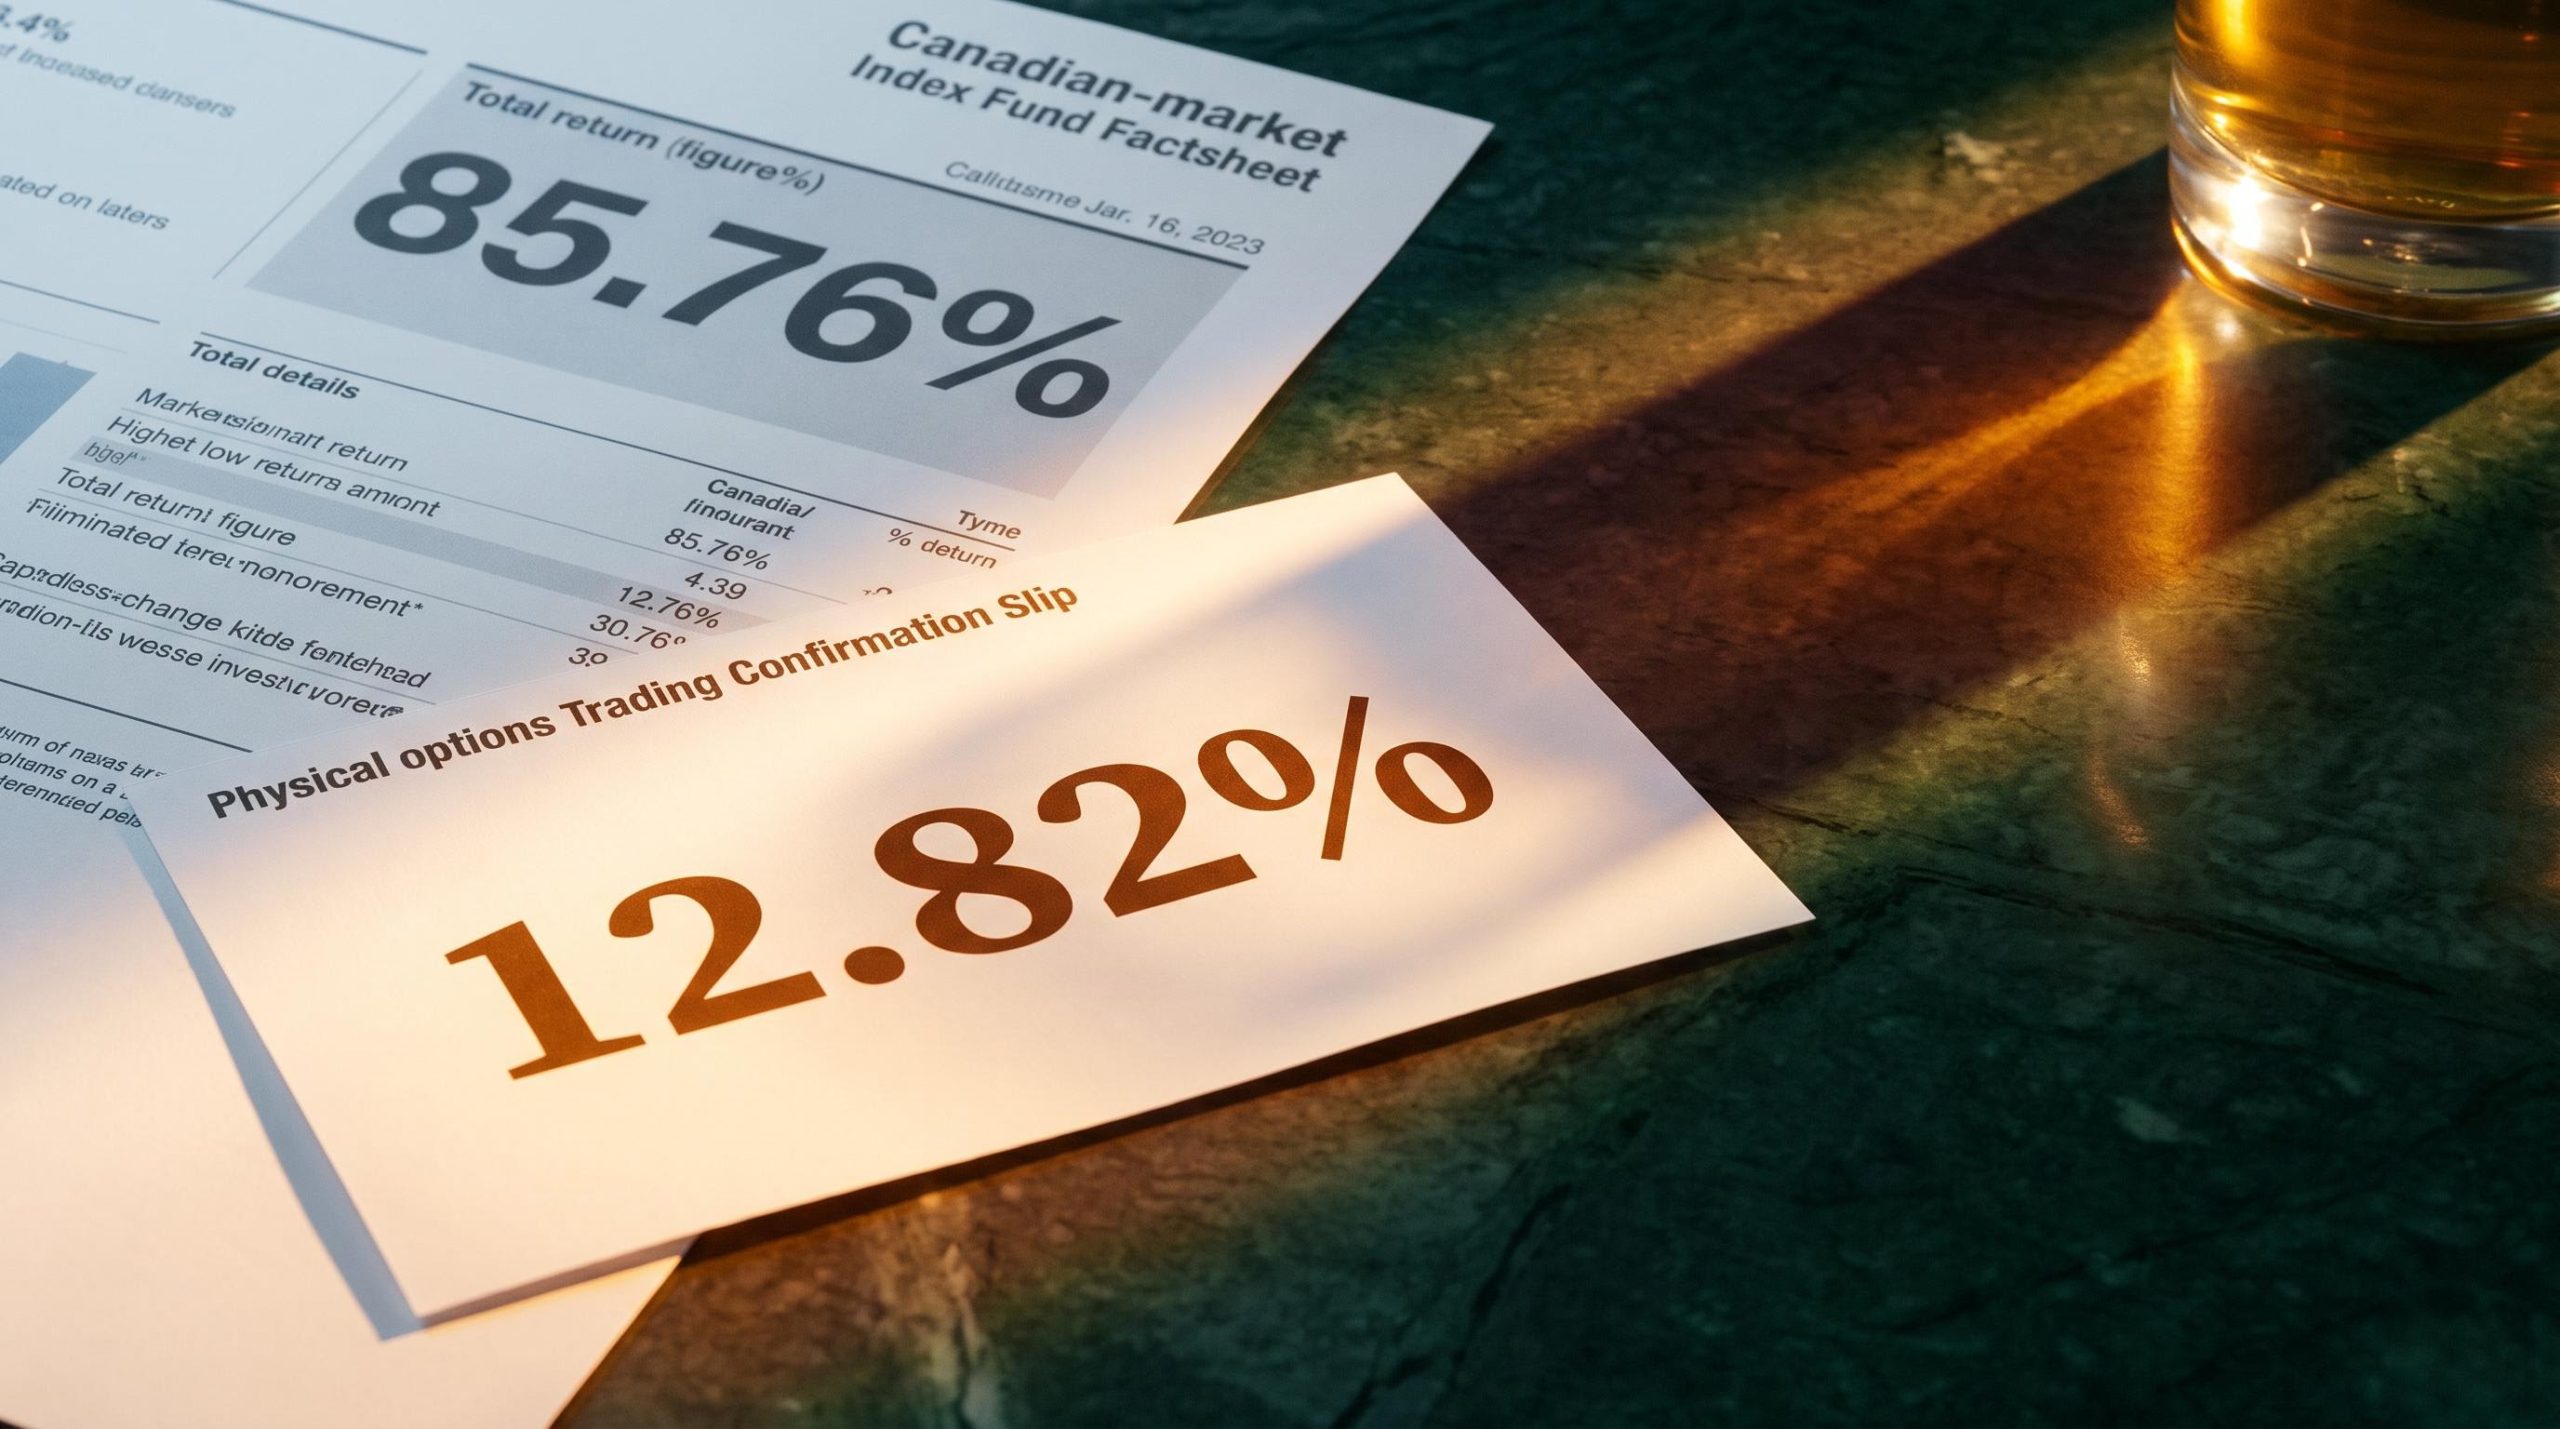
Take the window from October 2023 to early July 2026, a period dominated by rising markets. In large-cap US equities, a baseline Canadian index returned 85.76%. The unleveraged covered call equivalent managed only 67.19%, a wide gap. The leveraged covered call version, though, came in at 82.49%, within striking distance of the index it was supposed to trail badly.
The pattern repeats in technology. A standard tech index delivered 106.9% over the same period. The unleveraged tech option fund returned 83%. The leveraged tech option fund reached 105.26%, effectively matching the benchmark.
| Strategy type | Large-cap US return | Technology return | Notes |
|---|---|---|---|
| Baseline index | 85.76% | 106.9% | No option overlay, no leverage |
| Unleveraged covered call | 67.19% | 83% | Widest lag versus index |
| Leveraged covered call | 82.49% | 105.26% | Near-parity over this window |
The counterintuitive finding is the leveraged variant. Most investors assume leverage adds risk without adding proportionate return, yet here the modest borrowing came close to closing the entire gap.
The limit of this data is the market it captured. This was a bull run. A sustained bear market flips the picture entirely, and covered call structures have a track record when that happens.
The bear-market counterpoint BMO’s covered call technology ETF (ZWT) delivered a total return of negative 30.86% in 2022, against its technology benchmark’s decline of just negative 5.84%.
Unleveraged funds fared better in that downturn. The Global X S&P 500 Covered Call ETF (XYLD) fell 12.1% in 2022 versus the S&P 500’s 18.2% drop, a genuine cushion.
So the near-parity of leveraged covered call ETFs over 2023 to 2026 tells you the trade-off is not fixed. It does not tell you how the same structure behaves across a full cycle that includes a prolonged bear market. That distinction is what should drive your decision, not the headline return from a friendly window.
When big ASX news breaks, our subscribers know first
Why the structure creates these results, and where leverage changes the equation
The numbers make sense once you understand the mechanism underneath them. Covered call ETFs sell future upside in exchange for premium income today.
When a fund writes a call option, it agrees to hand over a stock at a set price (the strike) if the buyer wants it. In a flat or gently rising market, the option expires worthless and the fund keeps the premium as pure income. In a rapidly rising market, the option lands in-the-money, and the fund must settle appreciated positions at the strike and forfeit any gains above it.
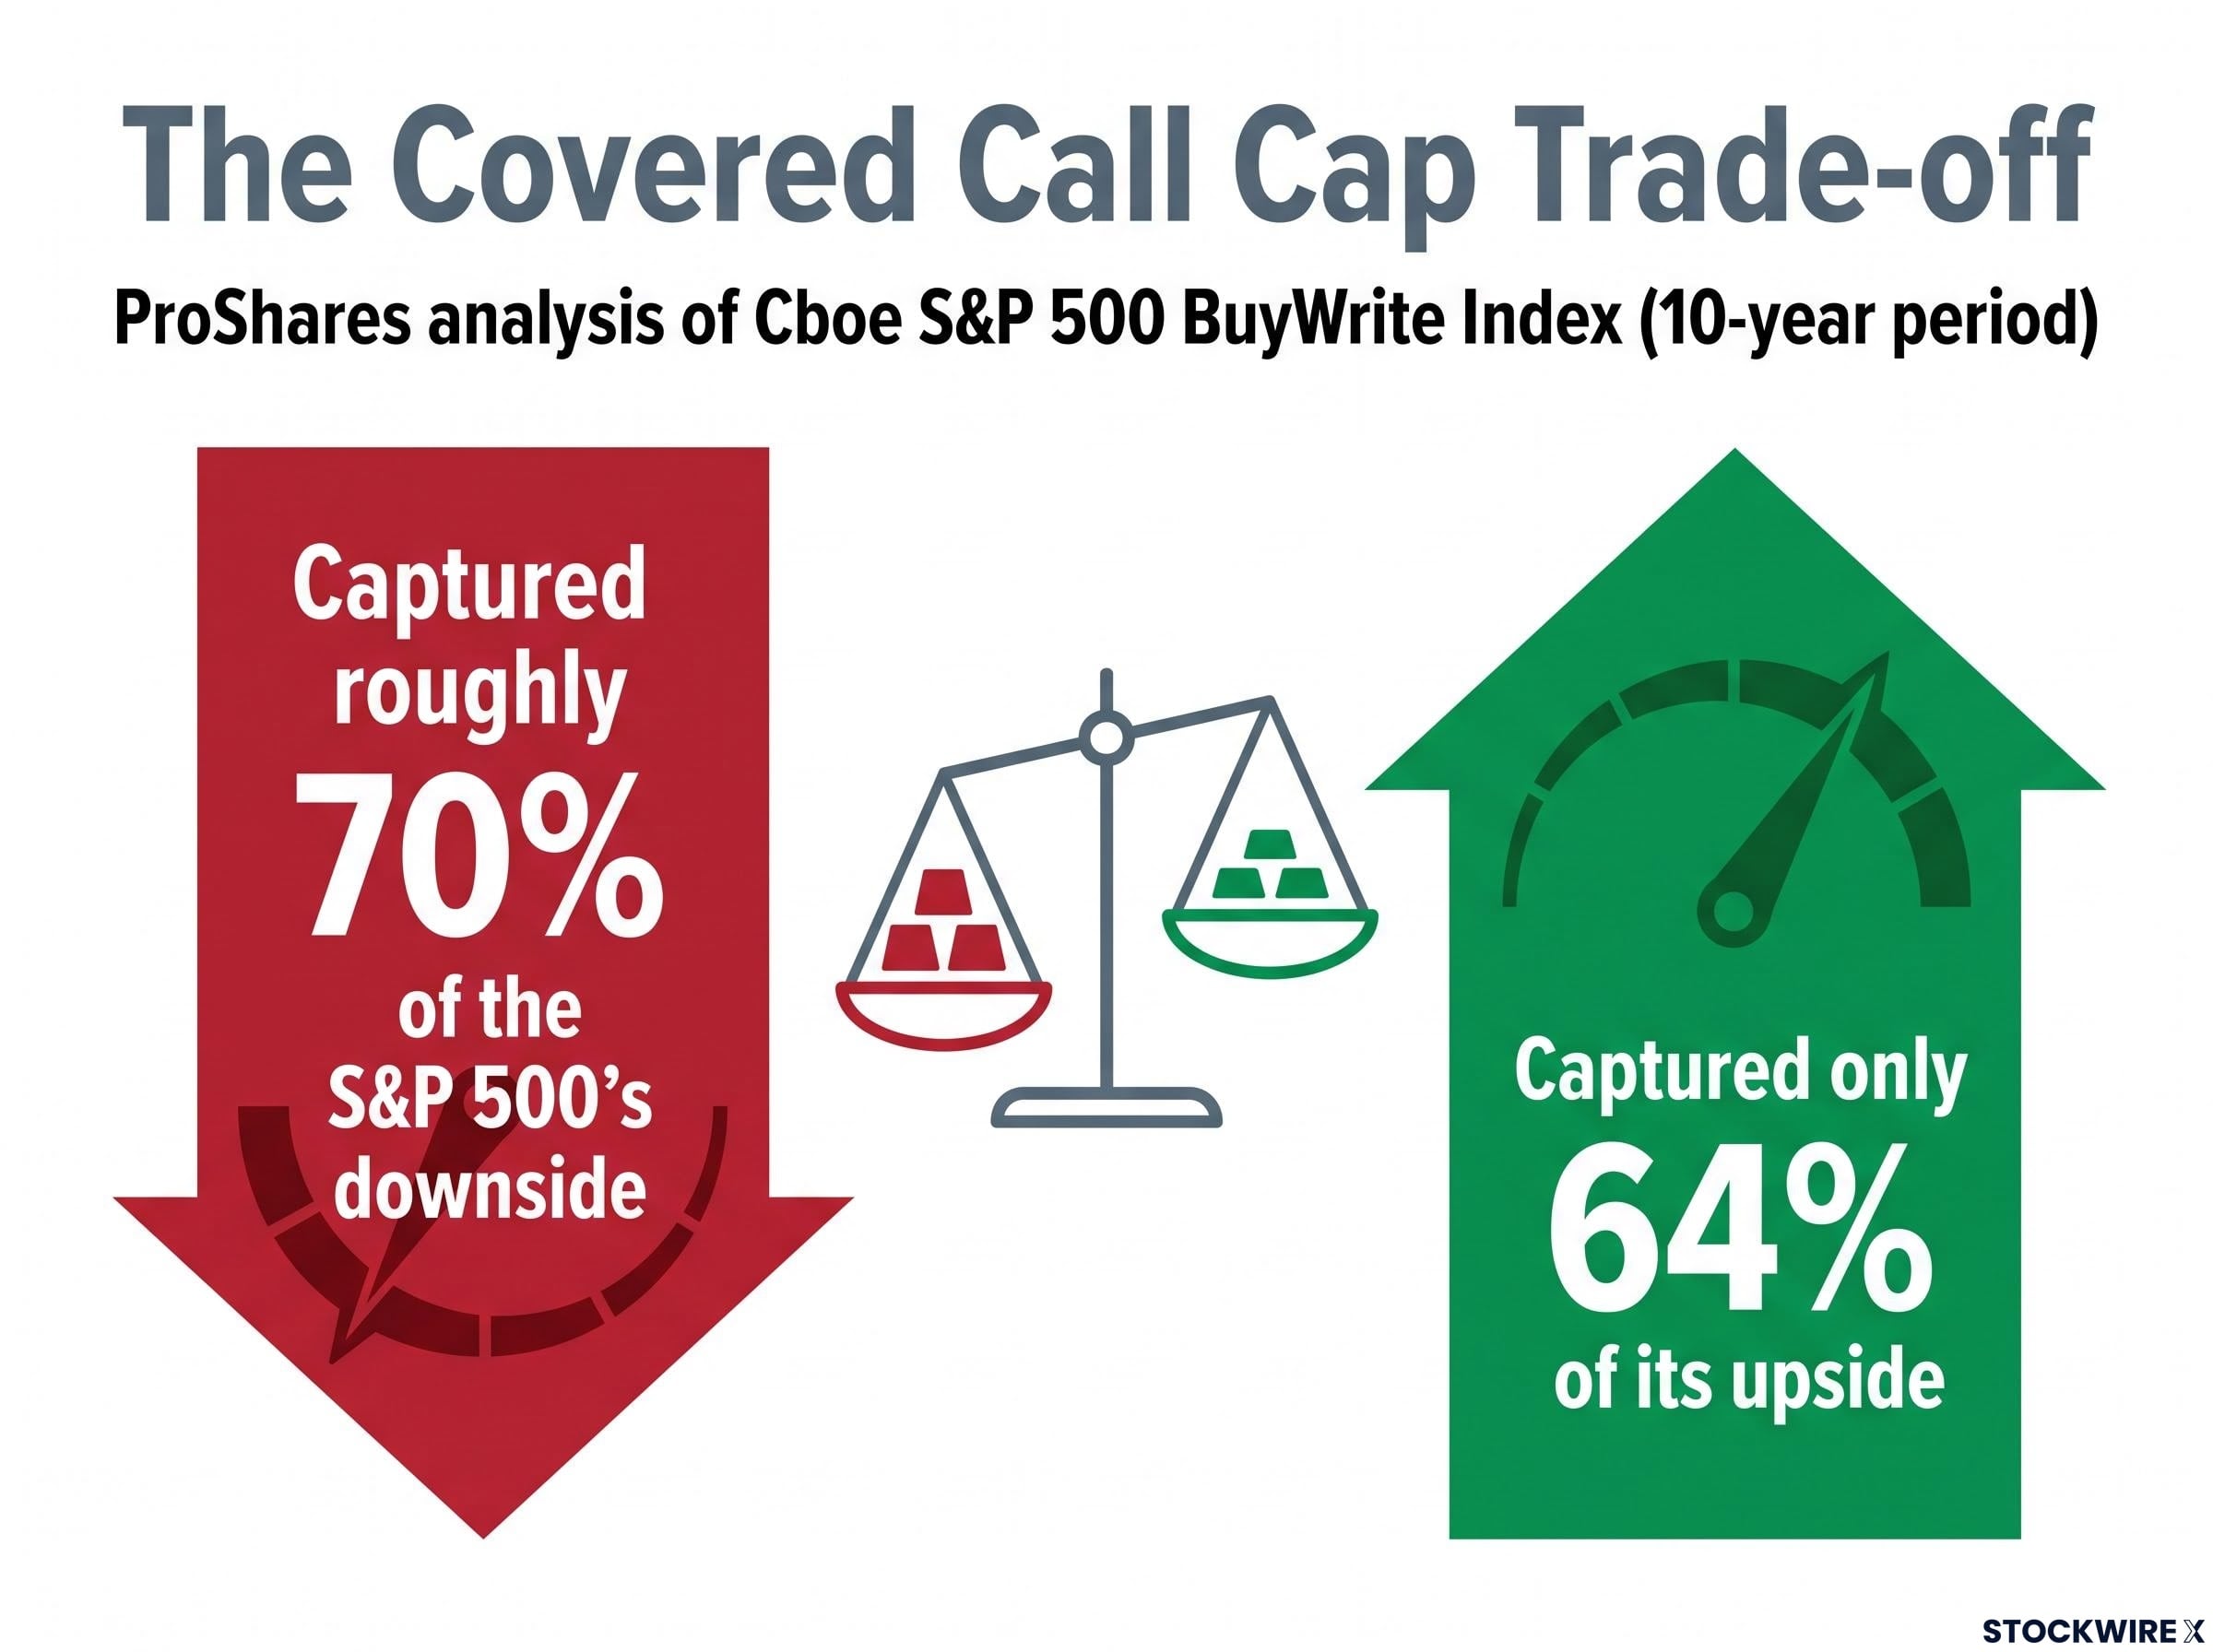
That cap is the core reason unleveraged covered call funds trail broad indices over the long run. ProShares’ analysis of the Cboe S&P 500 BuyWrite Index found that over ten years, the index captured roughly 70% of the S&P 500’s downside but only 64% of its upside. You give up more of the good than you avoid of the bad.
The Cboe S&P 500 BuyWrite Index provides the benchmark construction that underlies most covered call performance comparisons, tracking a hypothetical strategy of holding the S&P 500 while systematically writing monthly at-the-money calls against the position.
How leverage attempts to close the return gap
Leveraged covered call ETFs try to compensate for that cap by overlaying roughly 1.25 times cash exposure to the underlying equities, as seen in funds like HYLD and HDIV. A larger equity base generates more premium income and more participation in gains, which is exactly why the leveraged variants nearly matched their benchmarks in the recent bull run.
The catch is asymmetry. The upside stays capped, but the downside gets amplified. This is what separates a leveraged covered call fund from a plain leveraged equity fund.
The 2022 results expose it starkly. The Hamilton Enhanced Canadian Covered Call ETF (HDIV) fell 6.10% that year. The leveraged US equivalent (HYLD) fell 18.85%, roughly three times as much, with modest leverage and withholding taxes both dragging on the result.
There is a second subtlety. Because leverage resets daily, it interacts with volatility drag, meaning choppy markets can erode returns beyond what simply multiplying by 1.25 would suggest. The mechanism that magnifies gains magnifies losses in ways the intuition does not capture.
For a Canadian planning a multi-decade hold, this creates a specific risk you need to name out loud: capital decay during prolonged downturns that premium income alone cannot repair. The relevant risk factors are:
- Upside cap: gains above the strike are surrendered in rising markets
- Volatility drag: daily leverage resets erode returns in choppy conditions
- Capital decay risk: amplified drawdowns in sustained bear markets can permanently impair capital
- Return of Capital masking NAV erosion: distributions can look healthy while the underlying portfolio shrinks
Understanding the mechanism prevents the single most common misreading of these funds. Treating a 12% yield as a proxy for total return ignores the net asset value erosion that occurs whenever distributions run ahead of what the portfolio is actually earning.
The decumulation case that pure return comparisons miss
The total-return framework is correct on its own terms. It also misses something real, and for one specific type of investor, that omission matters more than the return gap does.
That investor is in decumulation, drawing down a portfolio to fund retirement. For them, the abstract question of long-run total return sits alongside a more immediate one: sequence of returns risk, the danger that poor returns early in retirement force asset sales at depressed prices and permanently shrink the pot.
Sequence of returns risk can drain an otherwise identical million-dollar portfolio dry by year 17 while a luckier investor finishes with nearly ten times as much, determined entirely by the order returns arrive rather than their long-run average, which is the structural vulnerability that automated cash flow from covered call ETFs is designed to reduce.
Here the covered call argument is at its strongest. These funds generate cash automatically, which removes the need to time asset sales. That eliminates both the emotional difficulty of selling into a falling market and the structural damage of doing so at the wrong moment. A 12.82% yield from a fund like HYLD, against the comparatively modest yield of a broad S&P 500 index fund, is a concrete cash-flow difference for a retiree who needs spending money every month.
The counterpoint is where it gets uncomfortable. Analysts including Ben Felix at PWL Capital and researchers at Morningstar warn that investors routinely confuse cash flow with total return.
Generating income through covered calls reduces expected returns and leaves an investor fully exposed to market downsides. Where distributions lean on Return of Capital and market returns fall short, the yield is funded by shrinking the fund’s own net asset value rather than by genuine earnings.
Return of Capital here means part of your distribution is simply your own money handed back. It reduces the fund’s adjusted cost base and defers tax, but it can mask capital decay while the headline yield looks perfectly healthy.
That is why total-return planners often prefer a Systematic Withdrawal Plan, selling a small, controlled slice of a broad index fund on a schedule, combined with a one to three year cash buffer to ride out downturns without forced sales. It is a legitimate competing solution, not an inferior one.
Before choosing a covered call ETF over that approach, apply three tests:
- Does your withdrawal rate align with the sustainable total return of the underlying portfolio, or does it exceed it?
- Does the automated cash flow solve a real behavioural problem for you specifically, or just a theoretical one?
- Does the tax treatment in your particular account type actually improve your net outcome?
The decisive point is the first test. If your withdrawal rate exceeds what the portfolio can sustainably fund, a 13% yield is not solving your problem. It is accelerating it, because the yield and the total return are not independent figures.
The Canadian tax layer that reshapes the comparison for taxable accounts
Tax is not a footnote to this comparison. It changes which strategy wins, and it does so differently depending entirely on where you hold the fund.
Start with the pivot. Inside registered accounts, tax treatment is irrelevant. Outside them, it can become the deciding factor.
| Income type | Taxable account treatment | Registered account treatment | Key implication |
|---|---|---|---|
| Option premium (capital gains) | 50% inclusion rate at marginal tax | Fully sheltered | Efficient for high earners in taxable accounts |
| Eligible dividends | Dividend tax credit applies | Fully sheltered | Favours lower earners in taxable accounts |
| Return of Capital | Not taxed when received; reduces ACB | Fully sheltered | Defers tax, triggers larger gain on sale |
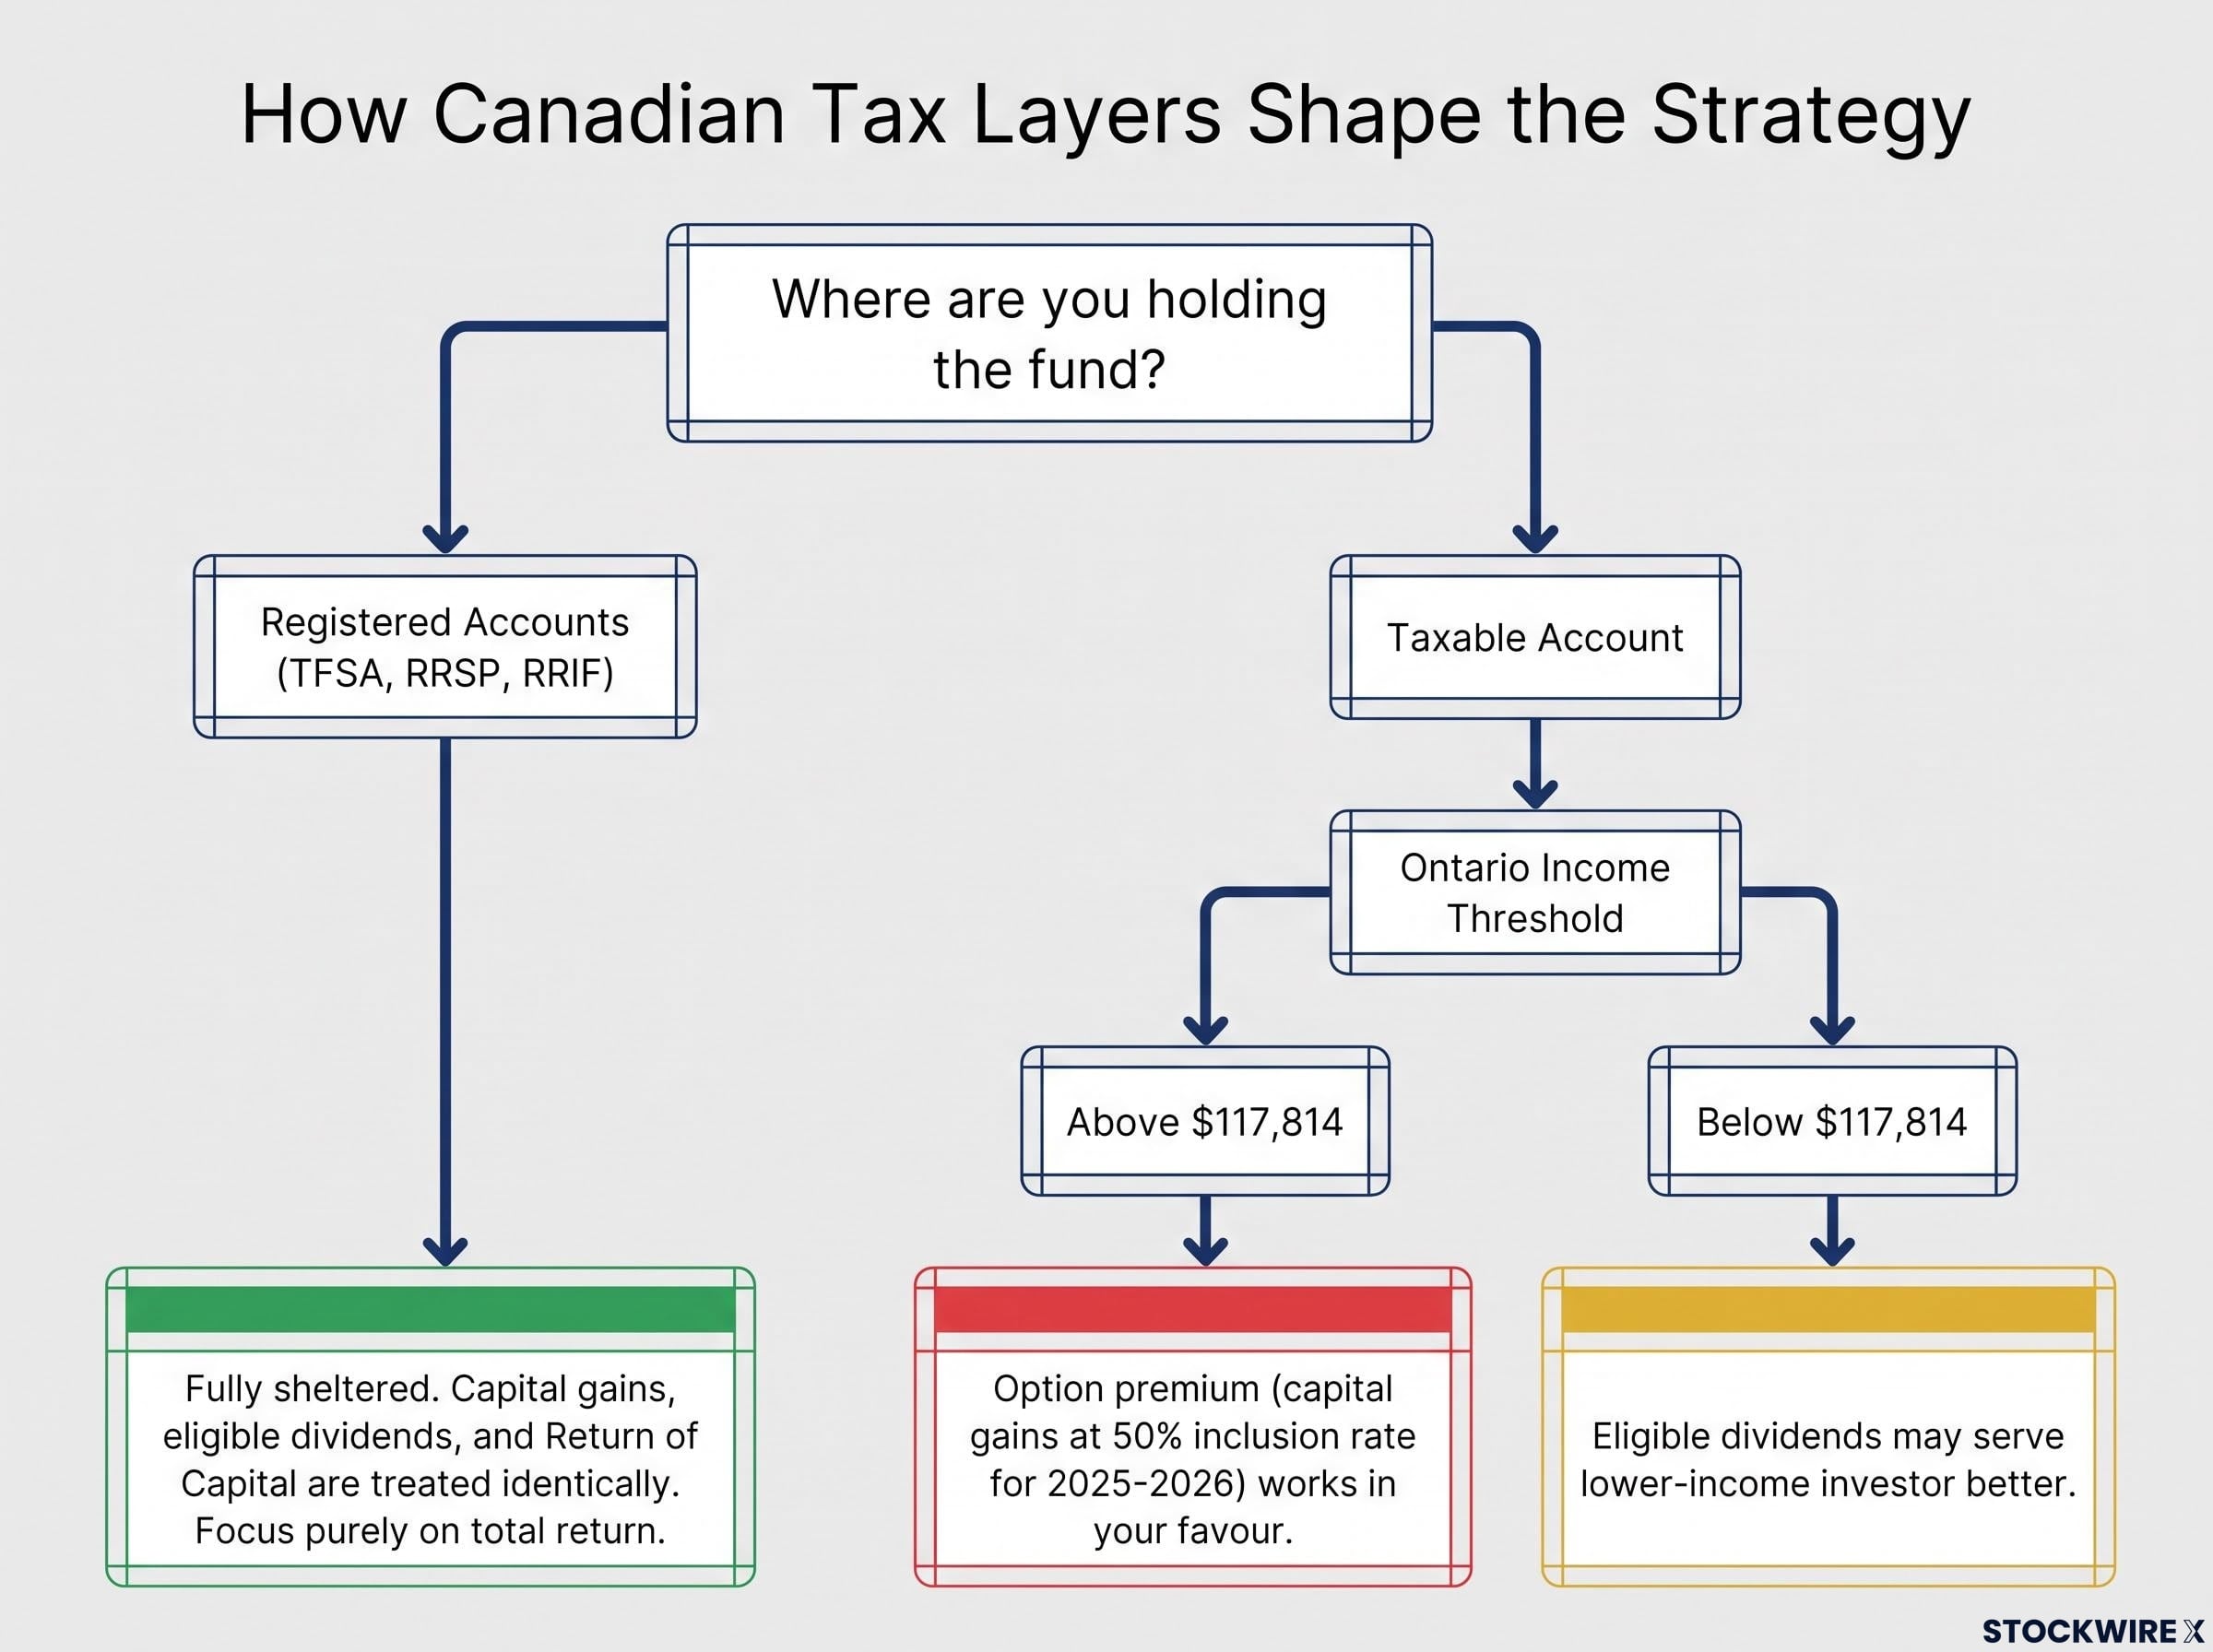
In a taxable account, option premium income classified as a capital gain is taxed at a 50% inclusion rate, confirmed as the rate for 2025 to 2026 after the proposed increase to 66.67% was not implemented. Only half of the gain is added to your income and taxed at your marginal rate. That makes it meaningfully more efficient than employment income for a higher earner.
Covered call ETF tax treatment in Canada splits a single distribution across up to five T3 categories, each taxed at a different effective rate, so two funds with identical headline yields can produce materially different after-tax returns depending on how the fund classifies its income.
The threshold is where this becomes concrete. In Ontario, investors reporting above $117,814 face a lower effective tax rate on capital gains than on eligible dividends. Above that line, the covered call ETF’s tax profile works in your favour. Below it, eligible dividends may serve a lower-income investor better.
The Ontario 2026 combined federal and provincial tax rates confirm the income brackets that determine whether capital gains or eligible dividends carry the lower effective rate for a given investor, with the crossover point sitting near the $117,814 threshold referenced in the article.
Return of Capital adds a wrinkle. It is not taxed when received, but it lowers your adjusted cost base, so a larger capital gain surfaces when you eventually sell. The tax is deferred, not erased.
Inside registered accounts, the tax advantage disappears
Within a TFSA, RRSP, or RRIF, every distribution type is sheltered equally. Capital gains, eligible dividends, and Return of Capital are all treated identically, because none of it is taxed while it stays inside the account.
That collapses the comparison to a single question: total return and net asset value durability. Nothing else survives the shelter.
The consequence is direct. Inside a registered account, the leveraged covered call ETF’s structural trade-offs, the capped upside and the amplified downside, stand fully exposed with no tax offset to soften them. The tax argument that makes these funds compelling for a high earner in a taxable account simply does not exist here.
So the same ETF can be advantaged or disadvantaged against an index fund purely on the basis of where you hold it and what your marginal rate is. Judging these funds on yield alone, without asking about account type, is how the tax picture gets misread.
Which approach fits which investor, and how to decide
Pull the threads together and the answer is not “it depends.” It is a set of specific investor profiles, each with a defensible strategy.
| Strategy | Ideal investor | Primary strength | Primary risk | Best account type |
|---|---|---|---|---|
| Index fund | Long-horizon accumulator | Maximum total return, simplicity | Forced asset sales for cash flow | Registered or taxable |
| Covered call ETF | Decumulator wanting automated cash | High monthly income, no sale timing | Capped upside, capital decay in bear markets | Taxable (high earners), leveraged variants |
| Dividend portfolio | Traditional income seeker | Familiar, eligible dividend credit | Excludes high-growth non-payers | Taxable (lower earners) |
The dividend portfolio has largely been superseded. For income seekers in the current Canadian market, covered call ETFs deliver the cash flow with fewer structural compromises, leaving the traditional dividend approach with limited advantages.
Three variables determine your placement more than any other:
- Horizon: the leveraged variant’s near-parity in 2023 to 2026 versus its punishing 2022 divergence defines the risk spectrum you sit on
- Account type: registered strips the tax argument out entirely, leaving total return as the only metric
- Cash flow versus wealth maximisation: which constraint actually binds your situation
The cash-flow point is worth grounding. A retiree drawing $60,000 to $80,000 a year from a $600,000 portfolio would need to sell roughly 10% to 13% of holdings annually from an index fund with a comparatively modest dividend yield. A covered call ETF yielding 12.82% covers most of that from distributions alone, which is precisely the behavioural problem it solves.
The one scenario where the covered call argument is most complete: a high-income Canadian in decumulation, holding leveraged covered call ETFs in a taxable account, at a withdrawal rate that does not exceed the sustainable total return of the underlying portfolio. Where all four conditions hold, the case is genuinely strong.
For investors who have identified covered call ETFs as the right structure for their situation, our dedicated guide to covered call ETF selection walks through the specific metrics, including organic income ratio, payout growth track record, and out-of-the-money call strategies, that separate funds suited to income spenders from those built for reinvestors.
This article is for informational purposes only and should not be considered financial advice. Investors should conduct their own research and consult with financial professionals before making investment decisions. Past performance does not guarantee future results, and financial projections are subject to market conditions and various risk factors.
The verdict is conditional, and knowing your condition is the whole job
The core finding holds up. Leveraged covered call ETFs have shown they can approach index fund total returns over recent bull-market periods while generating cash flow that index funds structurally cannot match. That combination comes attached to specific conditions, and when a sustained bear market breaks those conditions, the trade-off fails hard, as 2022 demonstrated.
The Canadian tax treatment in taxable accounts is a real differentiator for high-income investors, not a marketing line. But it only matters where account type and income level line up with the conditions that make it relevant. Inside a TFSA or RRSP, it vanishes.
Which returns the decision to you. The investor who understands their horizon, their account type, and their cash-flow constraint clearly enough to name the profile they match has done the analytical work that most investors skip entirely. That work, not the headline yield, is what separates a fitting strategy from an expensive mismatch.