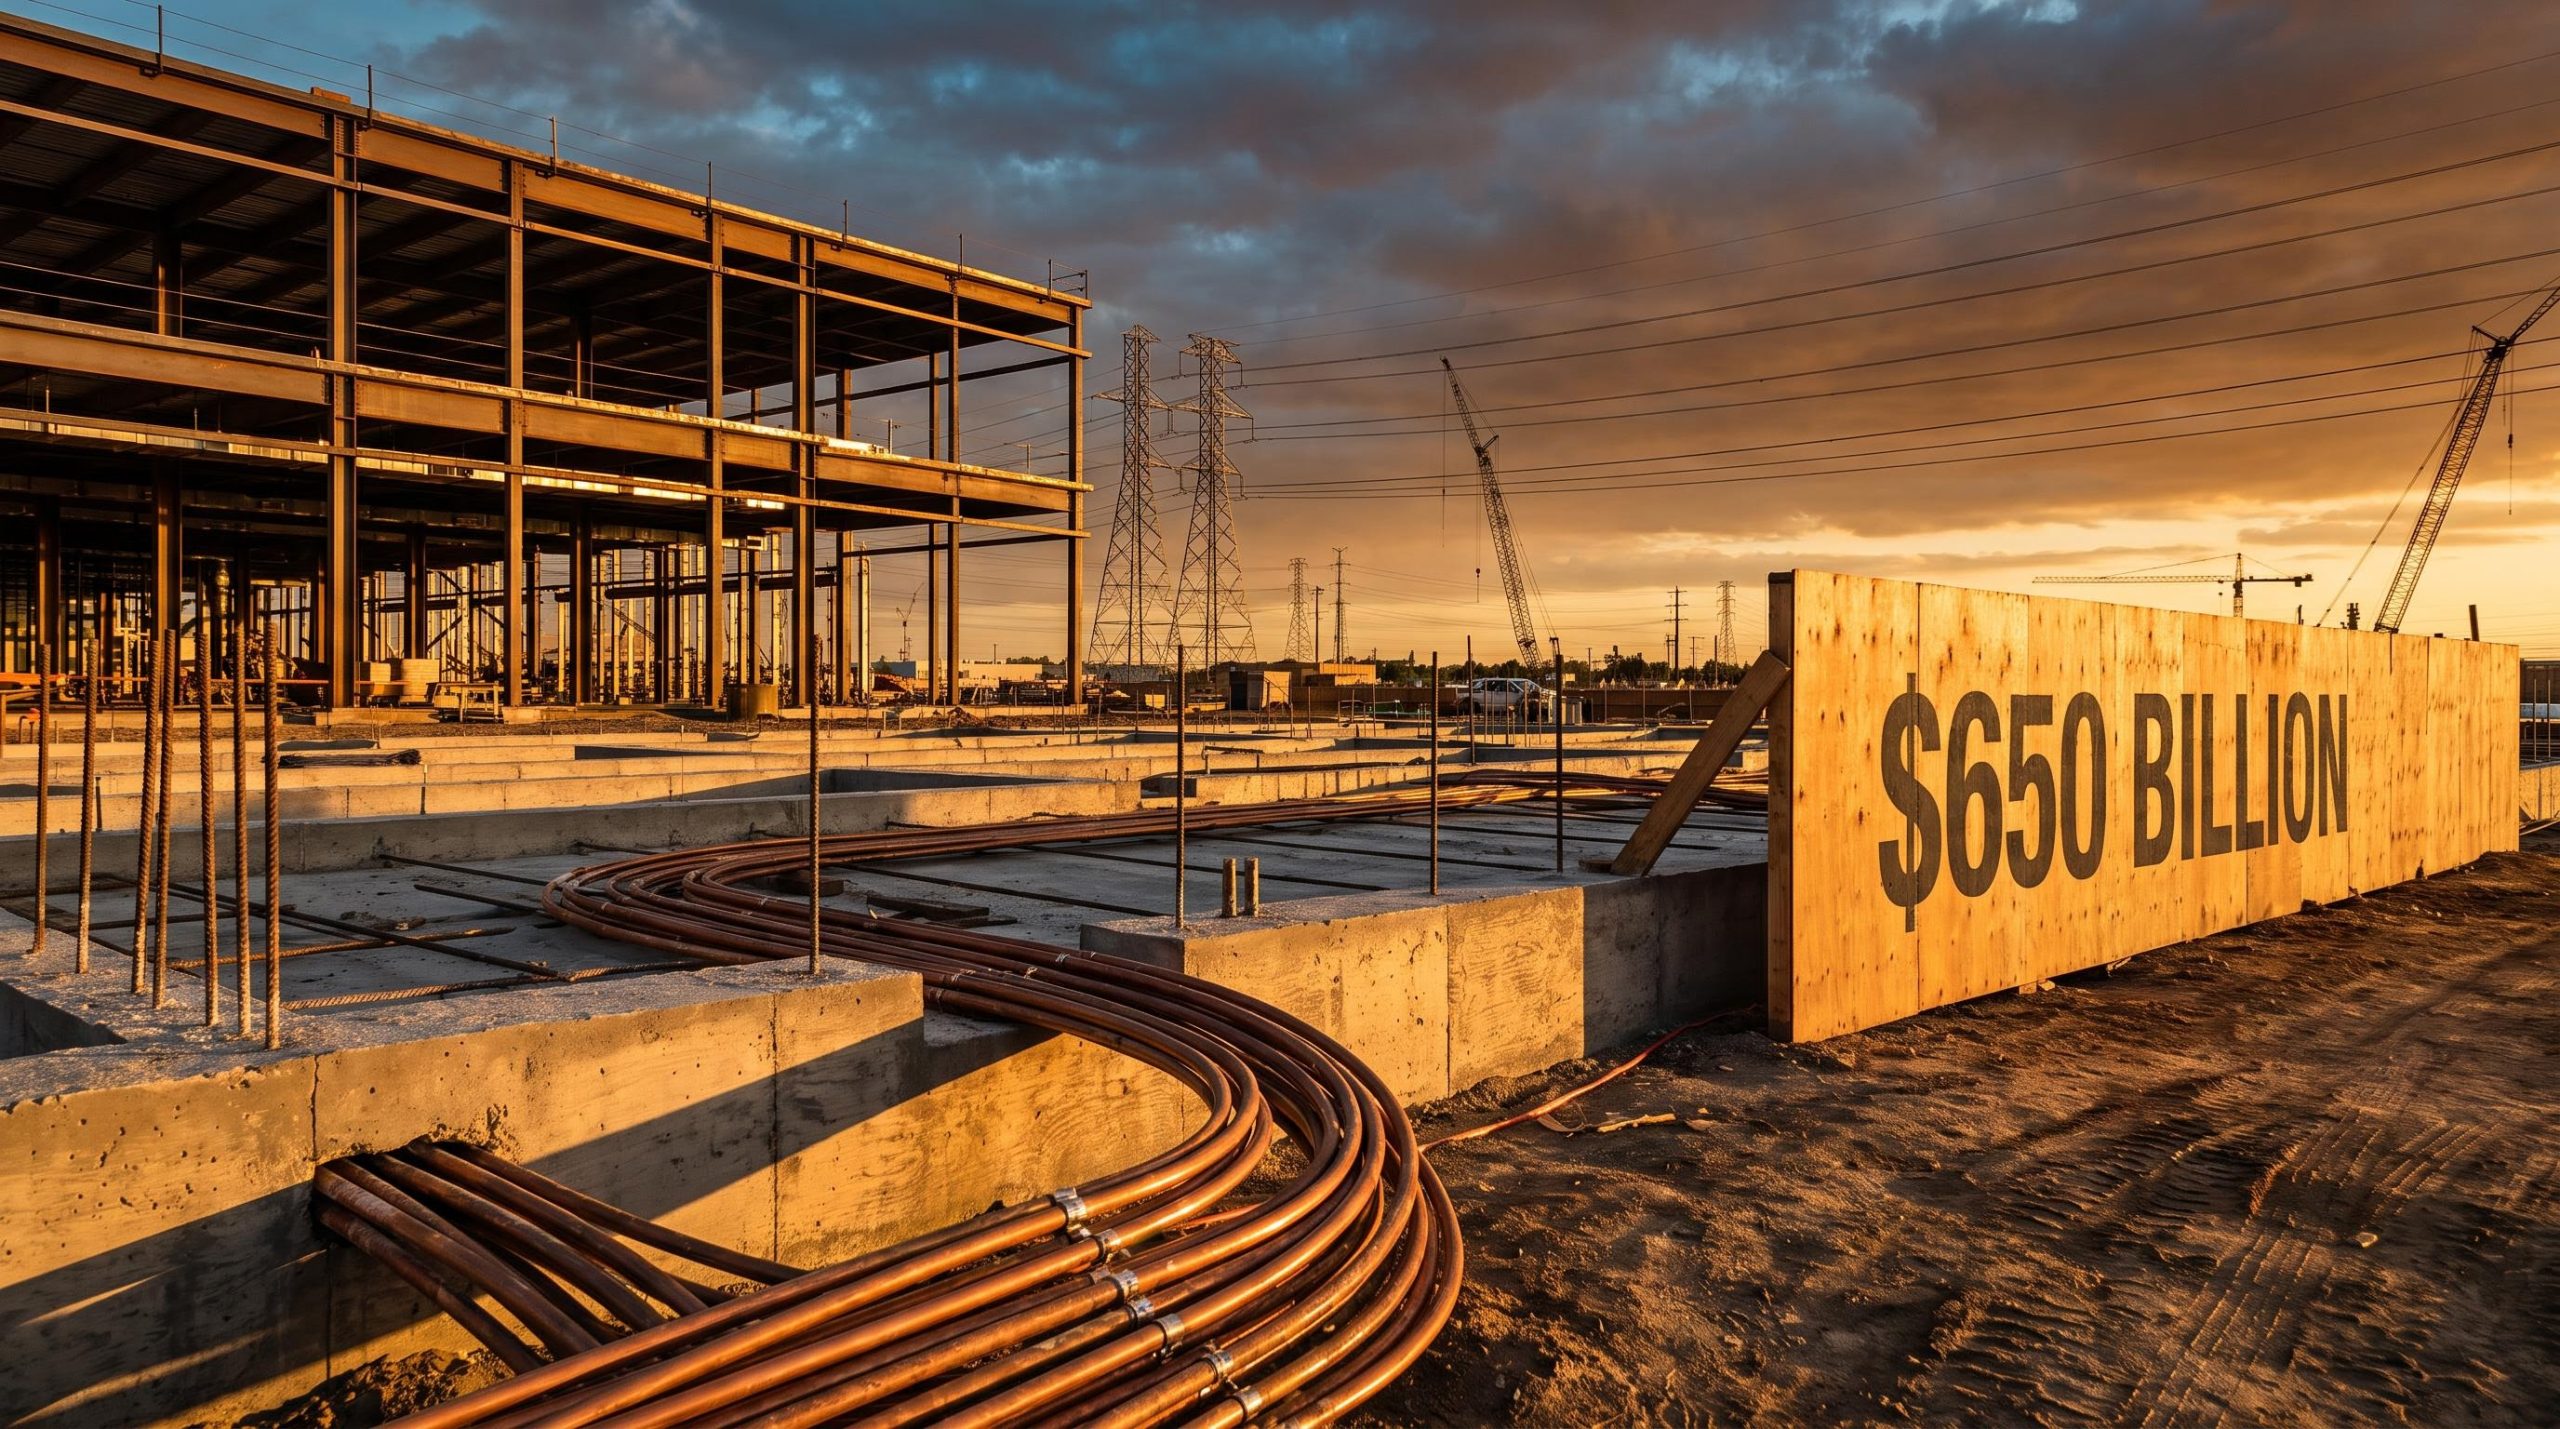
The algorithms driving the artificial intelligence boom are weightless. The infrastructure required to run them is anything but. Behind every model sits concrete poured by the acre, copper drawn by the tonne, and power stations straining to feed a grid that was never designed for this kind of load.
As of September 2026, the conversation has shifted. It is no longer just about mega-cap technology valuations and whether a handful of stocks have run too far. It has broadened into something wider: an ecosystem-level economic expansion touching manufacturing, utilities, real estate, and finance. Nasdaq Chief Economist Phil Mackintosh recently underscored this point in a discussion with nabtrade, highlighting how the infrastructure being built to support advanced computing is sending ripple effects deep into the broader American economy.
Here is what the data actually tells you about where capital is flowing across US sectors, and why the AI economy’s impact extends far past individual technology stock picks. The framework below moves from macroeconomic theory to physical steel, then to the messy reality of adoption, and finally to how you might reposition.
Understanding the macroeconomic transmission mechanism
The theory is elegant enough. When companies pour capital into technology, software, IT equipment, and data centres, that spending shows up directly in gross domestic product (GDP), the total value of goods and services an economy produces. Over time, if those tools make workers more efficient, they lift labour productivity, which raises growth without necessarily raising inflation. That is the mechanism economists describe when they say technology “drives” growth.
Now anchor that theory in the numbers, and it becomes tangible fast.
The Federal Reserve Bank of St. Louis has estimated that technology-related categories contributed 0.97 percentage points of real GDP growth across the first three quarters of 2025, roughly 39% of total real growth over that stretch. Analysis from CBRE using Bureau of Economic Analysis data went further, suggesting technology investment was equivalent to roughly half of all US GDP growth in full-year 2025, up from around 8% in 2023-2024.
Separating technology investment from the broader economy has become nearly impossible in the 2025-2026 datasets. That is the picture at the top of the funnel. The trouble starts when you look for the productivity payoff.
The Stanford AI Index 2026 recorded US labour productivity growth at 2.7% in 2025, well above the 1.4% average of the prior decade. Yet one macro model in the same report attributed only about +0.01 percentage points of total factor productivity (a measure of output not explained by labour and capital inputs alone) specifically to algorithmic efficiency. That is essentially nothing. Goldman Sachs economist Jan Hatzius struck a similar note in early 2026, arguing the measurable GDP contribution from productivity gains remains close to zero.
The productivity paradox sits at the centre of every macro debate about AI: task-level efficiency gains of 40-55% are well documented, yet economy-wide productivity growth remains close to 0.1% annually, a divergence that Bank of America, the OECD, and the BIS all identify as the defining unresolved question for capital allocation over the next decade.
| Source | Estimated impact | Publication year |
|---|---|---|
| Federal Reserve Bank of St. Louis | 0.97 percentage points of real GDP growth (approx. 39% of total) | 2026 |
| CBRE (BEA data) | Roughly half of full-year US GDP growth | 2026 |
| Stanford AI Index | +0.01 percentage points of TFP directly attributable | 2026 |
These conflicting models tell you something practical. The capital expenditure is undeniable and measurable. The productivity payoff is not yet. For now, that means you should look at physical investment, the concrete and the contracts, rather than assumed efficiency gains, for your immediate signals.
When big ASX news breaks, our subscribers know first
The physical reality of artificial intelligence infrastructure
Follow the money, and it does not lead to a server rack. It leads to a construction site.
At least $178.5 billion in data-centre credit deals were struck in the US alone during 2025, according to a Bloomberg analysis. That is financing for buildings, land, cooling systems, and transmission lines, not lines of code. The scale of the physical commitment is what reframes this entire cycle.
The current US IT investment wave has already surpassed all prior technology investment peaks, including the dot-com era and the cloud buildout cycle, with hyperscaler CapEx commitments for 2026 sitting in a range that dwarfs anything the national accounts have previously absorbed from a single investment theme.
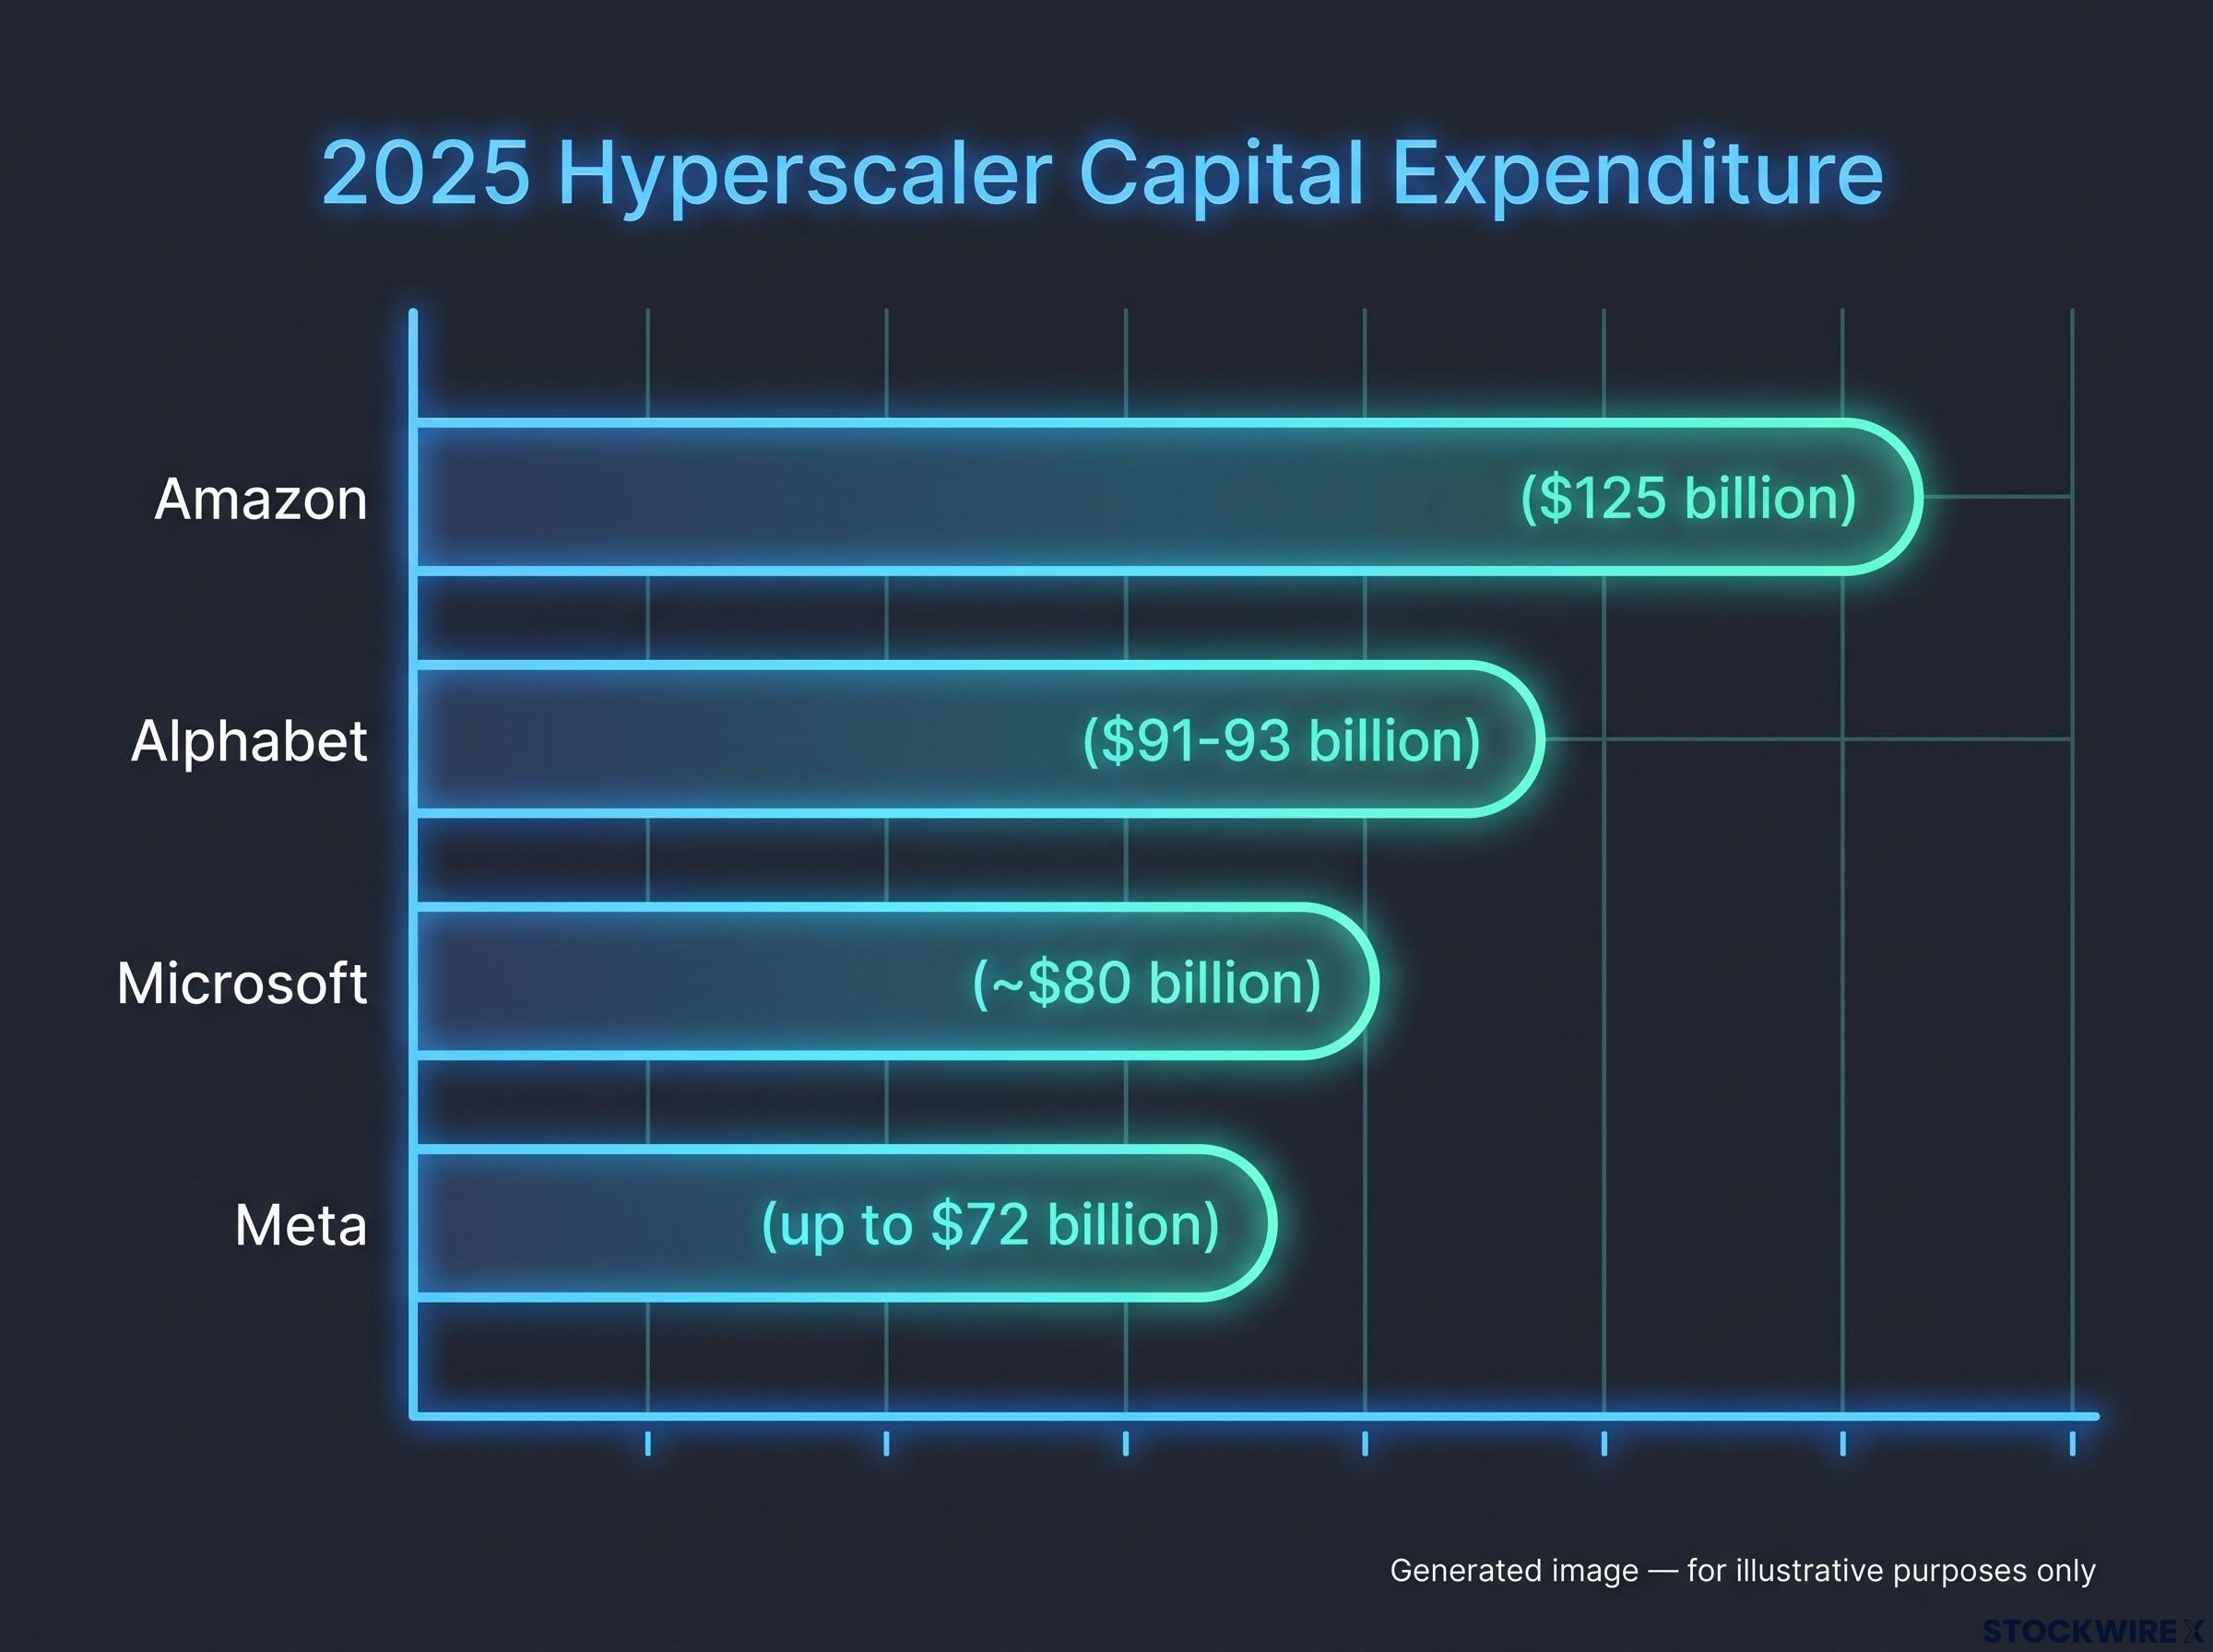
The largest operators have made their intentions explicit. According to recent reporting, the four biggest hyperscalers are committed to spending over $650 billion in 2026 alone on build-outs.
- Alphabet guided toward roughly $91-93 billion in capital expenditure for 2025.
- Amazon projected around $125 billion for the same period.
- Meta targeted up to $72 billion.
- Microsoft earmarked roughly $80 billion for AI data-centre spending in the fiscal year ending June 2025, over half of it inside the US.
Institutional capital is chasing the same theme. BlackRock’s Global Infrastructure Partners and MGX agreed to acquire Aligned Data Centers for $40 billion in October 2025, a deal that treats data centres as core real assets rather than technology bets.
What this tells you is straightforward. The next phase of technology growth is being built by heavy industry, and that changes which assets deserve your attention.
Grid strain and power demand
The single biggest constraint on all of this is electricity. BloombergNEF forecasts US data-centre power demand will reach 106 gigawatts by 2035, a 36% increase on prior outlooks.
That demand is rewriting the outlook for utility providers. For years, US utilities were treated as stagnant dividend payers, safe but slow, bought for income rather than growth. The data-centre build-out is dragging them toward the growth-adjacent end of the spectrum, because someone has to generate, transmit, and manage the power these facilities consume.
The EIA Annual Energy Outlook 2026 projects data-centre load as the dominant driver of long-term US electricity growth through 2050, a forecast that repositions utility-sector capacity planning from a defensive income exercise into a structural growth imperative.
For you, the read is that the unprecedented strain on the grid turns utilities and energy infrastructure into direct participants in the AI cycle, not bystanders to it. The “picks and shovels” of this boom are increasingly measured in megawatts.
Navigating transition frictions in physical industries
Here is where naive optimism gets expensive. Adoption is not a switch you flip. In physical industries, plugging in new technology often makes things worse before it makes them better.
The contrast in the data is stark. Federal Reserve figures show work-related generative AI adoption is highest in financial services at 63% and professional services at 62%, both digital-first sectors where a tool can be deployed at a desk and start working almost immediately. Manufacturing is racing to catch up, posting the fastest year-on-year growth in adoption, but the results there tell a very different story.
A Wharton study on industrial AI found that higher deployment inside manufacturing plants was associated with an actual decline in output.
An estimated 70-80% of enterprise AI pilots fail or stall before delivering measurable returns, with poor data integration identified as the primary failure mode rather than model quality or talent shortfalls, a finding that gives the manufacturing productivity decline documented by Wharton a structural rather than anecdotal explanation.
The transition-friction warning Wharton’s research linked heavier AI deployment in manufacturing plants to a 1.33 percentage-point drop in productivity and a roughly 60% decline in total factor productivity, evidence that integration is costly and disruptive before it pays off.
That is transition friction in a single statistic. It reflects the reality that retooling factory floors, retraining workers, and rewiring processes drags on productivity during the changeover. The warning for you is direct: do not expect immediate margin expansion from a company simply because it announced a pilot programme. Announcements are cheap. Integration is where the cost, and the eventual reward, actually lands.
When integration does succeed, the outcomes can be dramatic, which is what makes the picture uneven rather than uniformly bad.
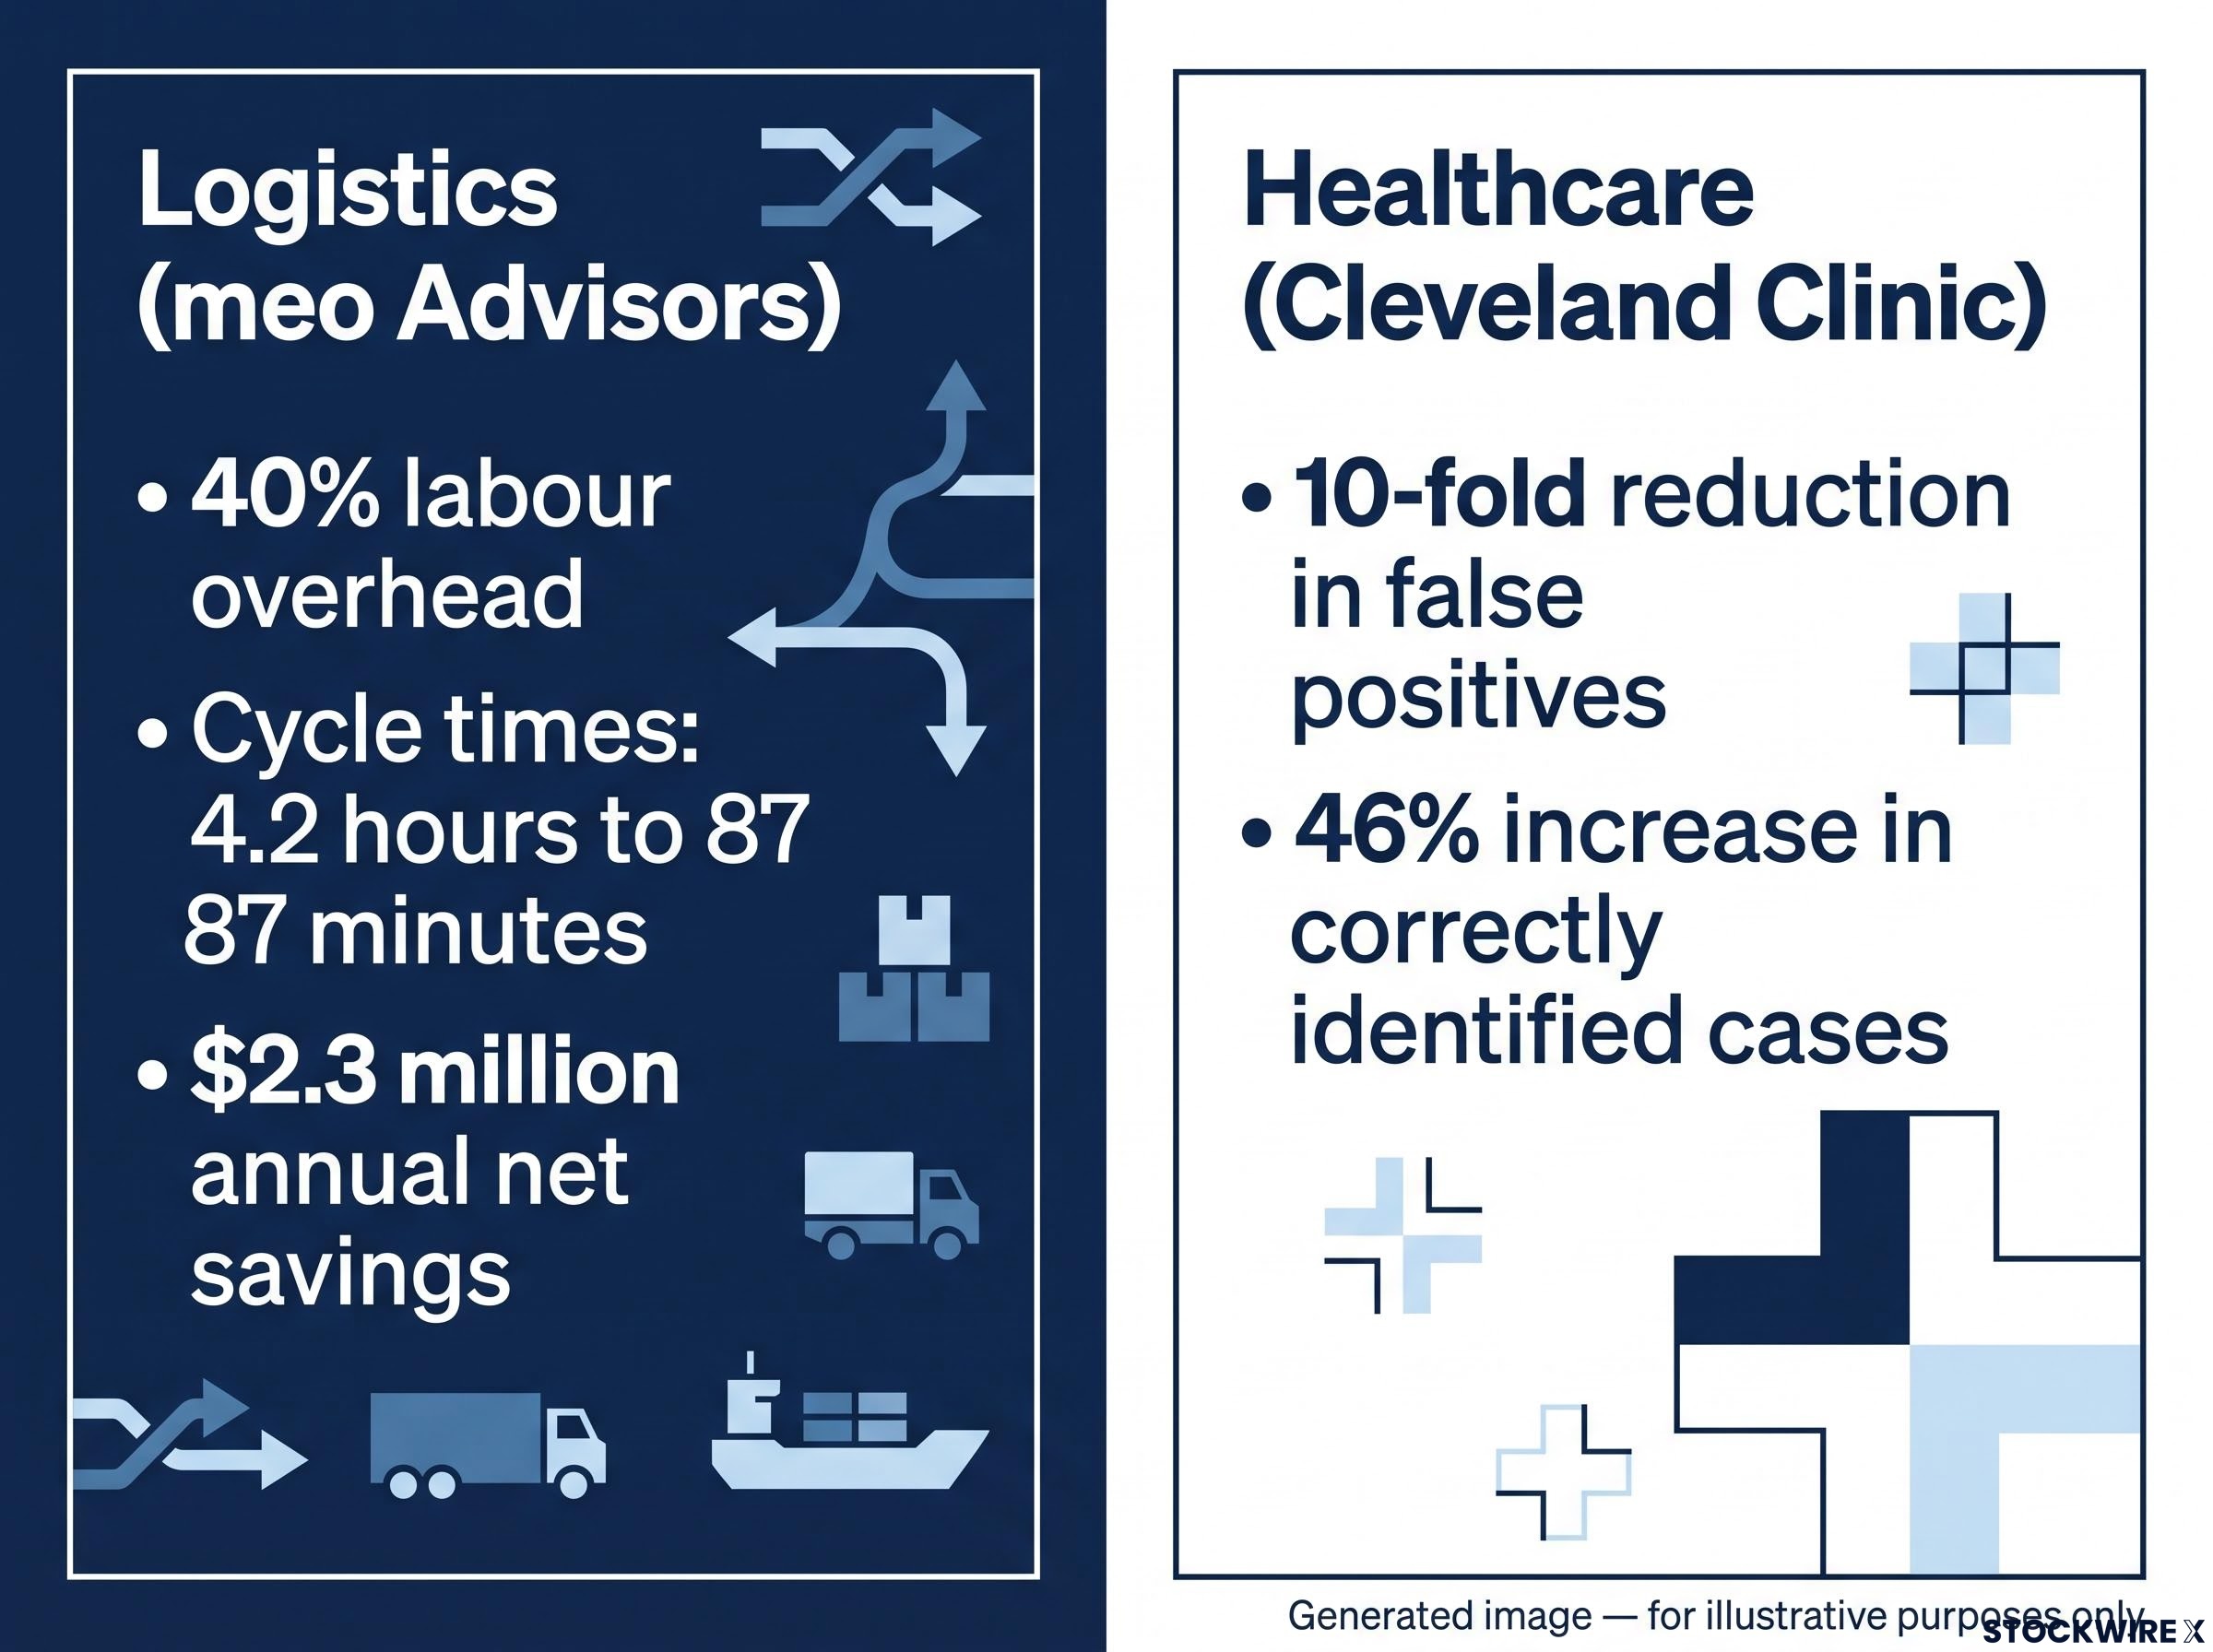
Consider logistics. A case study documented by meo Advisors described AI agents handling shipment coordination that reduced labour overhead by 40%, cut coordination cycle times from 4.2 hours to 87 minutes, and delivered $2.3 million in annual net savings. The operator broke even in six weeks.
Healthcare shows the same split between friction and payoff. The Cleveland Clinic reported that its predictive AI sepsis-detection platform delivered a 10-fold reduction in false positives and a 46% increase in correctly identified cases, with alerts arriving before antibiotics were administered in seven times as many cases.
The lesson across these examples is consistent. The winners are not the companies with exposure to AI. They are the companies with proven integration. That distinction is what should guide where you place conviction, because the gap between a pilot and a payoff is where a lot of capital gets destroyed.
Repositioning portfolios for the second wave of adoption
All of the preceding analysis points toward one strategic question. Are you positioned for the builders, or for the businesses that use what the builders made?
Strategists increasingly split the AI economy into two tiers. First-order beneficiaries are the foundational builders: semiconductor makers, chip manufacturers, power generators, and the infrastructure providers laying the physical groundwork. Second-order beneficiaries are the companies further down the chain, in retail, healthcare, and finance, that deploy these tools to expand margins and generate recurring revenue.
The first tier has attracted crowded, consensus capital. A Nuveen survey found 39% of institutional investors allocating to AI now rate energy production and infrastructure as their single biggest opportunity, which is precisely the kind of crowding that compresses future returns. Natixis Investment Managers frames the same divide, separating first-order segments like semiconductors and power from second-order segments like broadline retail and farming.
The rationale for rotating toward the second tier is that margin expansion in traditional sectors is less crowded and, in places, already visible. Retail adoption has reached as high as 89% in specific marketing and supply-chain functions, the kind of quiet operational gain that rarely makes headlines but shows up in earnings.
The distinction gives you a clear test. Ask whether your current holdings sit inside the crowded consensus infrastructure trade or capture overlooked margin expansion. Here is a practical way to screen for the latter.
- Identify traditional-sector companies (healthcare, retail, finance) already reporting quantified operational gains, not just pilots.
- Confirm the gains are recurring, showing up in margins or cost lines across multiple quarters.
- Check that the valuation has not already priced in perfection, unlike much of the first-order infrastructure cohort.
- Favour firms converting AI use into repeatable revenue over those merely disclosing exposure.
Variables to watch as the deployment cycle matures
Strip away the labels and what the US economy is undergoing is a multi-sector structural shift wearing the costume of a technology rally. The capital is real, the physical build-out is real, and the ecosystem effects reach far beyond a handful of tickers.
The risks are equally real. The International Monetary Fund has warned that AI could affect around 40% of jobs globally, raising the prospect of labour-market disruption and widening inequality without policy intervention. There is also the spectre of overinvestment. If the roughly $400 billion in projected annual infrastructure spending fails to convert into proportionate corporate profits, an investment bust could drag hard on GDP, given data-centre spending is now rivalling consumer spending as a growth engine.
Labour-market disruption from AI carries a measurably worse financial penalty than prior waves of technology displacement: Goldman Sachs research tracking more than 20,000 workers found that AI-driven job loss produces a 3% larger earnings decline at re-employment and an earnings growth gap that does not close for a full decade, a dynamic the IMF’s 40% job-exposure figure does not capture on its own.
Over the next 12 months, audit your own portfolio on two fronts: your exposure to the infrastructure build-out, and your vulnerability to the transition friction that keeps physical-industry returns slow to arrive.
This article is for informational purposes only and should not be considered financial advice. Investors should conduct their own research and consult with financial professionals before making investment decisions. Past performance does not guarantee future results, and financial projections are subject to market conditions and various risk factors.