The market had all but written the Federal Reserve’s obituary as a rate-hiking force. Then Kevin Warsh spoke, and the assumption unravelled in a matter of hours.
The Fed Chair’s keynote at the Kansas City Fed’s Jackson Hole symposium on 28 August 2026 landed as a direct challenge to the prevailing consensus. His message was blunt: the inflation fight is not finished, and the central bank stands ready to keep tightening if underlying price pressures refuse to fall decisively.
Bond markets reacted instantly. The 10-year Treasury yield climbed to its highest level since January 2025, and that single move rippled outward, pressuring semiconductor stocks, gold holdings, and cryptocurrency positions at the same time.
That simultaneous reaction is the story here. This piece gives you a unified framework for understanding why the Fed rate hike impact on stocks, gold, and crypto is not three separate stories, but one, and what it means for how you position across all of them heading into the September FOMC meeting.
Quantifying the shift in Federal Reserve expectations
A single speech rewrote the rate narrative in an afternoon. Warsh did not announce a hike. He did something arguably more disruptive: he refused to rule one out.
His 28 August 2026 address struck a hawkish tone while declining to pre-commit to any September action. That ambiguity forced markets to price in risk they had largely dismissed.
Warsh’s Jackson Hole remarks, published in full on the Federal Reserve Board’s website, make clear that the central bank’s tolerance for premature easing has narrowed considerably given the persistence of underlying price pressures.
The Fed must be “confident that underlying inflation is moving to our objective, clearly and at sufficient speed,” Warsh said, adding that otherwise “we have work to do.”
The bond market did the repricing in real time. The 2-year Treasury yield, the maturity most sensitive to near-term policy expectations, jumped from 4.23% to 4.28% on the day, its steepest one-day advance since June 2026.
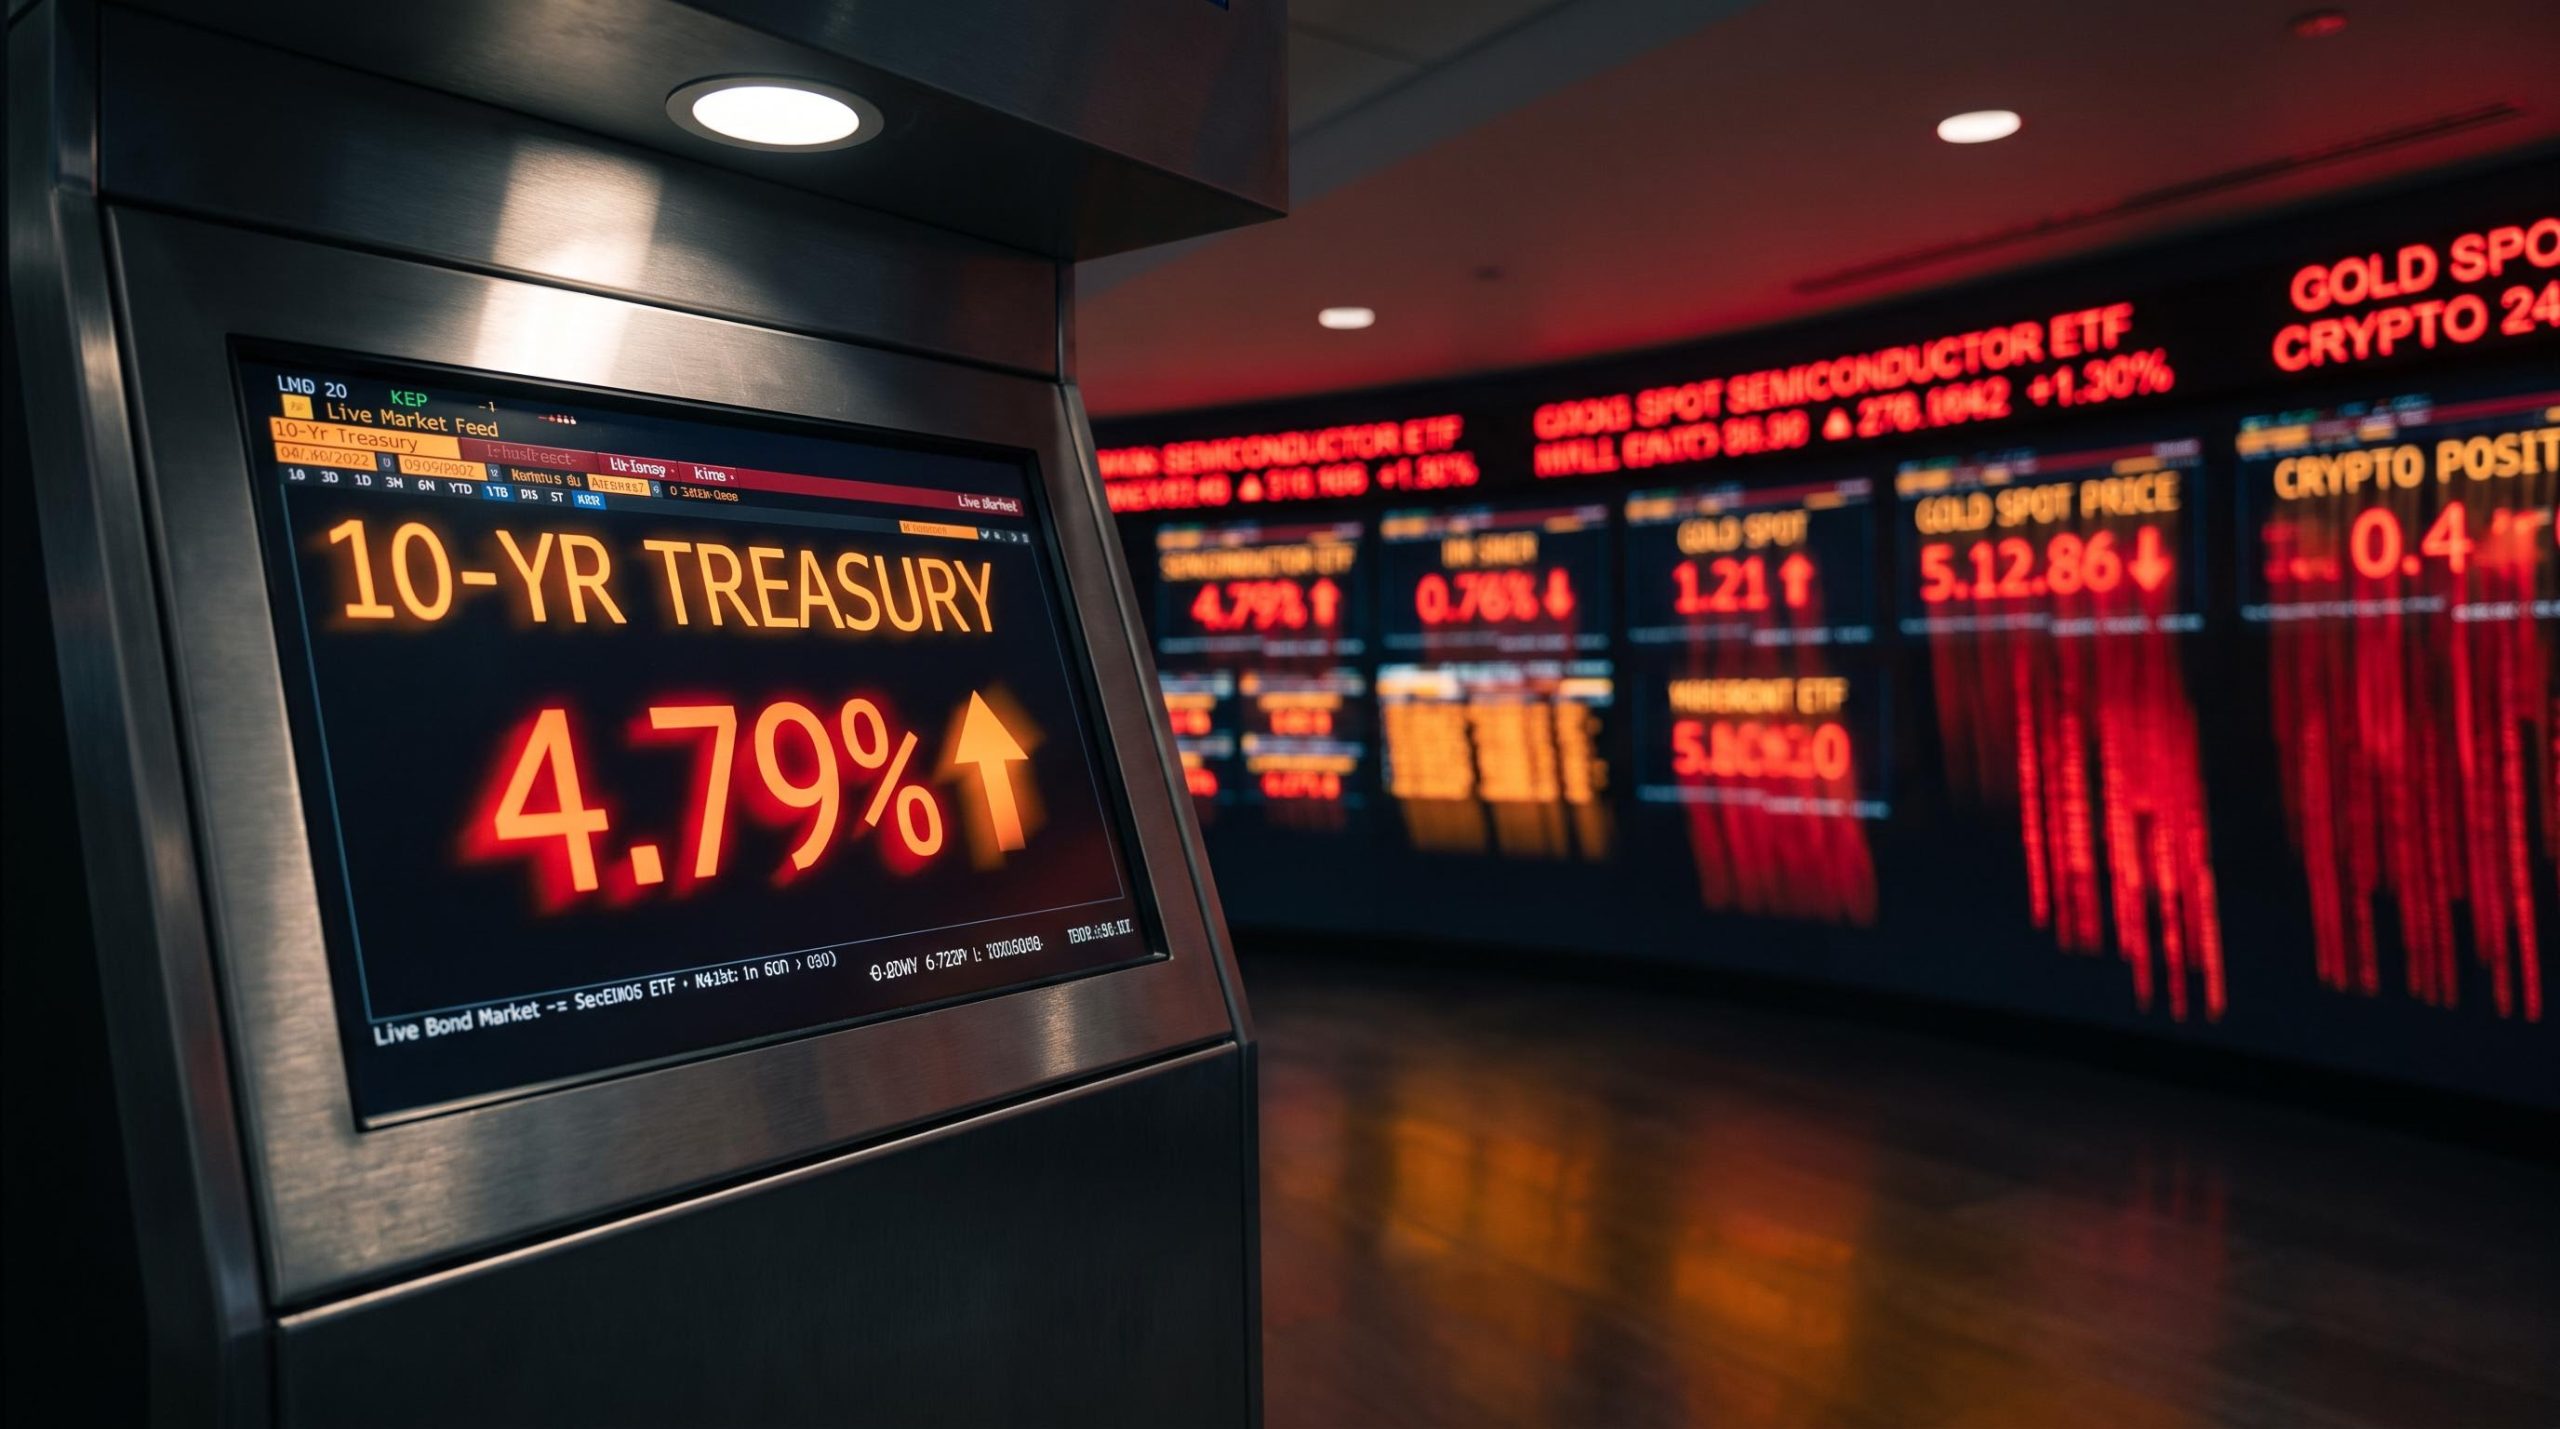
The longer end followed. The 10-year yield pushed through the 4.68% reading recorded on the day of the speech to hit 4.79% by 1 September 2026, according to YCharts data. That is the highest level since January 2025, with the next resistance identified at 4.809% and 5% looming as a longer-term target.
What moved fastest, though, was probability. Market-implied odds of a hike at the 15-16 September meeting swung violently as traders scrambled to catch up with the new tone.
| Date | September hike probability | Source |
|---|---|---|
| 21 August 2026 | 39.9% | CME FedWatch |
| 28 August 2026 (post-speech) | 57% | CME FedWatch |
| Early September 2026 | ~66% | WSJ, TipRanks |
Not every venue agreed. Polymarket showed a nearly split consensus, with roughly 52% assigning no change and 48% pricing a hike, a reminder that genuine uncertainty survived the speech.
The FOMC tightening bias visible in the April minutes, when the committee framed its hold as a data-collection pause rather than a pivot, established the precedent that Warsh’s Jackson Hole remarks extended rather than created, with PCE at 3.5% and the bar for easing requiring both sustained disinflation and meaningful labour market deterioration.
The read you should take from this is straightforward. The assumption of guaranteed rate cuts, the one propping up your riskier positions, has met unexpected resistance. This is not market noise. It is a fundamental repricing of the cost of capital, and it will shape market direction through the end of 2026.
When big ASX news breaks, our subscribers know first
How Treasury yields dictate cross-asset gravity
Before working through the damage, it helps to understand the force behind it. Rising Treasury yields do not just affect bonds. They exert a gravitational pull on everything else you own.
The mechanism starts with the risk-free rate. This refers to the return an investor can earn with virtually no risk, typically measured by US government bonds. When that rate rises, every other investment has to compete harder to justify its risk.
Think of it this way. If a completely safe Treasury bond pays you more, then a volatile stock or a non-yielding asset has to promise a much larger payoff just to remain worth holding. As the risk-free rate climbs, the required reward for taking risk climbs with it.
That gravity travels through three standard channels in macro-finance:
- Discount rates for growth assets. Higher yields raise the rate used to value future earnings. Companies whose profits sit years in the future, such as high-growth chipmakers, get marked down hardest because those distant earnings are worth less today.
- Opportunity cost for gold. Gold pays no income. When safe bonds yield more, the cost of parking money in a non-yielding metal rises, and gold tends to weaken.
- Liquidity contraction for crypto. Tighter policy expectations drain the speculative risk-taking that fuels digital assets, pressuring them alongside high-beta equities.
History shows this playing out in coordinated fashion. During the 2013 Taper Tantrum, the mere signal that the Fed would slow its bond purchases sent yields soaring, dragged down long-duration and emerging-market assets, and weakened gold as real yields rose. The 2022 Jackson Hole selloff repeated the pattern, with Chair Powell’s “higher for longer” message hammering high-multiple tech, gold, and crypto simultaneously.
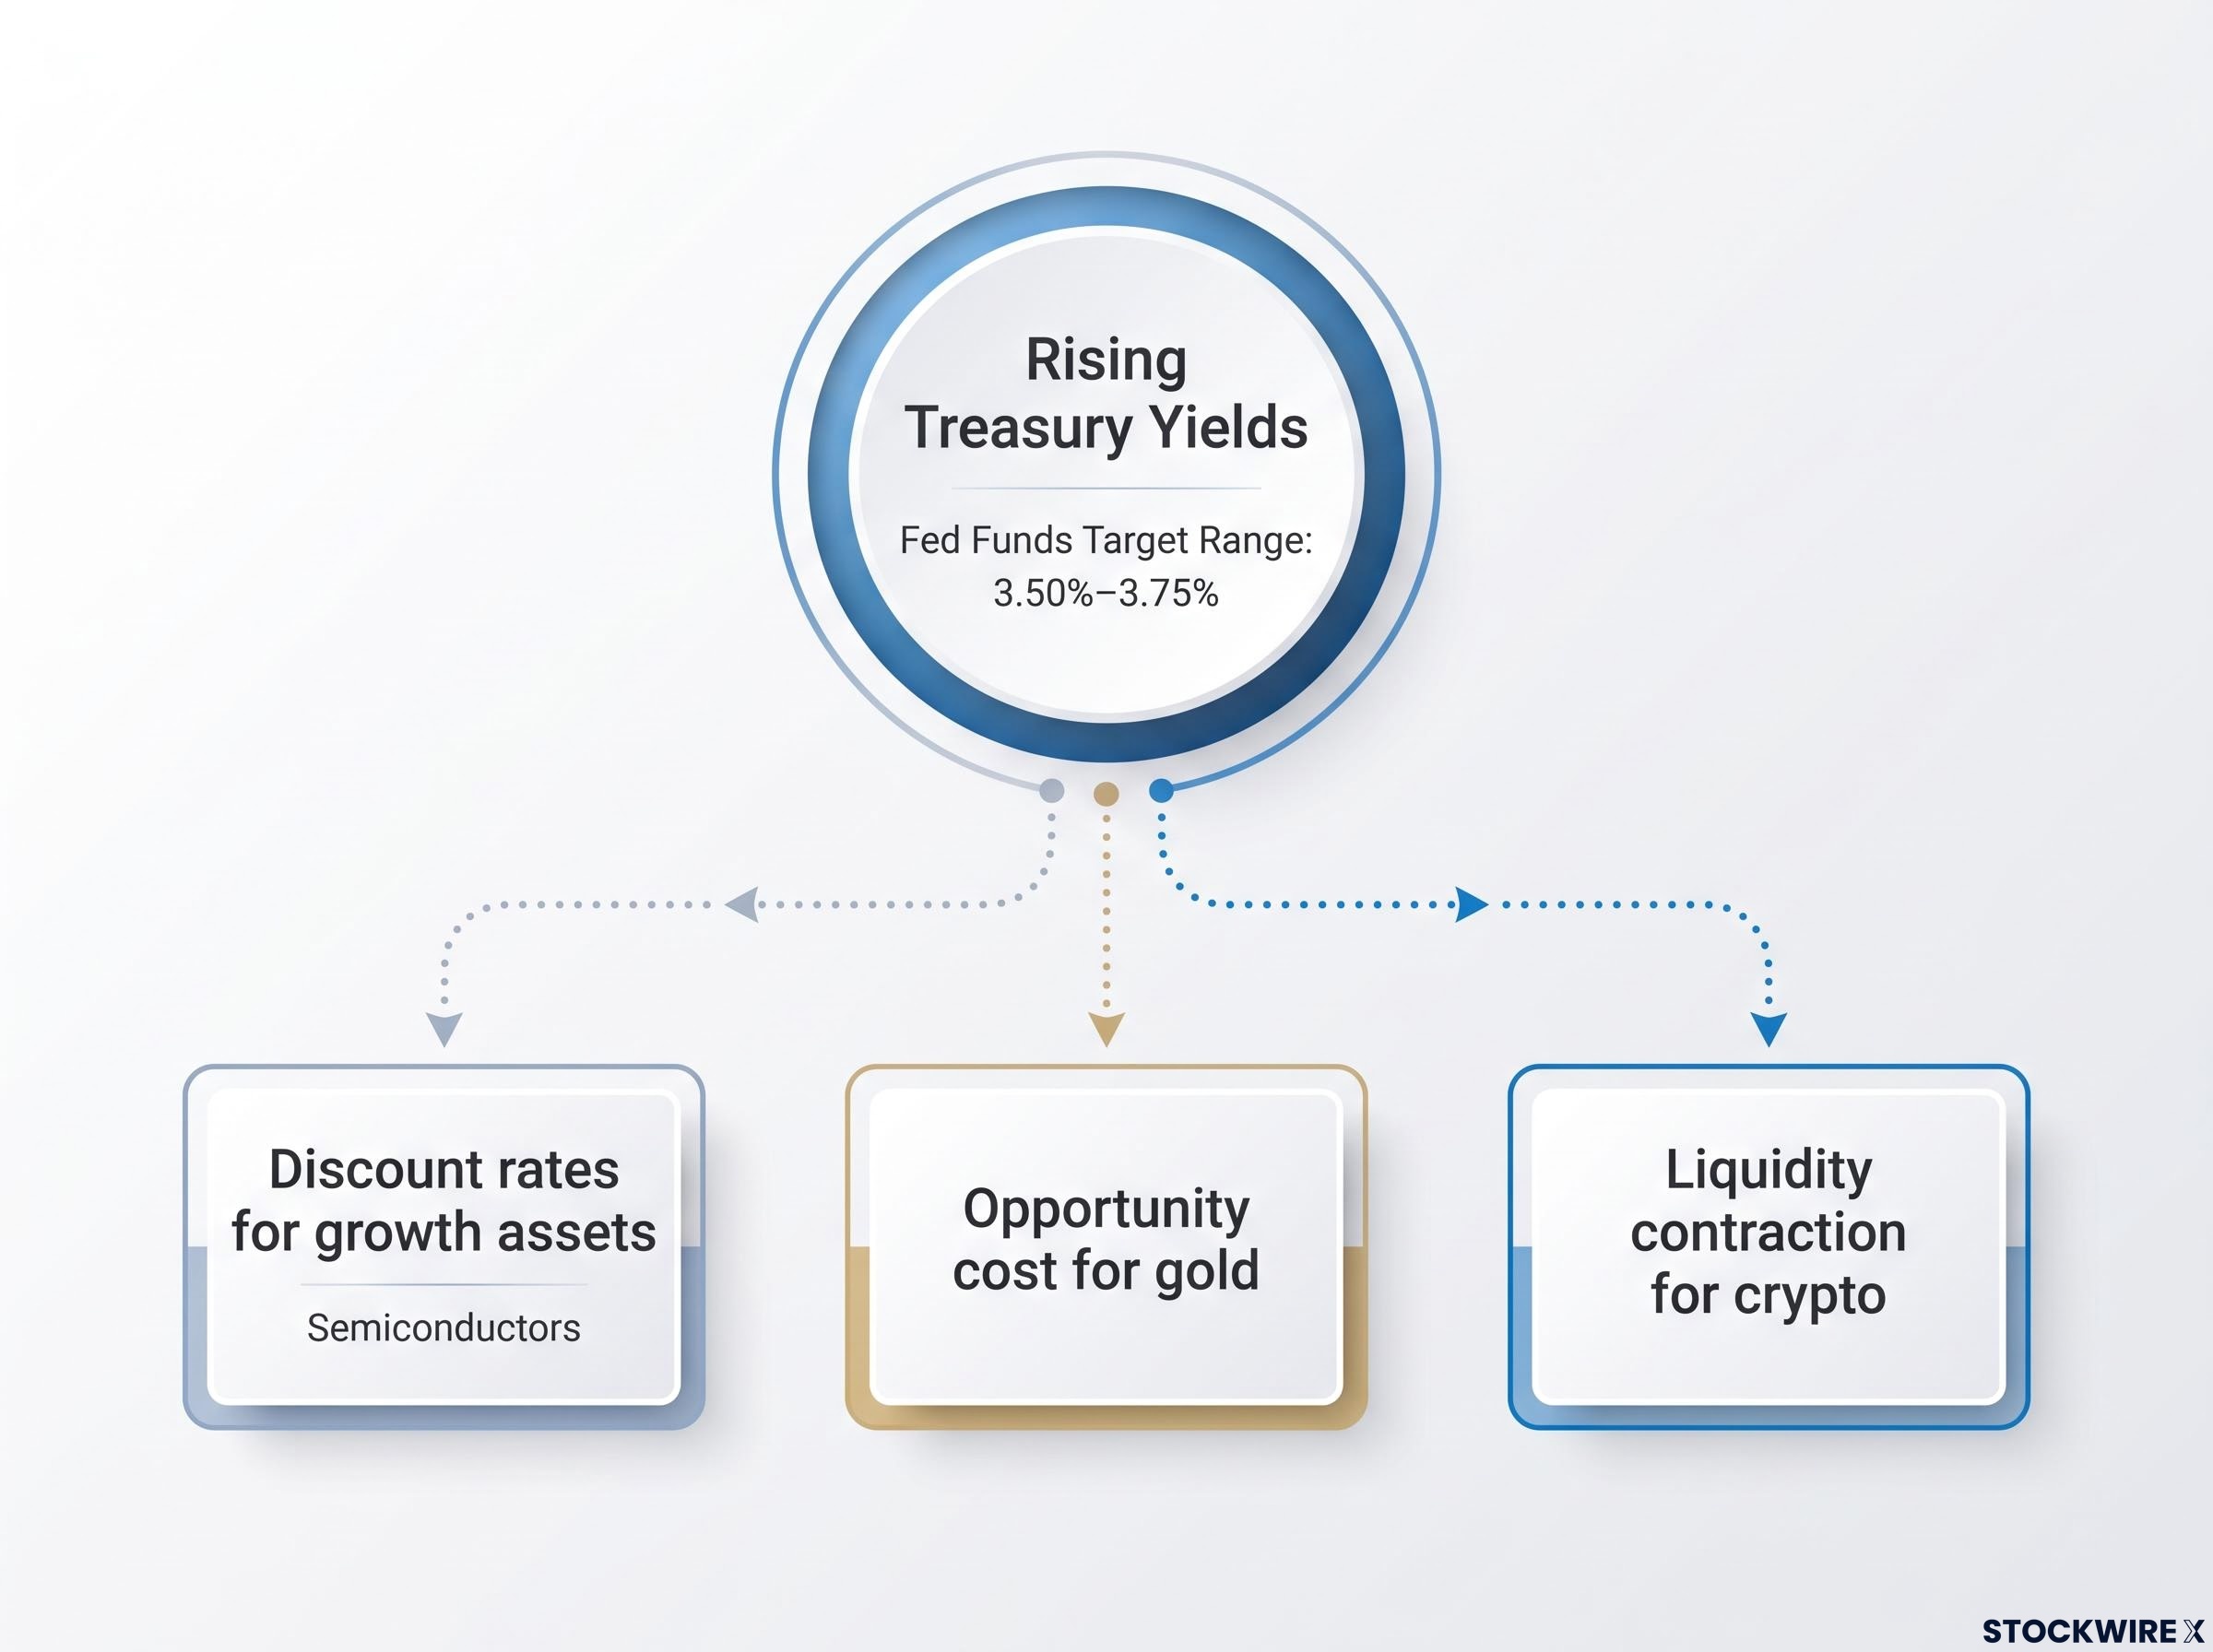
The current federal funds target range sits at 3.50%-3.75%, and the debate is whether it goes higher still. What matters for you is the principle underneath these episodes.
When risk-free rates rise, holding a volatile or non-yielding asset demands a dramatically higher payoff just to break even. That forces a reassessment of every speculative position you own.
This is the foundational point that lets you stop viewing your holdings in isolation. Once you grasp rate sensitivity, an inflation print becomes something you can trace directly to your semiconductor exposure, your gold, and your crypto, all at once.
Semiconductors face the cost of future growth
Nowhere is rate gravity more visible than in semiconductors. The sector carries one of the market’s strongest fundamental narratives, and it still could not withstand the repricing.
The VanEck Semiconductor ETF (SMH) functions as a leading indicator for broader market appetite, which is why its recent behaviour matters beyond chip investors. In the session before the shock, SMH closed above both a declining trend line and a longer-term ascending parallel channel tracing back to the April 2025 lows. That looked like a breakout.
The next session erased it entirely. A failed breakout of that kind typically signals more downside ahead, pointing toward the near-term support level at $531.23.
The lesson is uncomfortable. A sector with genuine demand tailwinds still buckled the moment discount rates rose, because valuation math overrode narrative.
The AI capex burden
The reason cuts to the heart of the AI build-out. Semiconductor companies have committed enormous sums to data centre infrastructure, and that spending assumes access to relatively cheap capital.
Rising rates punish these commitments disproportionately. When financing costs climb, the return threshold on multi-year capital expenditure rises with it, and the market discounts those future payoffs more aggressively.
Hyperscaler capex commitments of approximately $770 billion for 2026, running near 100% of operating cash flow for the largest buyers, amplify the rate sensitivity the article describes: when financing costs rise and depreciation climbs from 7% to roughly 12% of revenue by 2027, the discount applied to semiconductor earnings multiples compounds the pressure already visible in SMH’s failed breakout.
Growth equities are structurally vulnerable here precisely because so much of their value depends on earnings far out in time. The higher the yield, the heavier the discount applied to that distant income.
Connect the dots and the implication is clear. Holding technology stocks right now is not simply a bet on continued AI innovation. It is also a bet against rising borrowing costs, and those two bets are pulling in opposite directions.
That reframing helps you gauge the road ahead. If SMH is the canary for risk appetite, watch it closely as the 10-year yield approaches the 5% threshold, because a further breakdown there would signal the broader technology sector is exposed to deeper drawdowns.
The safe haven divergence between gold and Bitcoin
The final piece breaks a comfortable assumption: that gold and Bitcoin behave alike in a storm. On the day Warsh spoke, they moved in opposite directions.
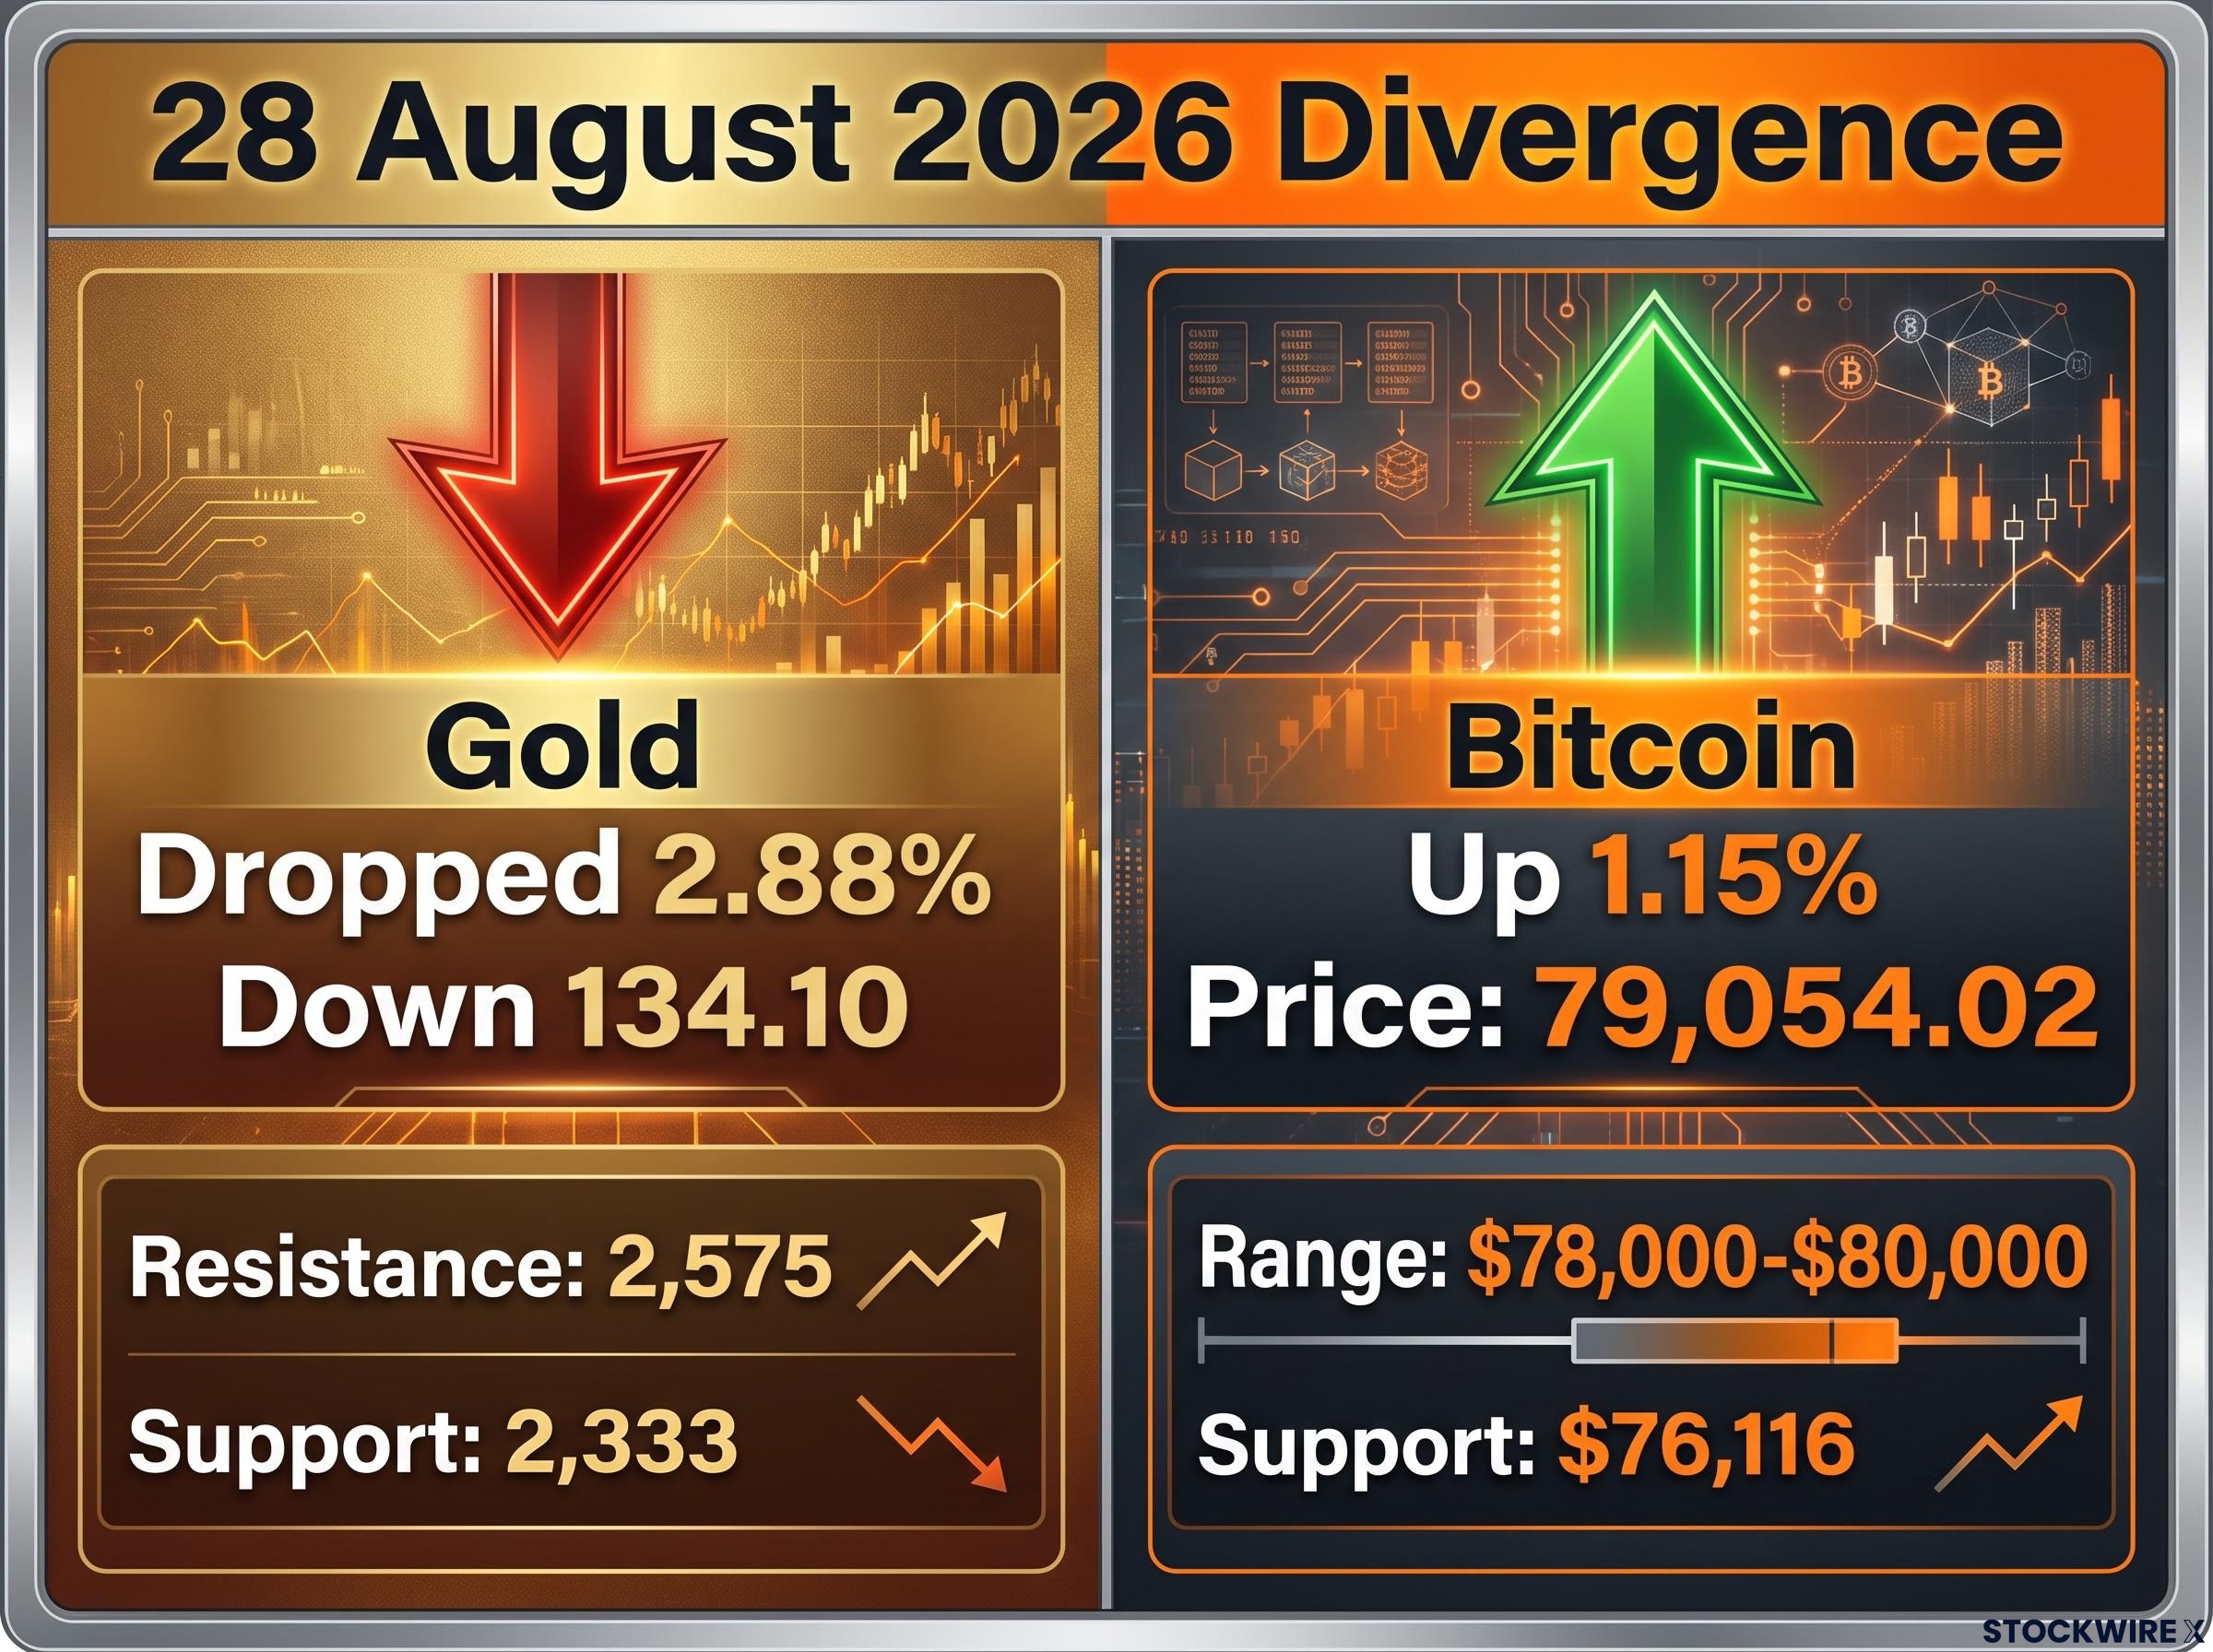
Gold fell hard, dropping 2.88%, a decline of 134.10, on 28 August 2026. Bitcoin, meanwhile, edged up 1.15% to 79,054.02 on the same day.
Gold’s weakness follows directly from the mechanics already covered. As real yields rise and the opportunity cost of holding a non-yielding metal increases, gold loses appeal, and its prior support zones tend to erode with each retest.
The structural gold bull case, grounded in central bank purchases reaching 288.9 tonnes in Q2 2026 alone and reserve de-dollarisation crossing from fringe thesis to measurable institutional shift, sits in direct tension with the real-yield mechanics now working against the metal, making the August selloff a test of whether thesis-driven institutional demand can absorb the opportunity-cost headwind.
A note on the technicals is warranted here. Spot pricing in some feeds showed gold near 4,500 around this period, but the key technical structures analysts are watching sit at lower parallel channel bounds. The 2,575 level, formerly support, now acts as resistance following the two-day decline, while 2,333 marks a confluence support target at the lower channel boundary. Treat these as structural barometers for the trend rather than a single clean price reading, since the source data diverges on the exact figure.
- Gold: Resistance at the former support of 2,575, with deeper confluence support at 2,333 if the decline extends.
- Bitcoin: Trading in a $78,000-$80,000 range, with near-term support at $76,116. A confirmed daily close below that points toward the low $70,000s, near $72,000.
Bitcoin’s modest gain might tempt you to conclude it is behaving as digital gold, the resilient hedge. The data suggests otherwise.
Through the mid-2020s, Bitcoin’s correlation has run higher with high-growth tech equities than with inflation measures. It trades far more like a high-beta liquidity sponge, a speculative asset that swells and contracts with risk appetite, than a stable store of value.
That is the distinction worth internalising. Right now, Bitcoin is priced like a leveraged tech stock reacting to liquidity conditions, while gold is responding to the cold arithmetic of real-yield opportunity cost. They are answering different questions.
For your positioning, this matters enormously. The outdated “inflation hedge” framing can lead you to misallocate capital, treating two very different exposures as interchangeable. Gold offers protection against an inflation shock; Bitcoin, in the current regime, behaves as amplified risk exposure during a liquidity contraction.
What the rate repricing changes for cross-asset portfolios
The macro backdrop has flipped from assumed easing to contingent, data-dependent tightening, and that single shift links every asset class in this analysis.
The 15-16 September 2026 FOMC meeting is a live debate, not a settled outcome. With probabilities split across venues, incoming core inflation figures and labour market data become the critical triggers for cross-asset volatility.
The variables to watch are specific. Track the trajectory of core inflation, the strength or softness of the labour market, and any geopolitical or growth shock capable of dampening yields. Each feeds directly into where the 10-year Treasury yield settles.
Until that yield finds a ceiling, the pressure stays on all fronts at once: growth equities like semiconductors, precious metals like gold, and digital assets like Bitcoin. Watch the yield, and you watch your whole portfolio.
For investors wanting to map how the rate sensitivity described here runs through their entire portfolio rather than just their equity sleeve, our full explainer on AI concentration risk details how Microsoft, Alphabet, Amazon, Meta, and Apple appear simultaneously across equities, REITs, infrastructure, and credit, often running the same thematic bet across every allocation.
This article is for informational purposes only and should not be considered financial advice. Investors should conduct their own research and consult with financial professionals before making investment decisions.
Past performance does not guarantee future results. Financial projections are subject to market conditions and various risk factors. These statements are speculative and subject to change based on market developments and central bank policy.