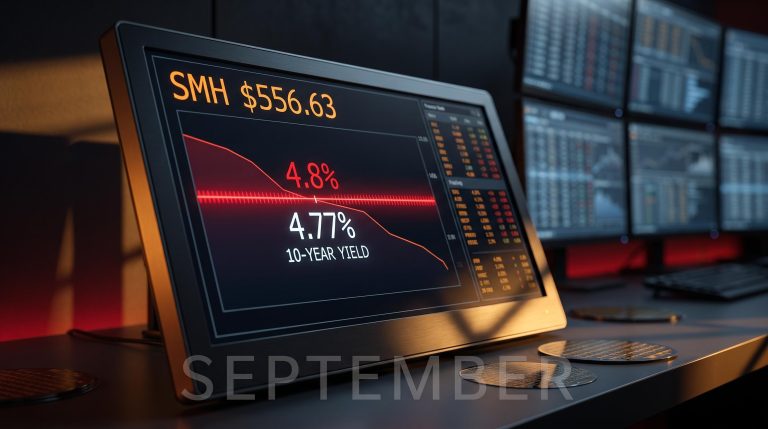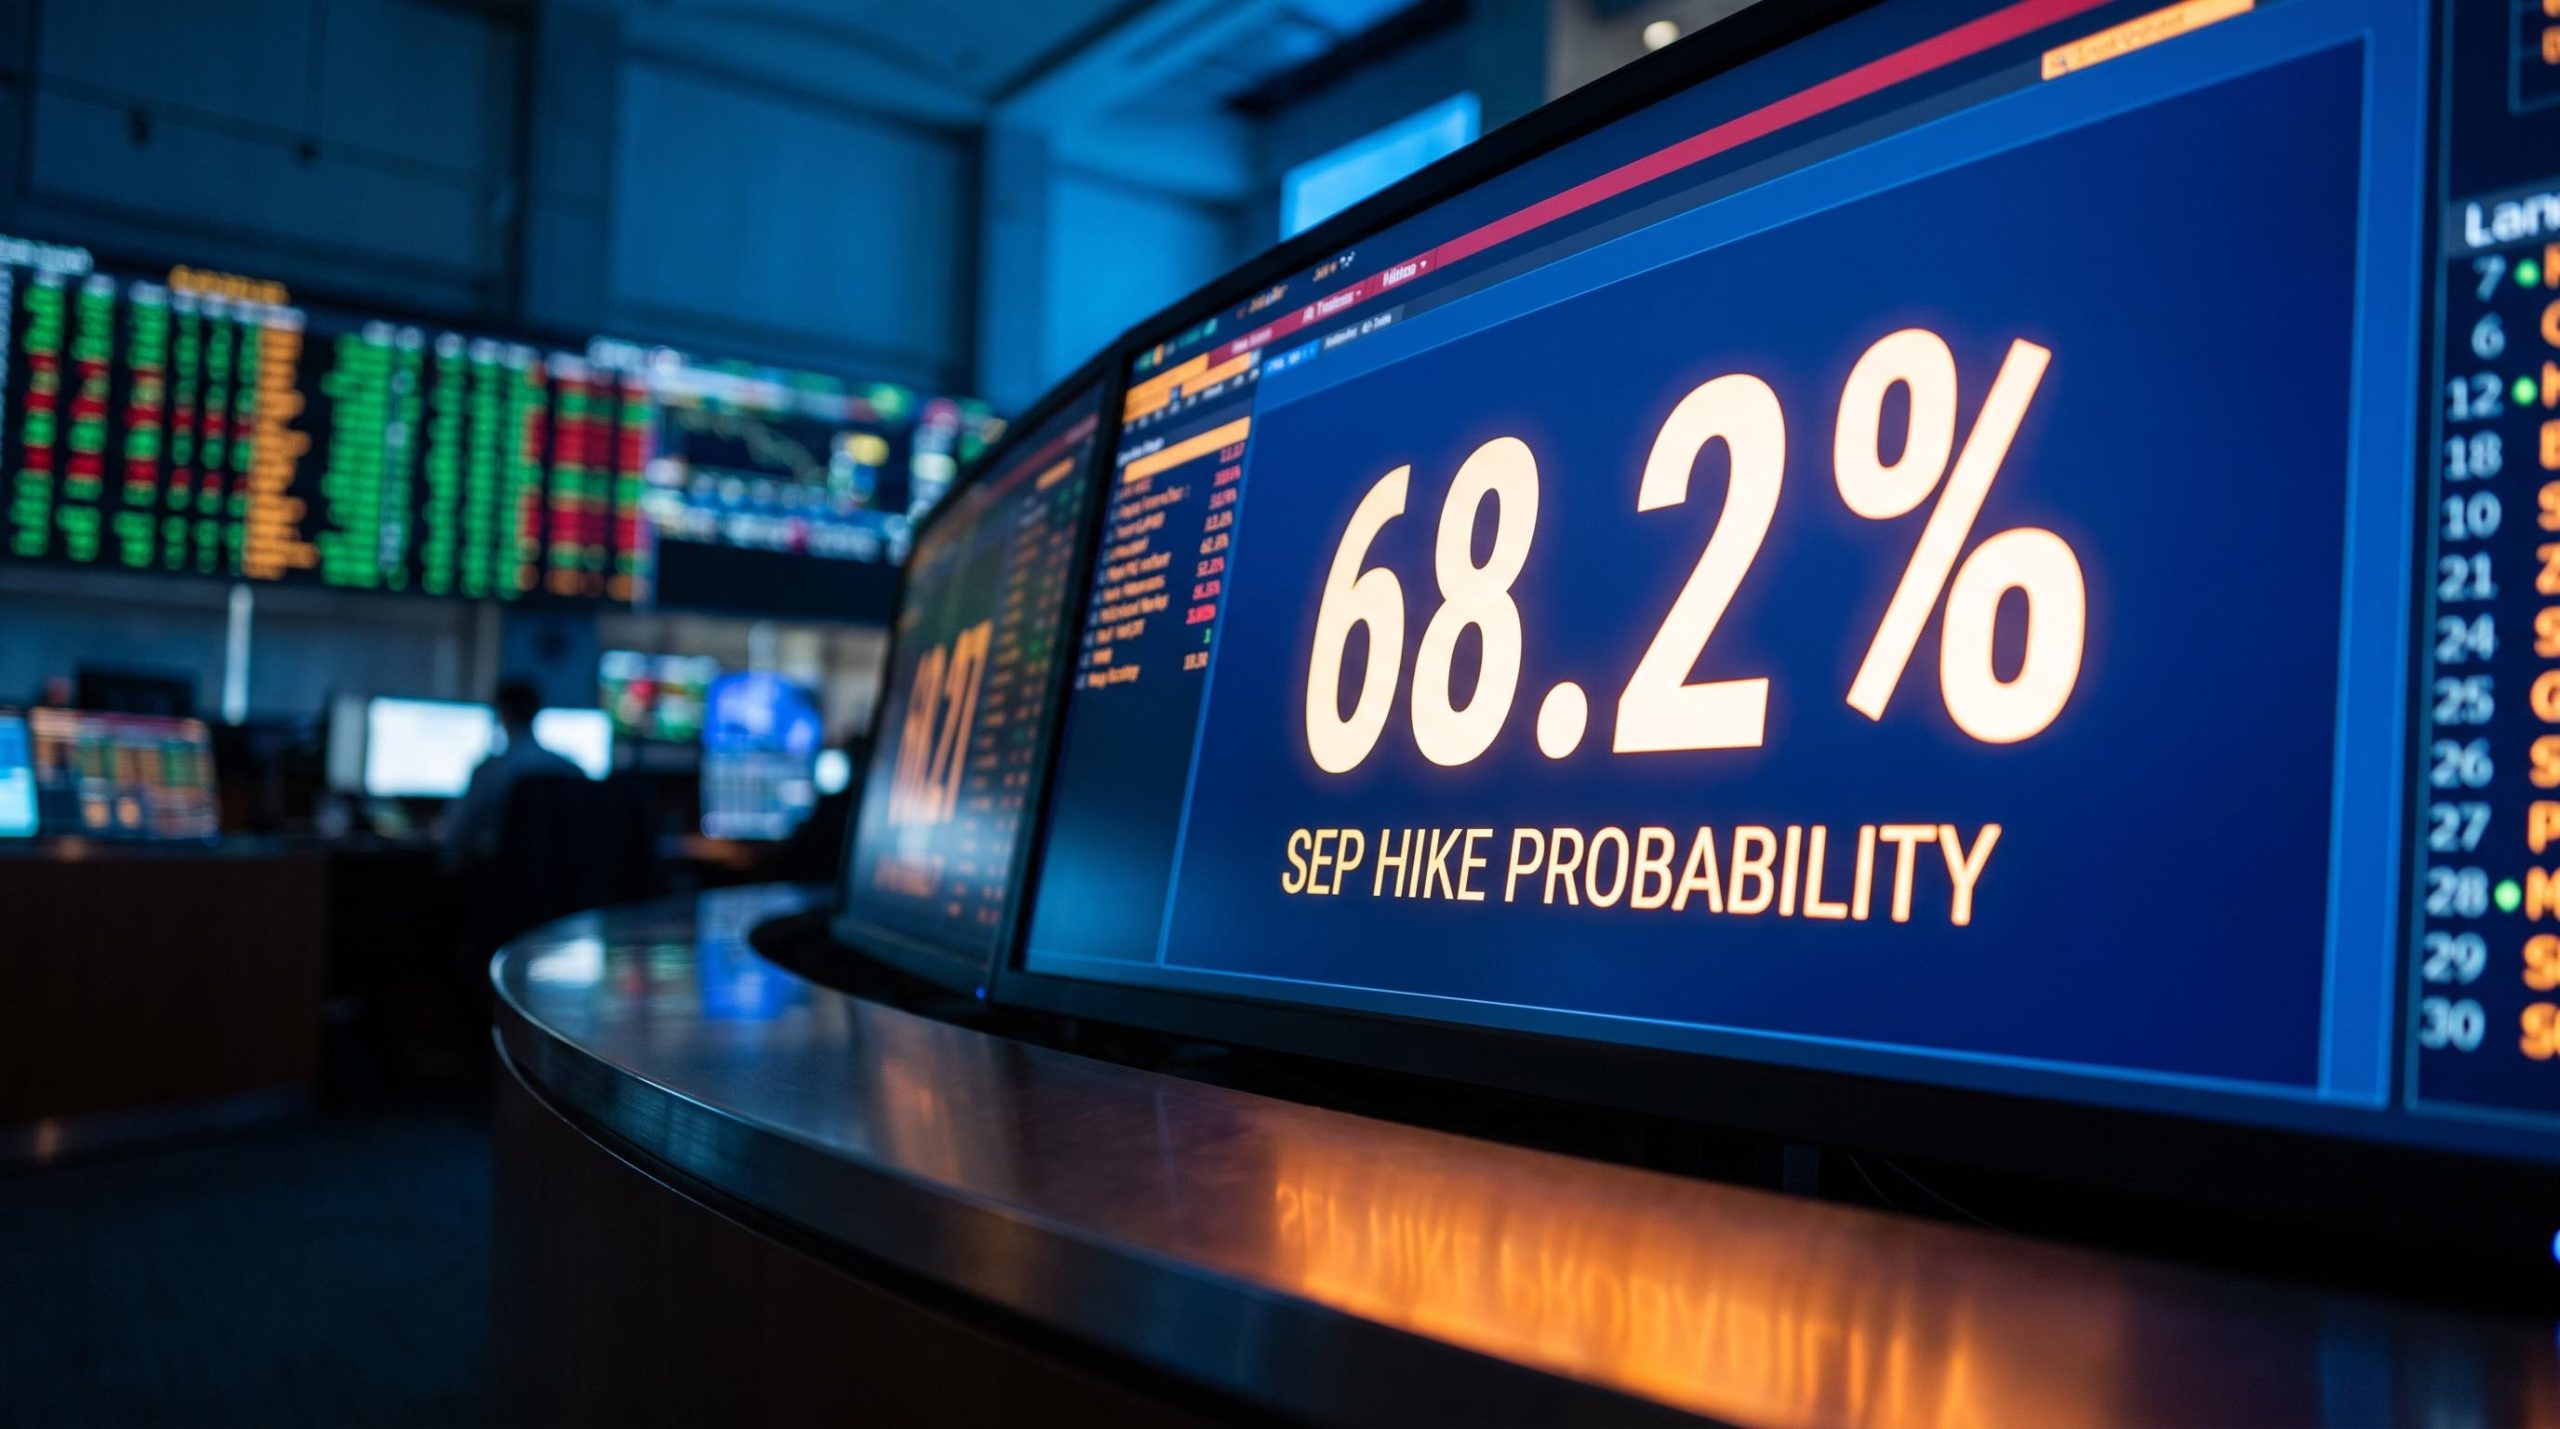
Wall Street has rarely sounded so sure of itself. Futures markets are now pricing a roughly 90% chance of at least one Federal Reserve rate hike by December, and close to 70% odds of a move as soon as this month’s meeting.
That conviction sits on top of an economy that is quietly losing momentum.
The surge in expectations traces back to a single event: Fed Chair Kevin Warsh’s hawkish tone at the Jackson Hole Symposium. Traders heard price stability at the top of the priority list and immediately repriced the path of rates, treating the chair’s rhetoric as a near-guarantee of tighter policy.
The problem is that the hard data, softening manufacturing sub-components and moderating inflation, tells a more cautious story than the confident pricing suggests.
Here is a framework for spotting the widening gap between market sentiment and economic reality, and for judging whether the consensus is walking straight into a policy mistake.
Why the market is trading rhetoric, not data
Consider the irony at the heart of the current setup. Kevin Warsh, in the Fed chair’s seat since May 2026, has stated a clear objective: to restore markets as an independent indicator that informs the Fed, rather than letting the Fed become the signal that markets simply follow.
At Jackson Hole, markets did the opposite. They fixated on his tone and repriced rates in lockstep, which is precisely the conditioned behaviour Warsh says he wants to unwind.
The scale of that repricing is worth spelling out. According to CME FedWatch data as of early September, the September 2026 meeting carries a hike probability of roughly 68.2%. A follow-on hike at the October meeting sits near 20%, and the odds of at least one hike by December have climbed to around 90%. The chance of the Fed holding steady all year has slipped below 10%.
Warsh’s communication regime was telegraphed well before Jackson Hole, with the chair telling the ECB’s Sintra Forum directly that he would not give forward guidance, making the August repricing a continuation of a designed policy rather than an improvisation that markets had failed to anticipate.
All of this is happening while the effective federal funds rate stands at 3.63%, already firmly in restrictive territory.
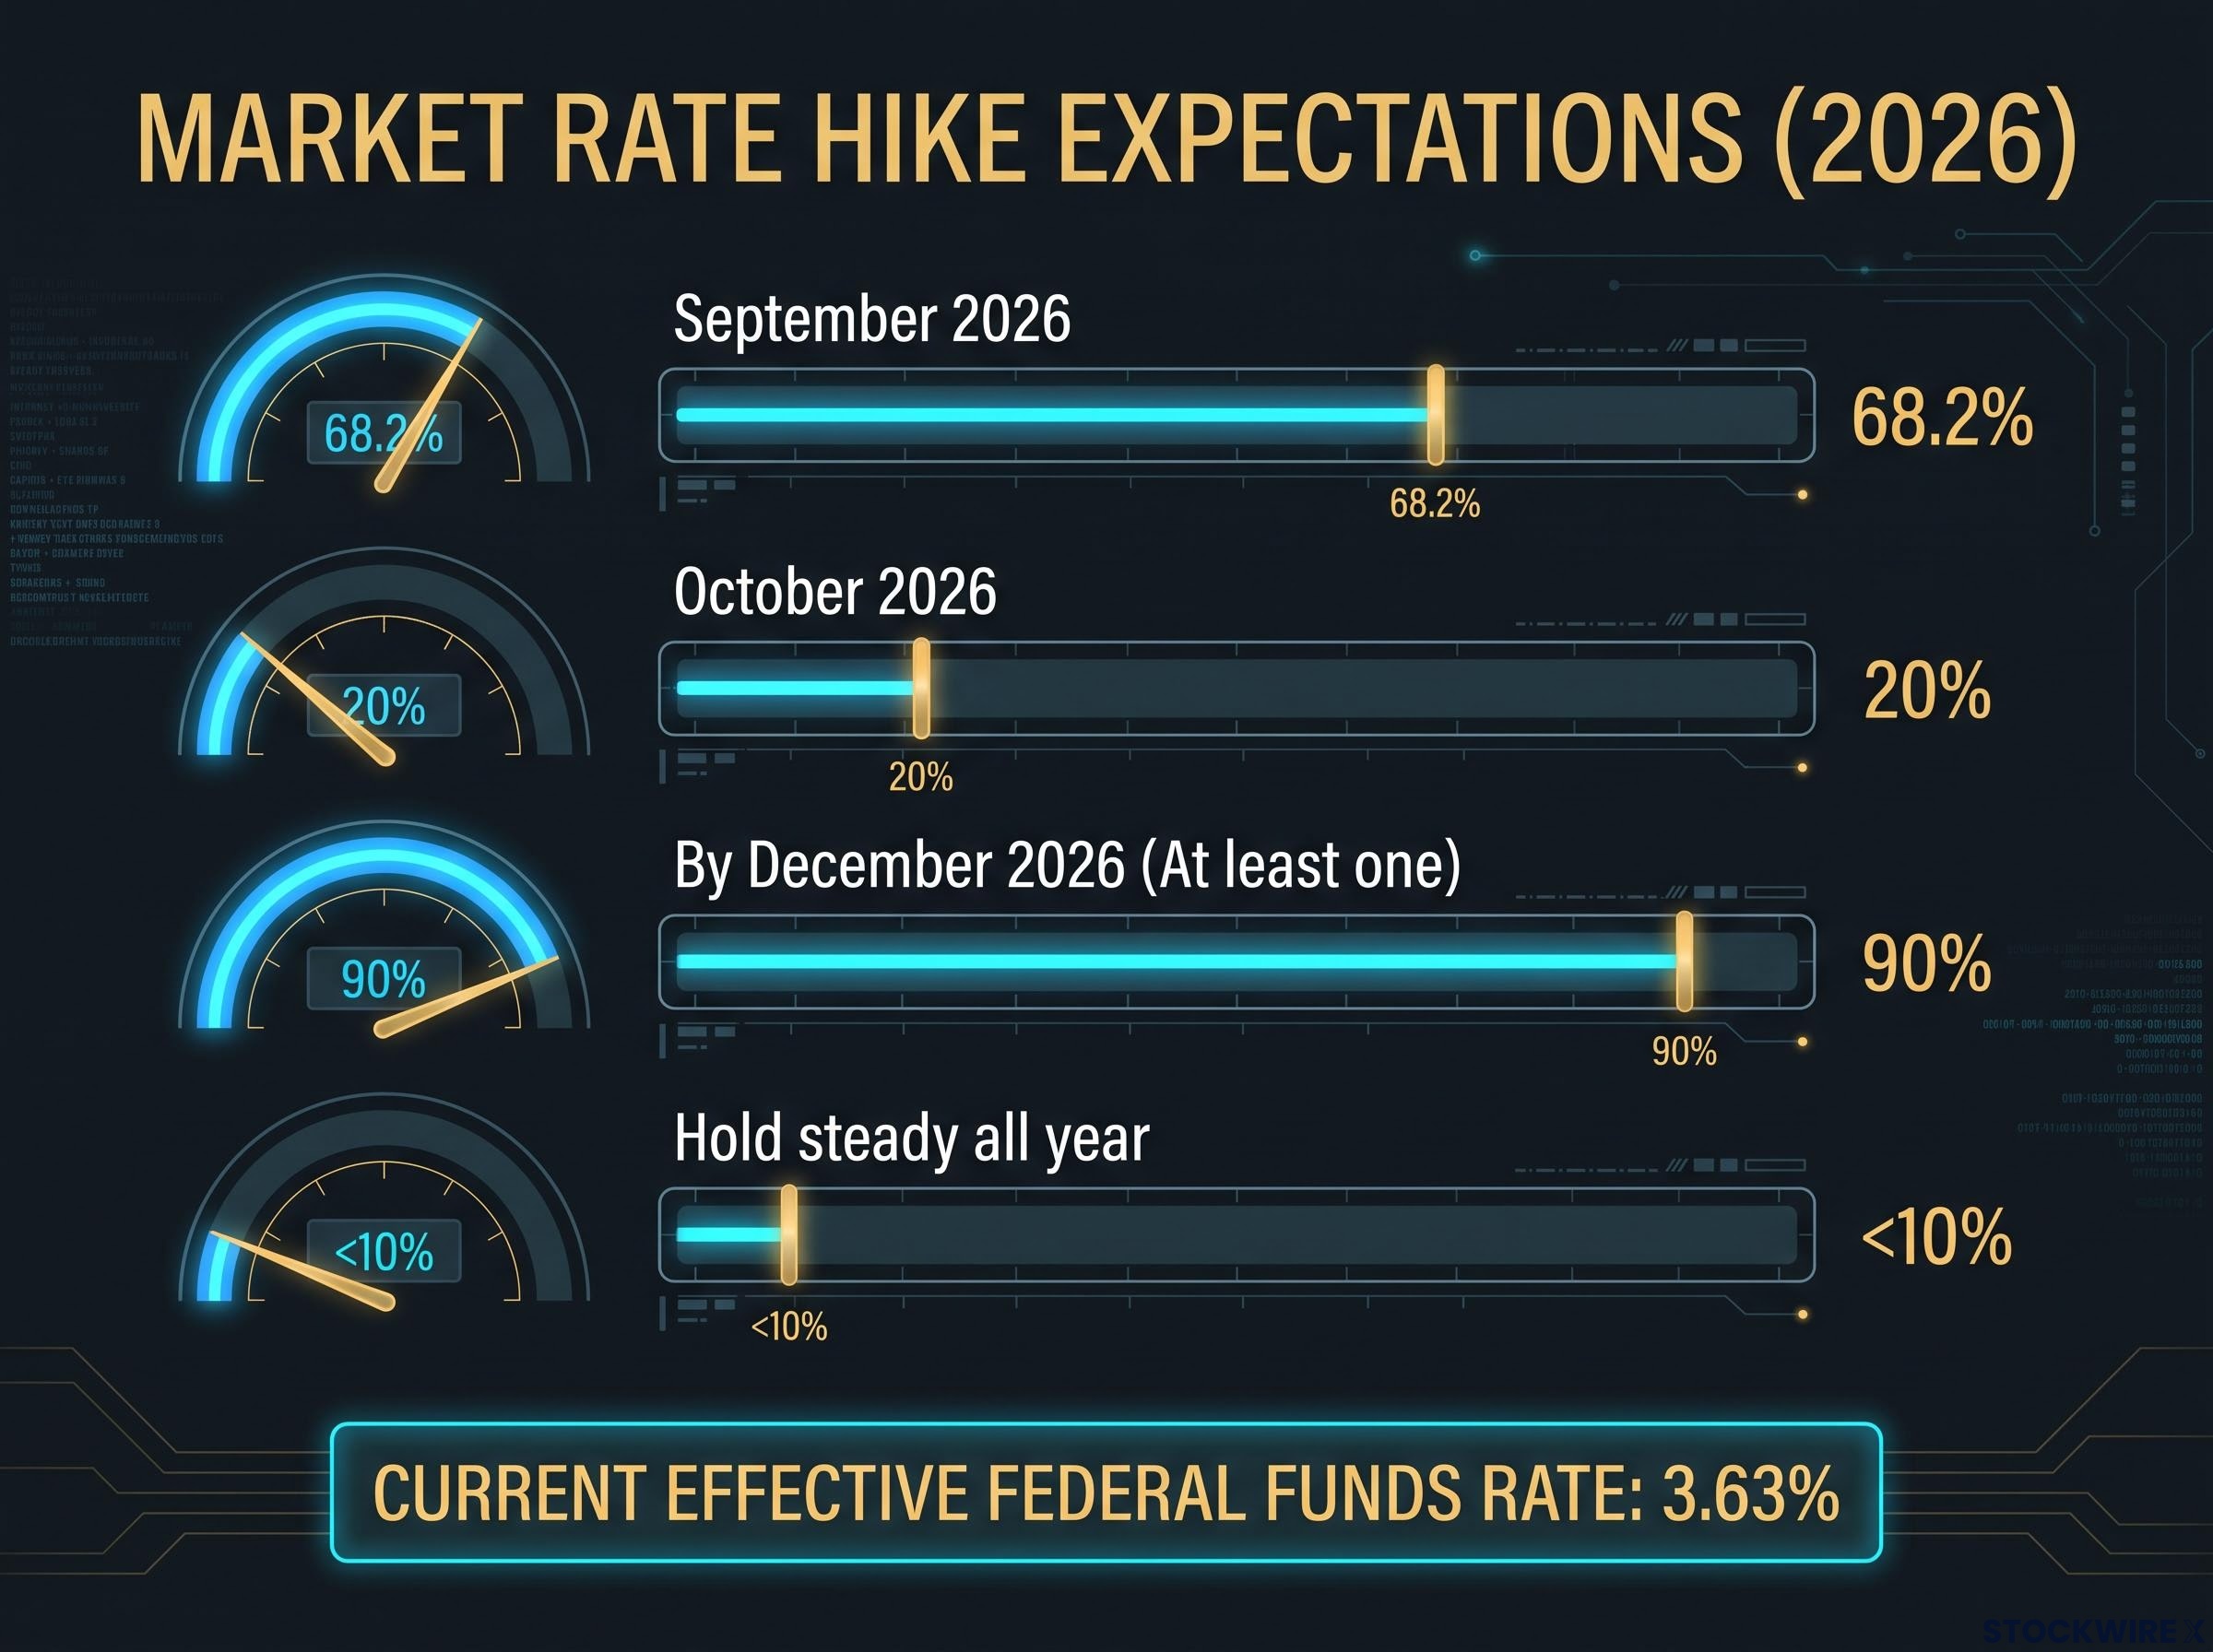
| FOMC Meeting | Hike Probability | Market Implication |
|---|---|---|
| September 2026 | ~68.2% | Near-consensus expectation of an imminent move |
| October 2026 (follow-on) | ~20% | Modest odds of back-to-back tightening |
| By December 2026 (at least one hike) | ~90% | Market treats tighter policy as almost certain |
The important point is what drove this. The real economy did not lurch overnight; the Fed chair spoke, and 15 years of conditioning did the rest.
The read you should take is that institutional investors are trading tone rather than waiting for confirmation from hard data. Factor that behavioural bias into your own outlook, because a consensus built on rhetoric can reverse just as quickly when the data finally forces the issue.
When big ASX news breaks, our subscribers know first
Understanding what rate hike probabilities actually measure
Before accepting any of these percentages as fact, it helps to understand where they come from. The figures splashed across financial headlines are not economic forecasts handed down by the Fed. They are derived from CME FedWatch, which reads probabilities out of how traders are positioned in federal funds futures.
In other words, these numbers reflect hedging and positioning, not an objective prediction of what the economy will do.
That distinction matters because of how forward guidance works. When the Fed chair speaks, official communication acts as a coordination device, giving the whole market a shared focal path for rates. That shared path reduces the effort of interpreting a stream of noisy, sometimes contradictory data releases, so traders update quickly and in the same direction.
Three constraints push professionals to overweight Fed communication rather than back their own read of the data:
- Portfolio managers find it easier to defend positions that align with Fed rhetoric than to justify contrarian bets built on their own analysis, especially if those bets go wrong.
- Risk systems and macro models often embed the Fed’s own projections, such as the dot plot, which is the chart showing where each official expects rates to go. When the tone shifts, those systems mechanically update the rate path.
- Aligning with the consensus lowers the cost of processing conflicting signals, so herd behaviour becomes the path of least resistance.
Once you see these percentages as a snapshot of risk-management positioning rather than settled truth, you can stop treating Wall Street consensus as a guaranteed outcome for your portfolio. That single reframing lets you parse daily swings in “rate hike odds” without overreacting to every headline.
The economy is cooling, not overheating
Now weigh that confident pricing against what the data is actually saying. The picture is not one of an economy straining against its limits and demanding tighter policy. It is one of gradual deceleration.
Manufacturing looks stronger on the surface than underneath
The headline ISM Manufacturing PMI for August 2026 came in at 54.6, released on 1 September, below the 55.2 consensus and down from 55.6 in July. The Purchasing Managers’ Index is a survey-based gauge where any reading above 50 signals expansion, so the sector is still growing, just more slowly.
The problem is what the headline conceals. According to the original source analysis, the sub-components tell a softer story:
- Supplier delivery times are lengthening, but the pattern points to supply chain friction rather than genuine demand-driven strain.
- Order backlogs are building at a slower pace, a sign of thinning demand in the pipeline.
- New orders are decelerating outright.
Inventories are stagnating rather than being purposefully built, and manufacturing employment is weakening. Much of the sector’s earlier strength came from a capital-spending wave tied to AI data centre construction, which makes the fading momentum in fresh demand more telling.
Labour market deceleration shows up most clearly in coincident rather than headline figures: both ISM Manufacturing Employment at 46.4 and ISM Services Employment at 48.0 were simultaneously in contraction as of April, stripping away the services buffer that had previously offset goods-sector softness.
Inflation was already moderating before the hawkish turn
On the price side, the case for urgency looks even thinner. Three-month annualised PCE inflation, the Fed’s preferred measure of consumer prices, has been declining since March. Six-month PCE has fallen for two consecutive months after peaking in May.
That cooling was under way before Warsh’s Jackson Hole remarks, not after.
The BEA Personal Income and Outlays report for July 2026 provides the official PCE price index readings underlying these trends, confirming that the deceleration in the Fed’s preferred inflation gauge was a measured, data-driven reality rather than a projection.
Long-term inflation expectations back this up. As of April 2026, the 5-year breakeven inflation rate sat at 2.60% and the 10-year at 2.38%, both close to target and stable despite the rebound in oil prices since July.
Stable breakevens matter for a simple reason: they suggest the recent oil move is not the kind of entrenched inflation that rate hikes can fix. Suppressing oil demand through tightening would require economically painful levels of restriction.
Put the two threads together, softening order backlogs and falling inflation metrics, and the economy already looks like it is decelerating. Watch growth-sensitive assets for vulnerability regardless of what the Fed signals.
The razor’s edge and the risk of a policy mistake
This is where analysis shades into caution. The danger is not that the Fed cannot hike; it is that hiking here could repeat a mistake the central bank has made before.
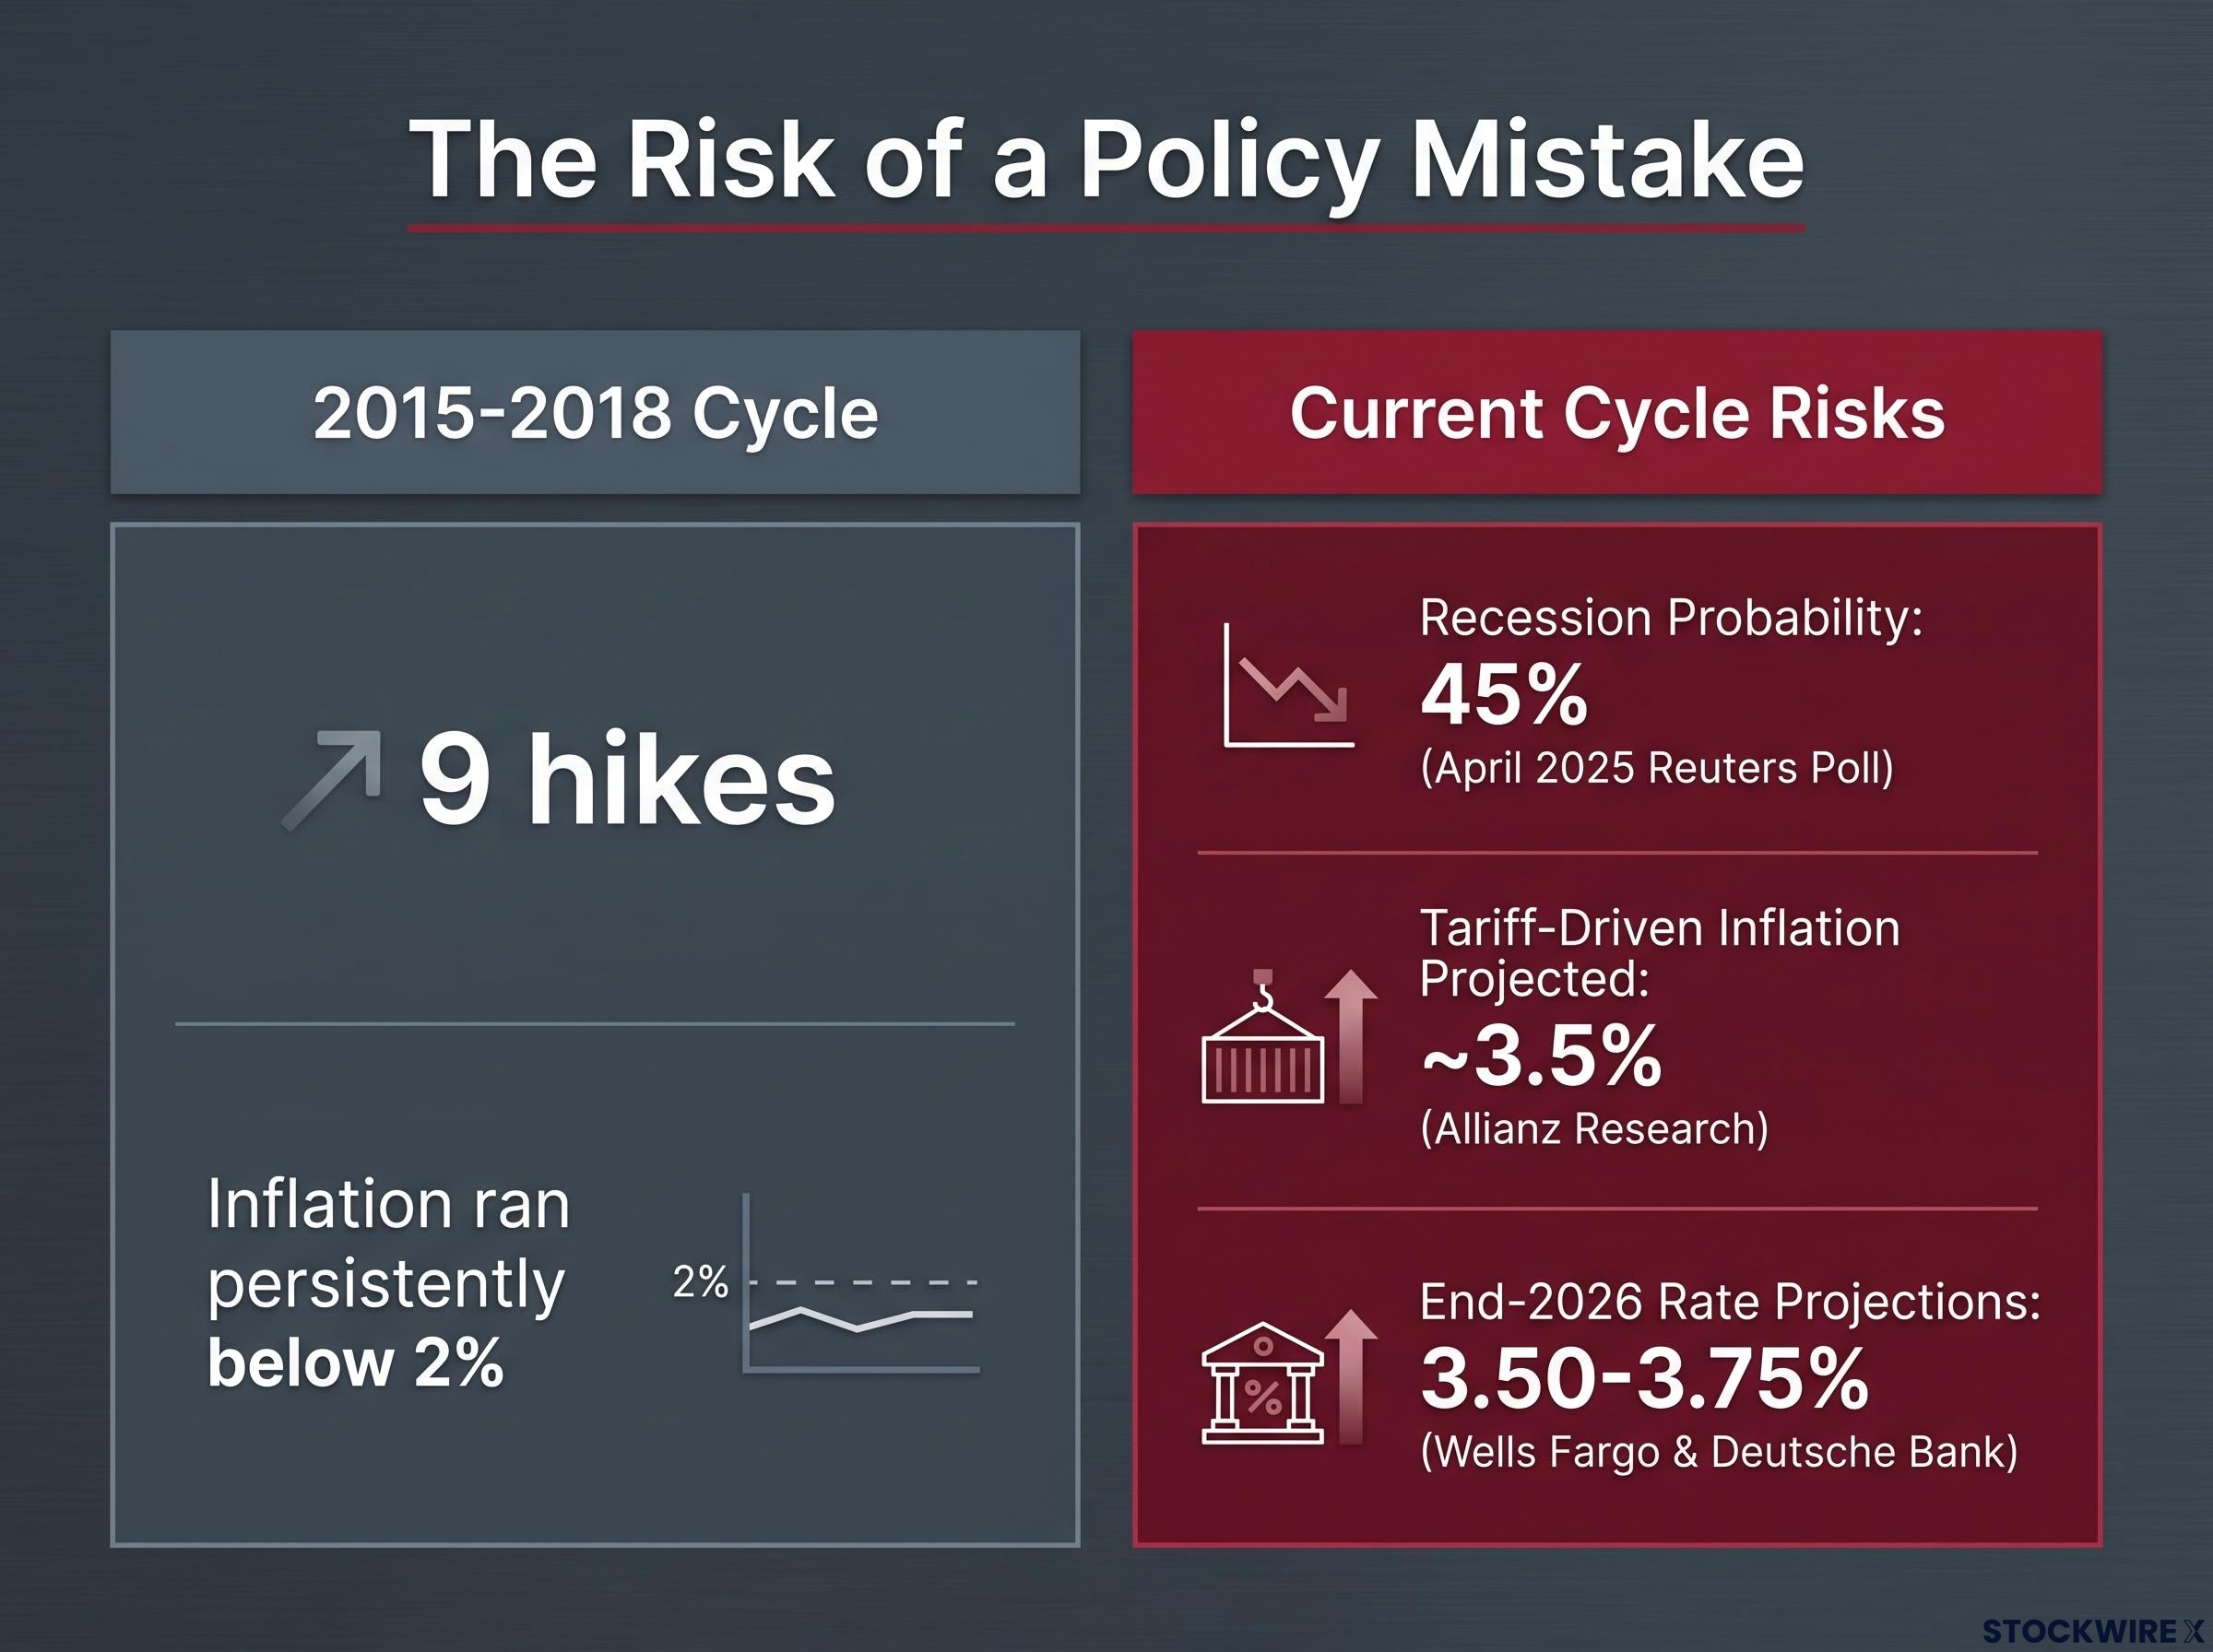
The clearest parallel is the 2015-2018 tightening cycle. According to AEI analysis by James Pethokoukis, the Fed pushed through nine hikes and shrank its balance sheet while inflation ran persistently below 2%, overestimating the neutral rate and leaving policy tighter than intended. Moody’s Analytics reached a similar conclusion, describing mid-2010s tightening into sub-target inflation as a genuine error that suppressed employment, wages and asset values, with manufacturing hit hardest.
The mechanism problem makes today’s version more acute. Allianz Research has framed the Fed as facing stagflation risk, with tariff-driven inflation projected toward 3.5%. Their point is blunt: higher rates restrain domestic demand, but tariff-driven prices come from trade policy and supply channels. Tightening compounds the growth hit without touching the source of the inflation.
Energy-driven inflation, where a 1.3 percentage-point gap between headline CPI and core CPI signals a supply shock rather than a demand spiral, is precisely the kind of price pressure that rate hikes are poorly positioned to address, because tightening reduces domestic demand without touching the commodity supply channel driving prices higher.
The recession math is not comforting either. A Reuters economist poll in April 2025 put the median 12-month recession probability at 45%, the highest since December 2023. End-2026 policy rate projections from institutions including Wells Fargo and Deutsche Bank cluster around 3.50-3.75% or higher, implying limited room to normalise without risk.
The razor’s edge A Bankrate survey published in January 2026 quoted economists saying the economy is not “falling off a cliff” but is “walking on the razor’s edge of a slowdown.”
The historical precedent of hiking into supply-driven inflation shows how fast a soft landing can disappear. If the Fed follows through, prepare your portfolio for the turbulence that a policy misstep tends to produce.
Navigating the gap between consensus and reality
The tension is now hard to ignore. A 68% September hike probability sits directly against manufacturing sub-components that are softening and PCE inflation that was already easing before the hawkish turn.
That makes the September FOMC meeting more than a rate decision. It is a test of whether the Fed honours its own data-dependent mandate or bends to the market expectations its rhetoric accidentally created.
Watch which side of the disconnect breaks first. If the ISM Services print and the next employment report confirm the cooling trend, the case for a hike weakens fast. If inflation surprises higher, the market’s conviction gets vindicated.
Investors navigating the current disconnect will find our dedicated guide to positioning for amber-light recession risk useful, which covers the specific Sahm Rule trigger levels, services PMI thresholds, and portfolio adjustments that define the boundary between cautious and defensive postures.
This article is for informational purposes only and should not be considered financial advice. Investors should conduct their own research and consult with financial professionals before making investment decisions. Past performance does not guarantee future results, and these forward-looking statements are speculative and subject to change based on market developments.