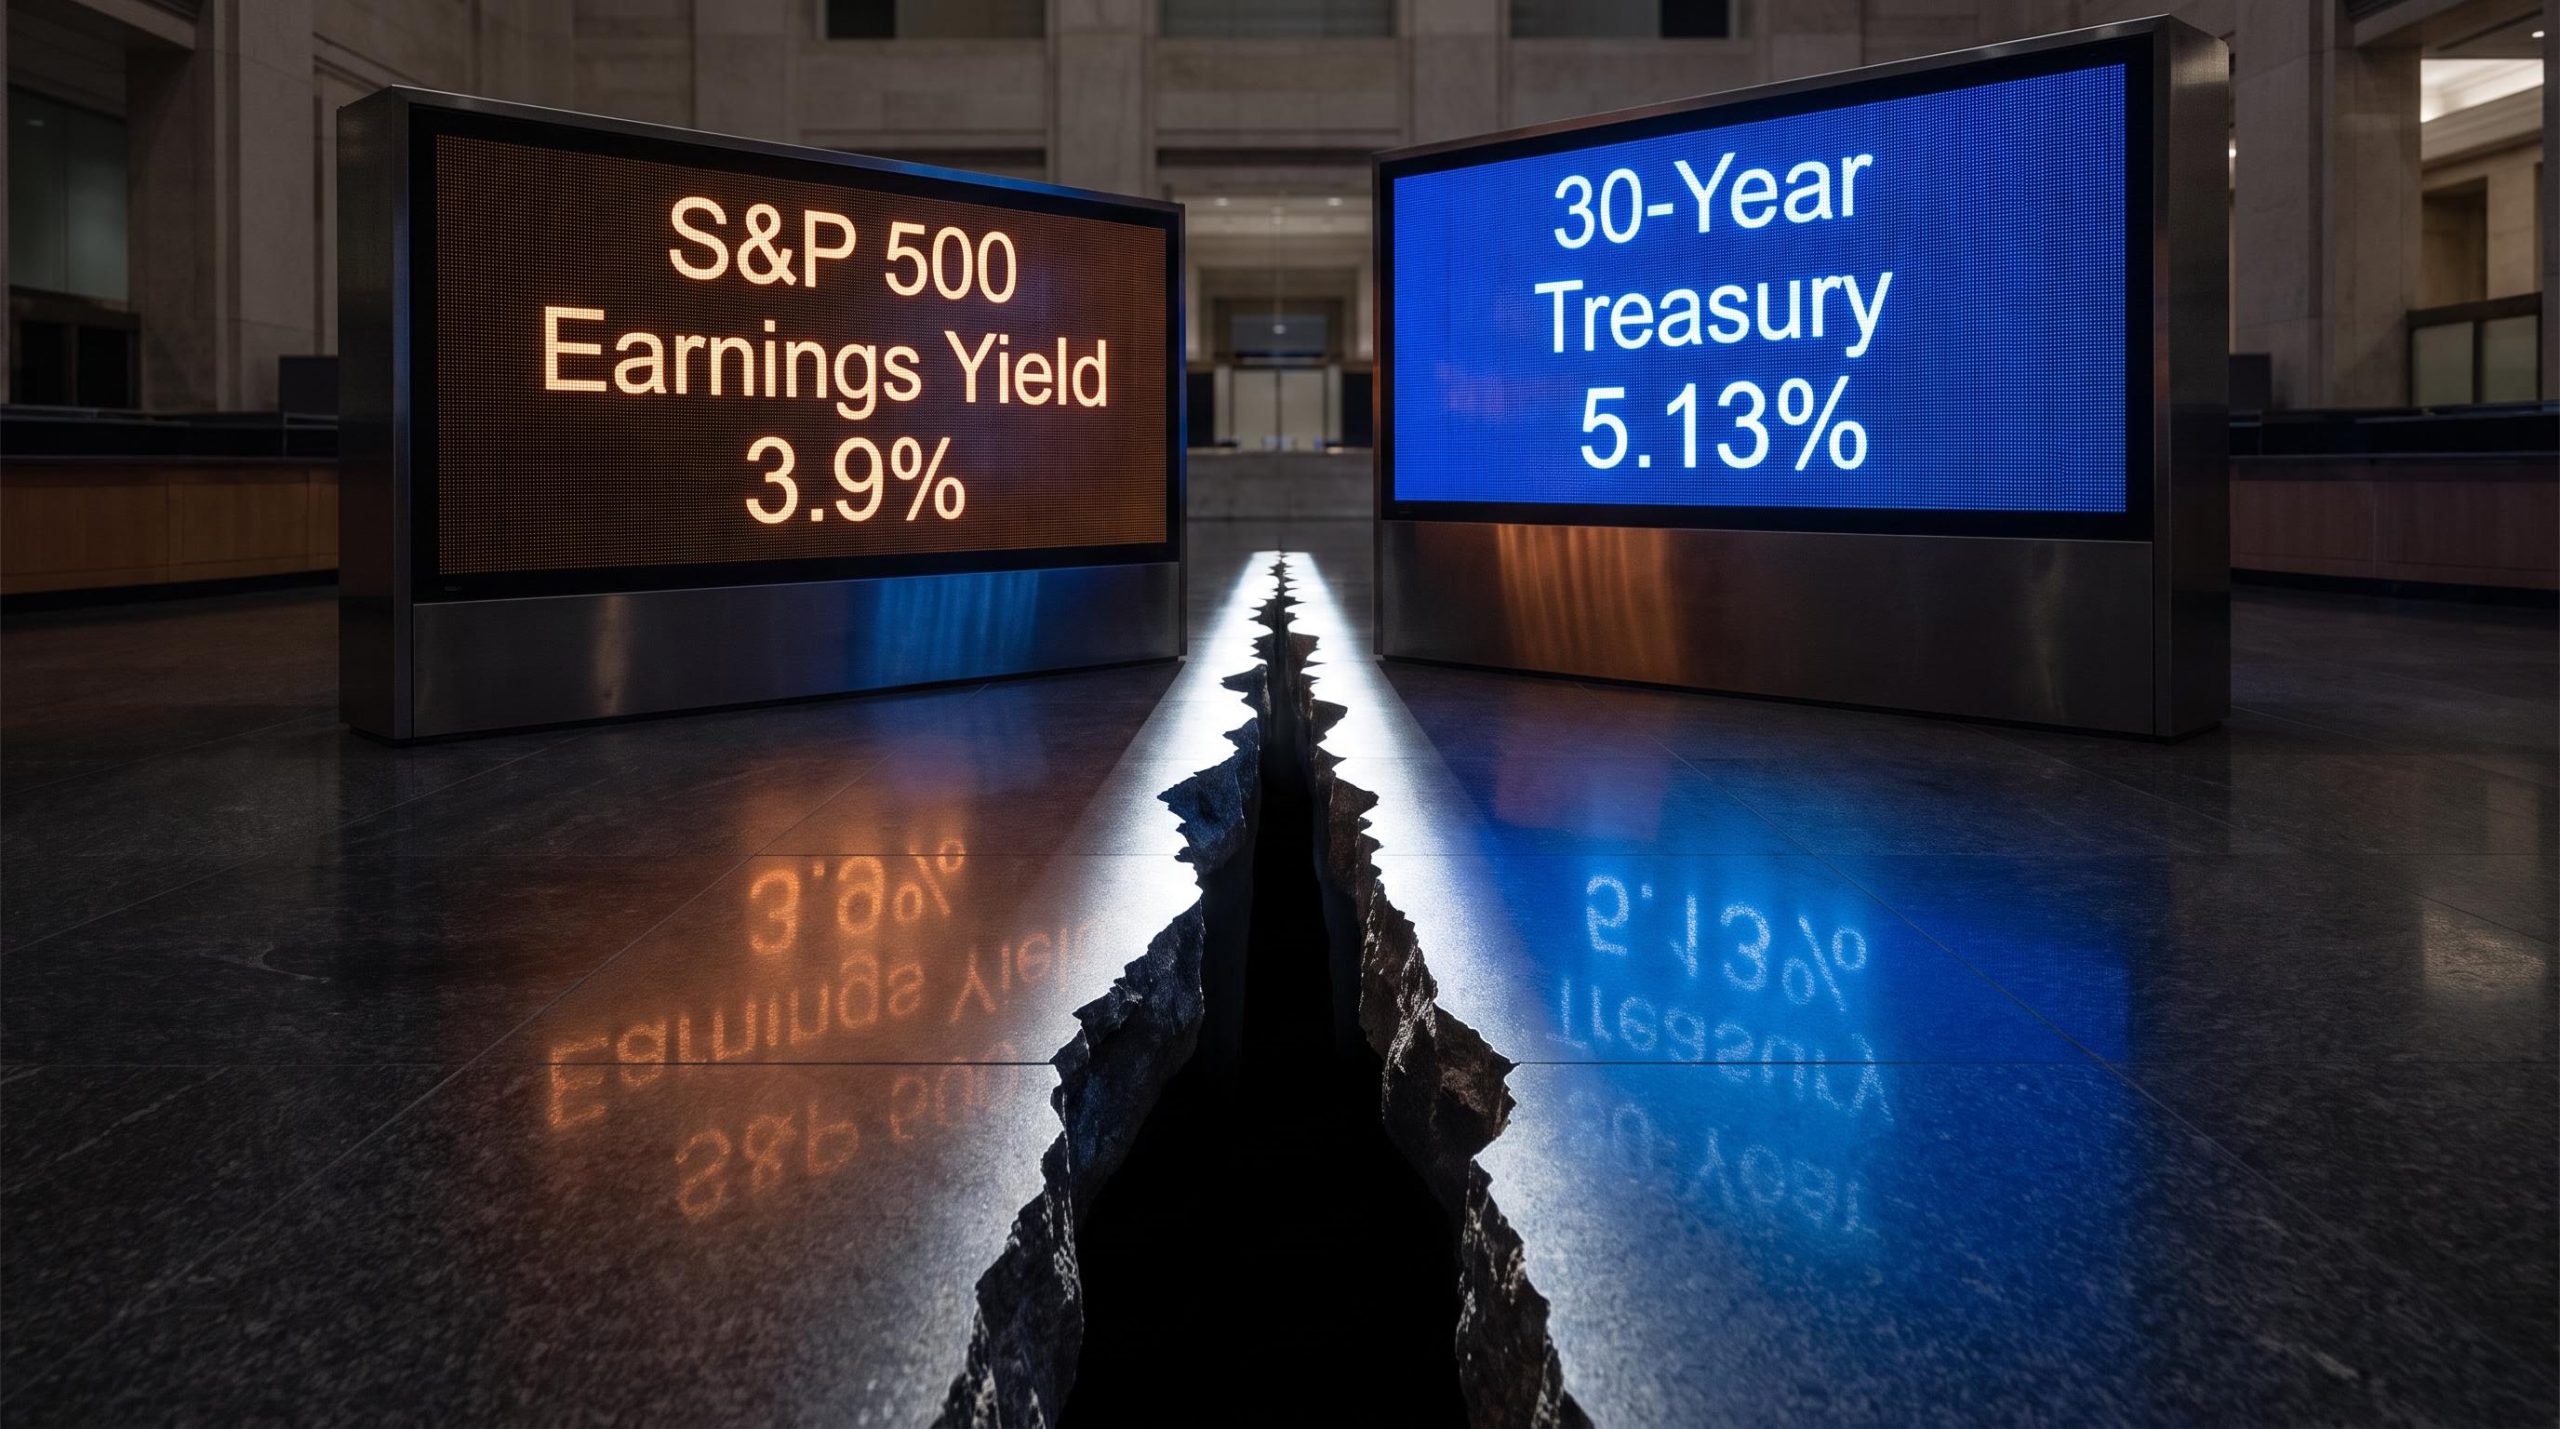
Right now, the stock market is paying you less than a U.S. government bond. Buy an S&P 500 index fund and the earnings backing your shares yield roughly 3.9%. Lend money to the U.S. Treasury for 30 years and you collect 5.13%. Most people holding index funds have no idea this condition exists.
That inversion has a name, and it matters more than almost any single number in your portfolio right now. It means the equity risk premium, the extra return you are supposed to earn for taking on stock market risk instead of parking your money in a government bond, has gone negative on the simplest measure. The last time it sat here was the tail end of the dot-com bubble.
This is not a marginal technical detail. With AI-linked equities now accounting for somewhere between 33% and 45% of the entire S&P 500’s market value, the compensation you are receiving for that concentrated risk has quietly disappeared on a raw earnings basis.
After reading this, you will know what the equity risk premium is and why a negative reading is structurally significant, why AI-heavy portfolios are the most exposed, what the 1997 to 2000 period tells you about how long this can persist, and what questions you should be asking about your own holdings. This is situational clarity, not a buy or sell call.
What the equity risk premium is, and why a negative reading is a structural signal
Start with the instrument itself. The equity risk premium is the additional return you demand for holding stocks instead of a risk-free government bond. Stocks are riskier: earnings can fall, prices swing, companies fail. So you expect to be paid extra for the discomfort. That extra is the premium.
Normally it is comfortably positive. Over the long run, U.S. equities have paid a premium of roughly 5% over Treasuries, according to Aswath Damodaran’s long-term series at NYU Stern. When that cushion shrinks or vanishes, the basic reason for owning stocks over bonds weakens.
Here is where it gets slippery. There is no single official ERP, and the way you measure it changes what you see.
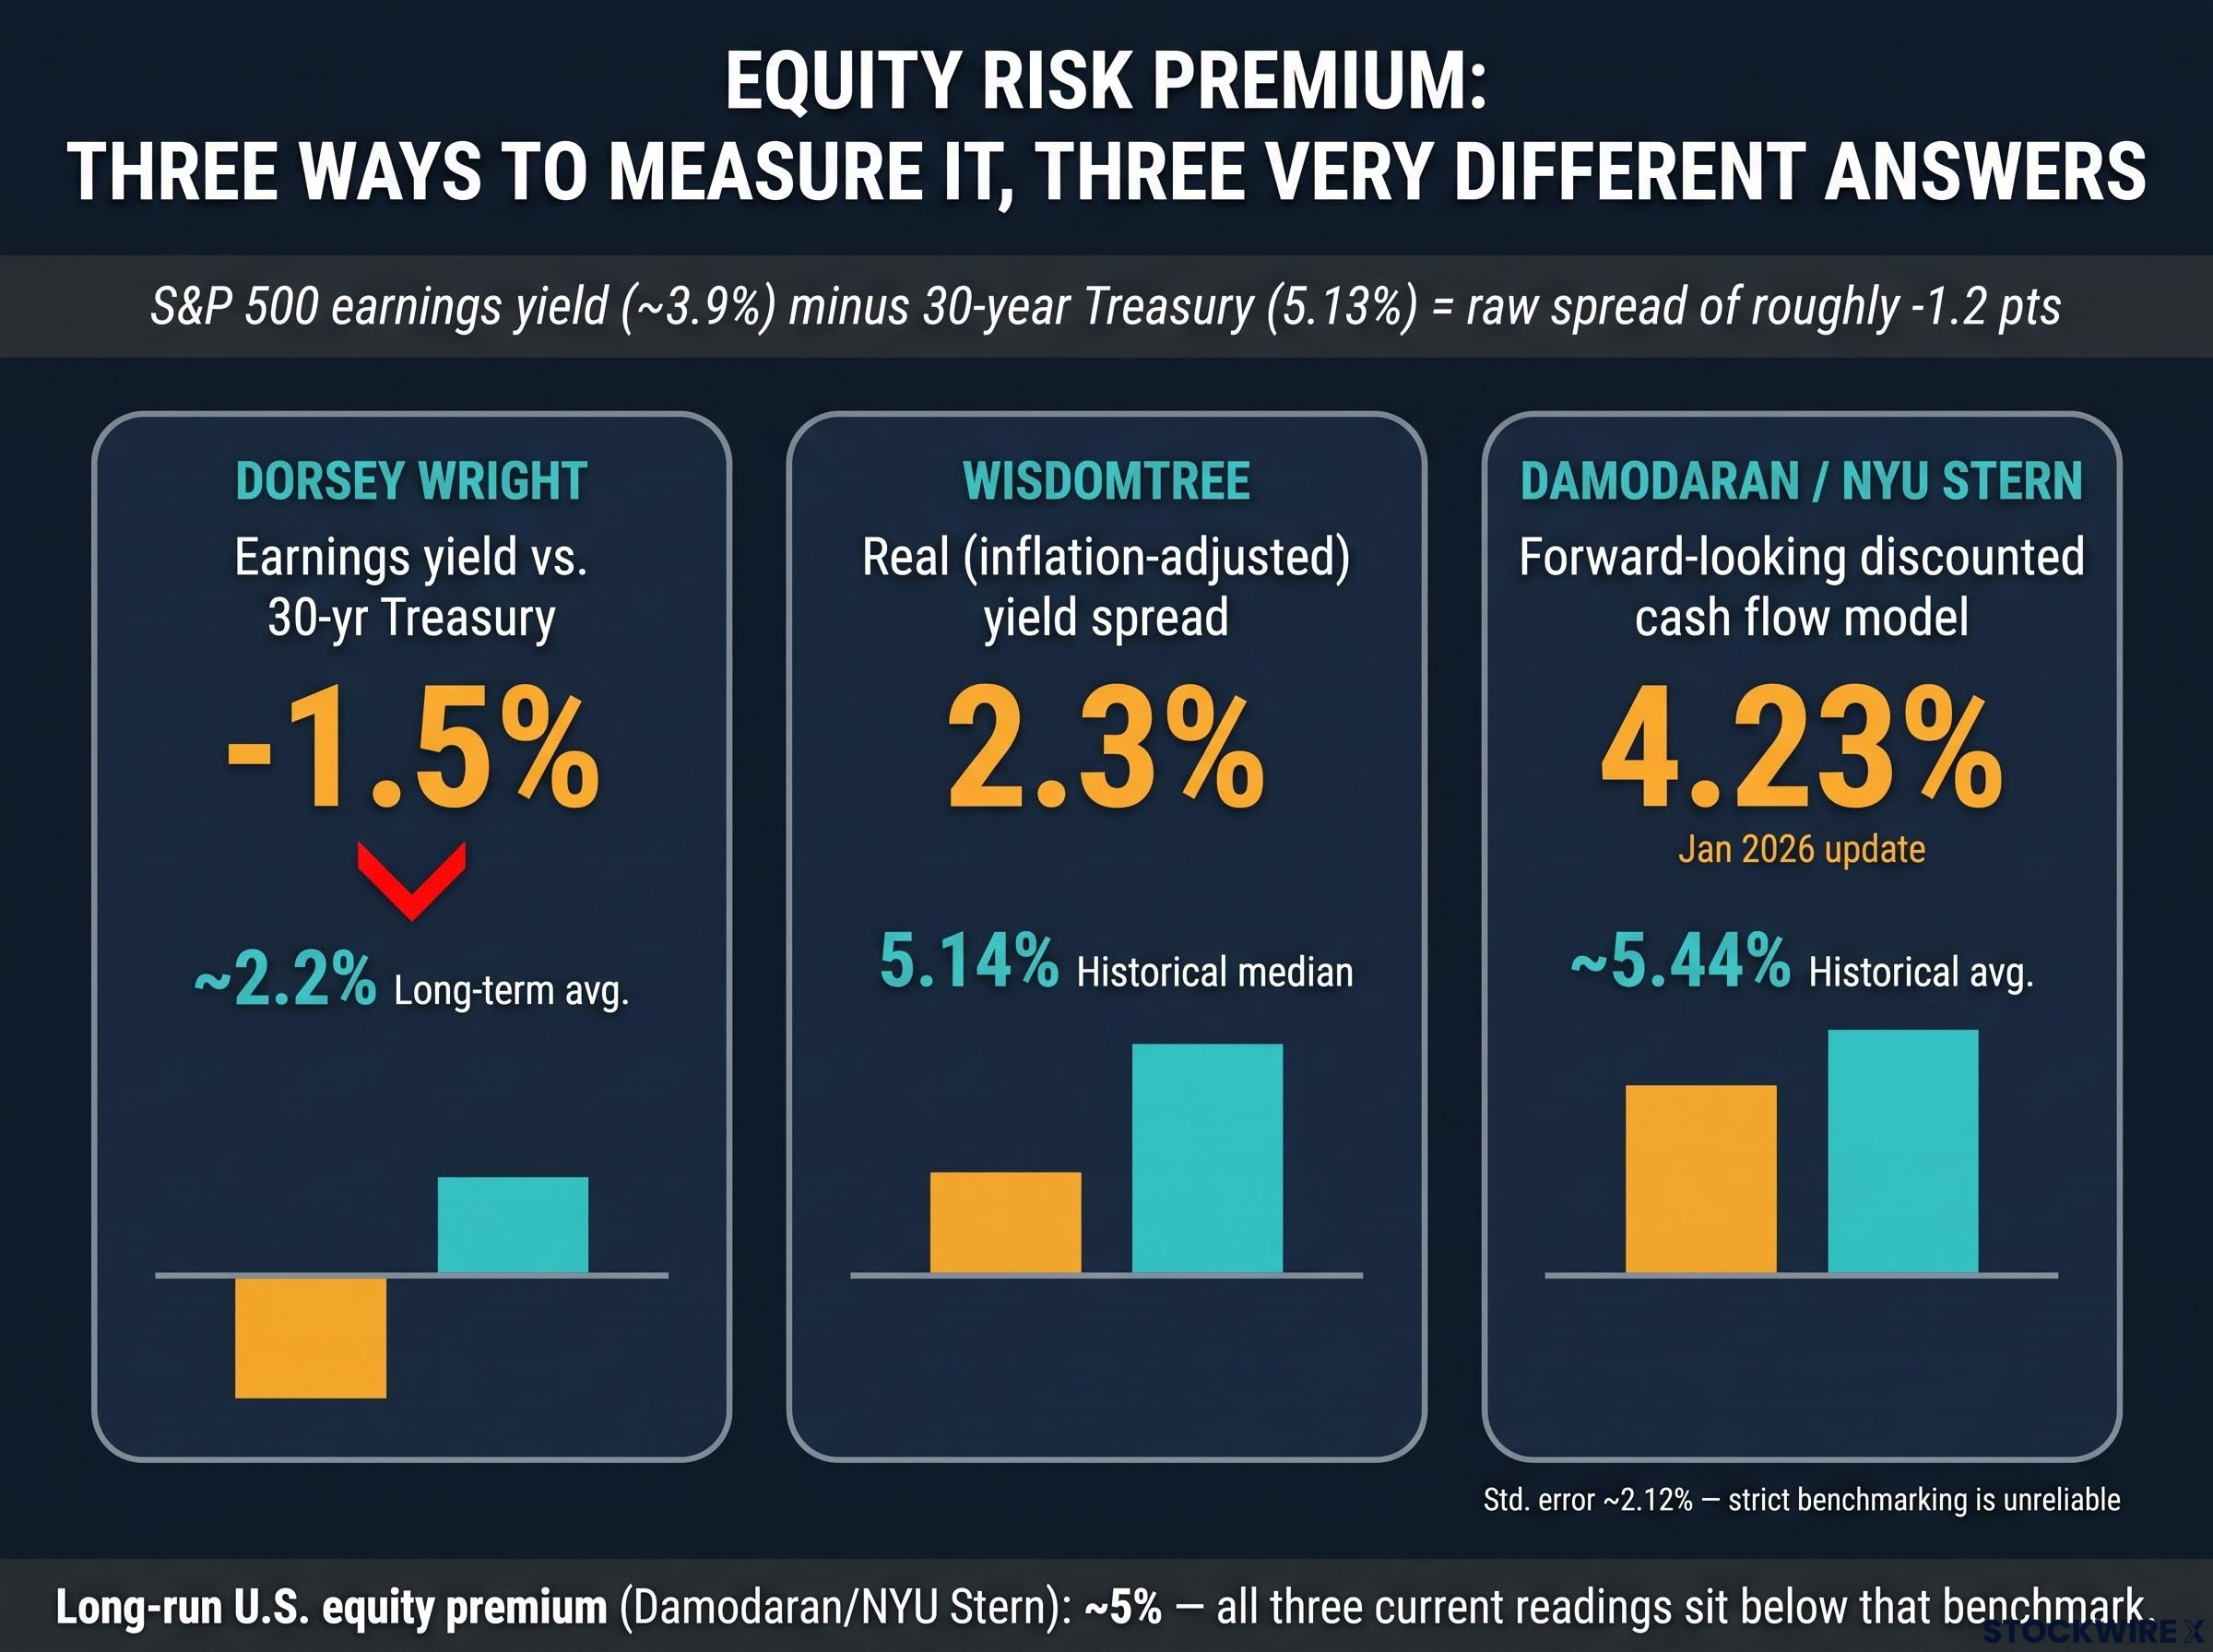
The simplest approach takes the S&P 500 earnings yield (company earnings divided by price) and subtracts the Treasury yield. On this basis, Nasdaq Dorsey Wright measured the premium against the 30-year Treasury at roughly -1.5% in 2026, well below its long-term average of around 2.2%. Negative. Equities yielding less than the bond.
A related version from WisdomTree, which subtracts real (inflation-adjusted) yields, put the premium at 2.3%, still sharply below its historical median of 5.14%. Damodaran’s model, which does something different entirely, reads much higher.
Why different methodologies produce such different readings
Damodaran uses a forward-looking model that discounts expected future cash flows, applies smoothed growth assumptions, and benchmarks against the 10-year bond. His January 2026 update put the implied premium at 4.23%. That is a more stable, more optimistic figure because it bakes in years of expected growth rather than snapshotting today.
The simple spread measures do no such thing. They take the current earnings yield against current long-term bond yields with zero growth adjustment, which makes them far more sensitive to the immediate rate environment.
Neither is wrong. They answer different questions, and it is worth knowing which one your broker or fund manager is quoting when they reassure you.
| Methodology | Current ERP estimate | Historical average / median |
|---|---|---|
| Dorsey Wright: earnings yield vs. 30-year Treasury | -1.5% | ~2.2% (long-term avg.) |
| WisdomTree: real yield spread | 2.3% | 5.14% (historical median) |
| Damodaran: implied DCF model | 4.23% | ~5.44% (historical avg.) |
The gap between Damodaran’s 4.23% and Dorsey Wright’s -1.5% is not a reason to dismiss the signal. It tells you that how you measure the premium changes what you see, and that on the most legible, most intuitive market-based measure, the compensation for holding stocks over bonds has evaporated.
When big ASX news breaks, our subscribers know first
Why AI-heavy portfolios are structurally exposed when the ERP turns negative
Now take that abstract mechanic and point it at the stocks you almost certainly already own. If you hold a standard S&P 500 index fund, you are holding a portfolio dominated by long-duration AI growth stocks, and they are the single most exposed asset class when the premium compresses.
Here is why. Duration, a term borrowed from bonds, measures how sensitive an asset’s value is to changes in the discount rate. Long-duration growth stocks derive most of their valuation from cash flows expected far in the future. When the rate used to discount those future cash flows rises, the present value of a payoff a decade away falls much harder than the value of cash a company earns today.
Value stocks pay you now. AI mega-caps promise you later. That “later” is what gets repriced when yields climb and the premium shrinks at the same time.
Growth stock valuations compress fastest when discount rates rise because the bulk of their intrinsic value sits in cash flows projected years into the future, and a higher rate shrinks the present value of those distant payoffs far more aggressively than it affects a business earning most of its money today.
The concentration is the problem, because you cannot diversify away from it inside a standard index fund. Consider the exposure baked into the S&P 500:
- The Magnificent 7 accounted for roughly 33.8% of the S&P 500’s market cap as of June 2026, according to InvestmentNews, with Leo Wealth estimating over 34%.
- The technology sector alone represented about 40% of the index, per Motley Fool’s July 2026 analysis.
- AI-linked equities more broadly commanded roughly 45% of total S&P 500 market cap, according to Goldman Sachs-referenced reports.
- The Magnificent 7 traded at a forward price-to-earnings ratio of around 28x, versus roughly 20x for the rest of the index, per Leo Wealth’s September 2025 note.
That 28x forward multiple is not just an expensive number. It encodes two assumptions: that discount rates stay low, and that AI monetisation delivers at scale. A negative equity risk premium directly challenges the first of those. If rates stay elevated and the premium stays gone, the valuation gap between what these stocks are priced at and what their required return now demands widens sharply.
Equity duration, the effective average time at which a stock’s future cash flows repay today’s price, explains why the Magnificent 7 carry structurally higher rate sensitivity than the rest of the index; Morgan Stanley estimates a 100 basis-point rise in real yields drives 3-4 turns of multiple compression in U.S. growth stocks with no change in underlying business fundamentals required.
Analysts describe a feedback loop worth understanding. Rising yields compress the premium, which pressures AI mega-caps. Because those same mega-caps make up a third or more of the index, their fall drags the entire market down with them.
The uncomfortable implication for a passive investor is that your “diversified” fund is carrying enormous concentrated duration risk. It matters when yields rise, not only when AI earnings disappoint.
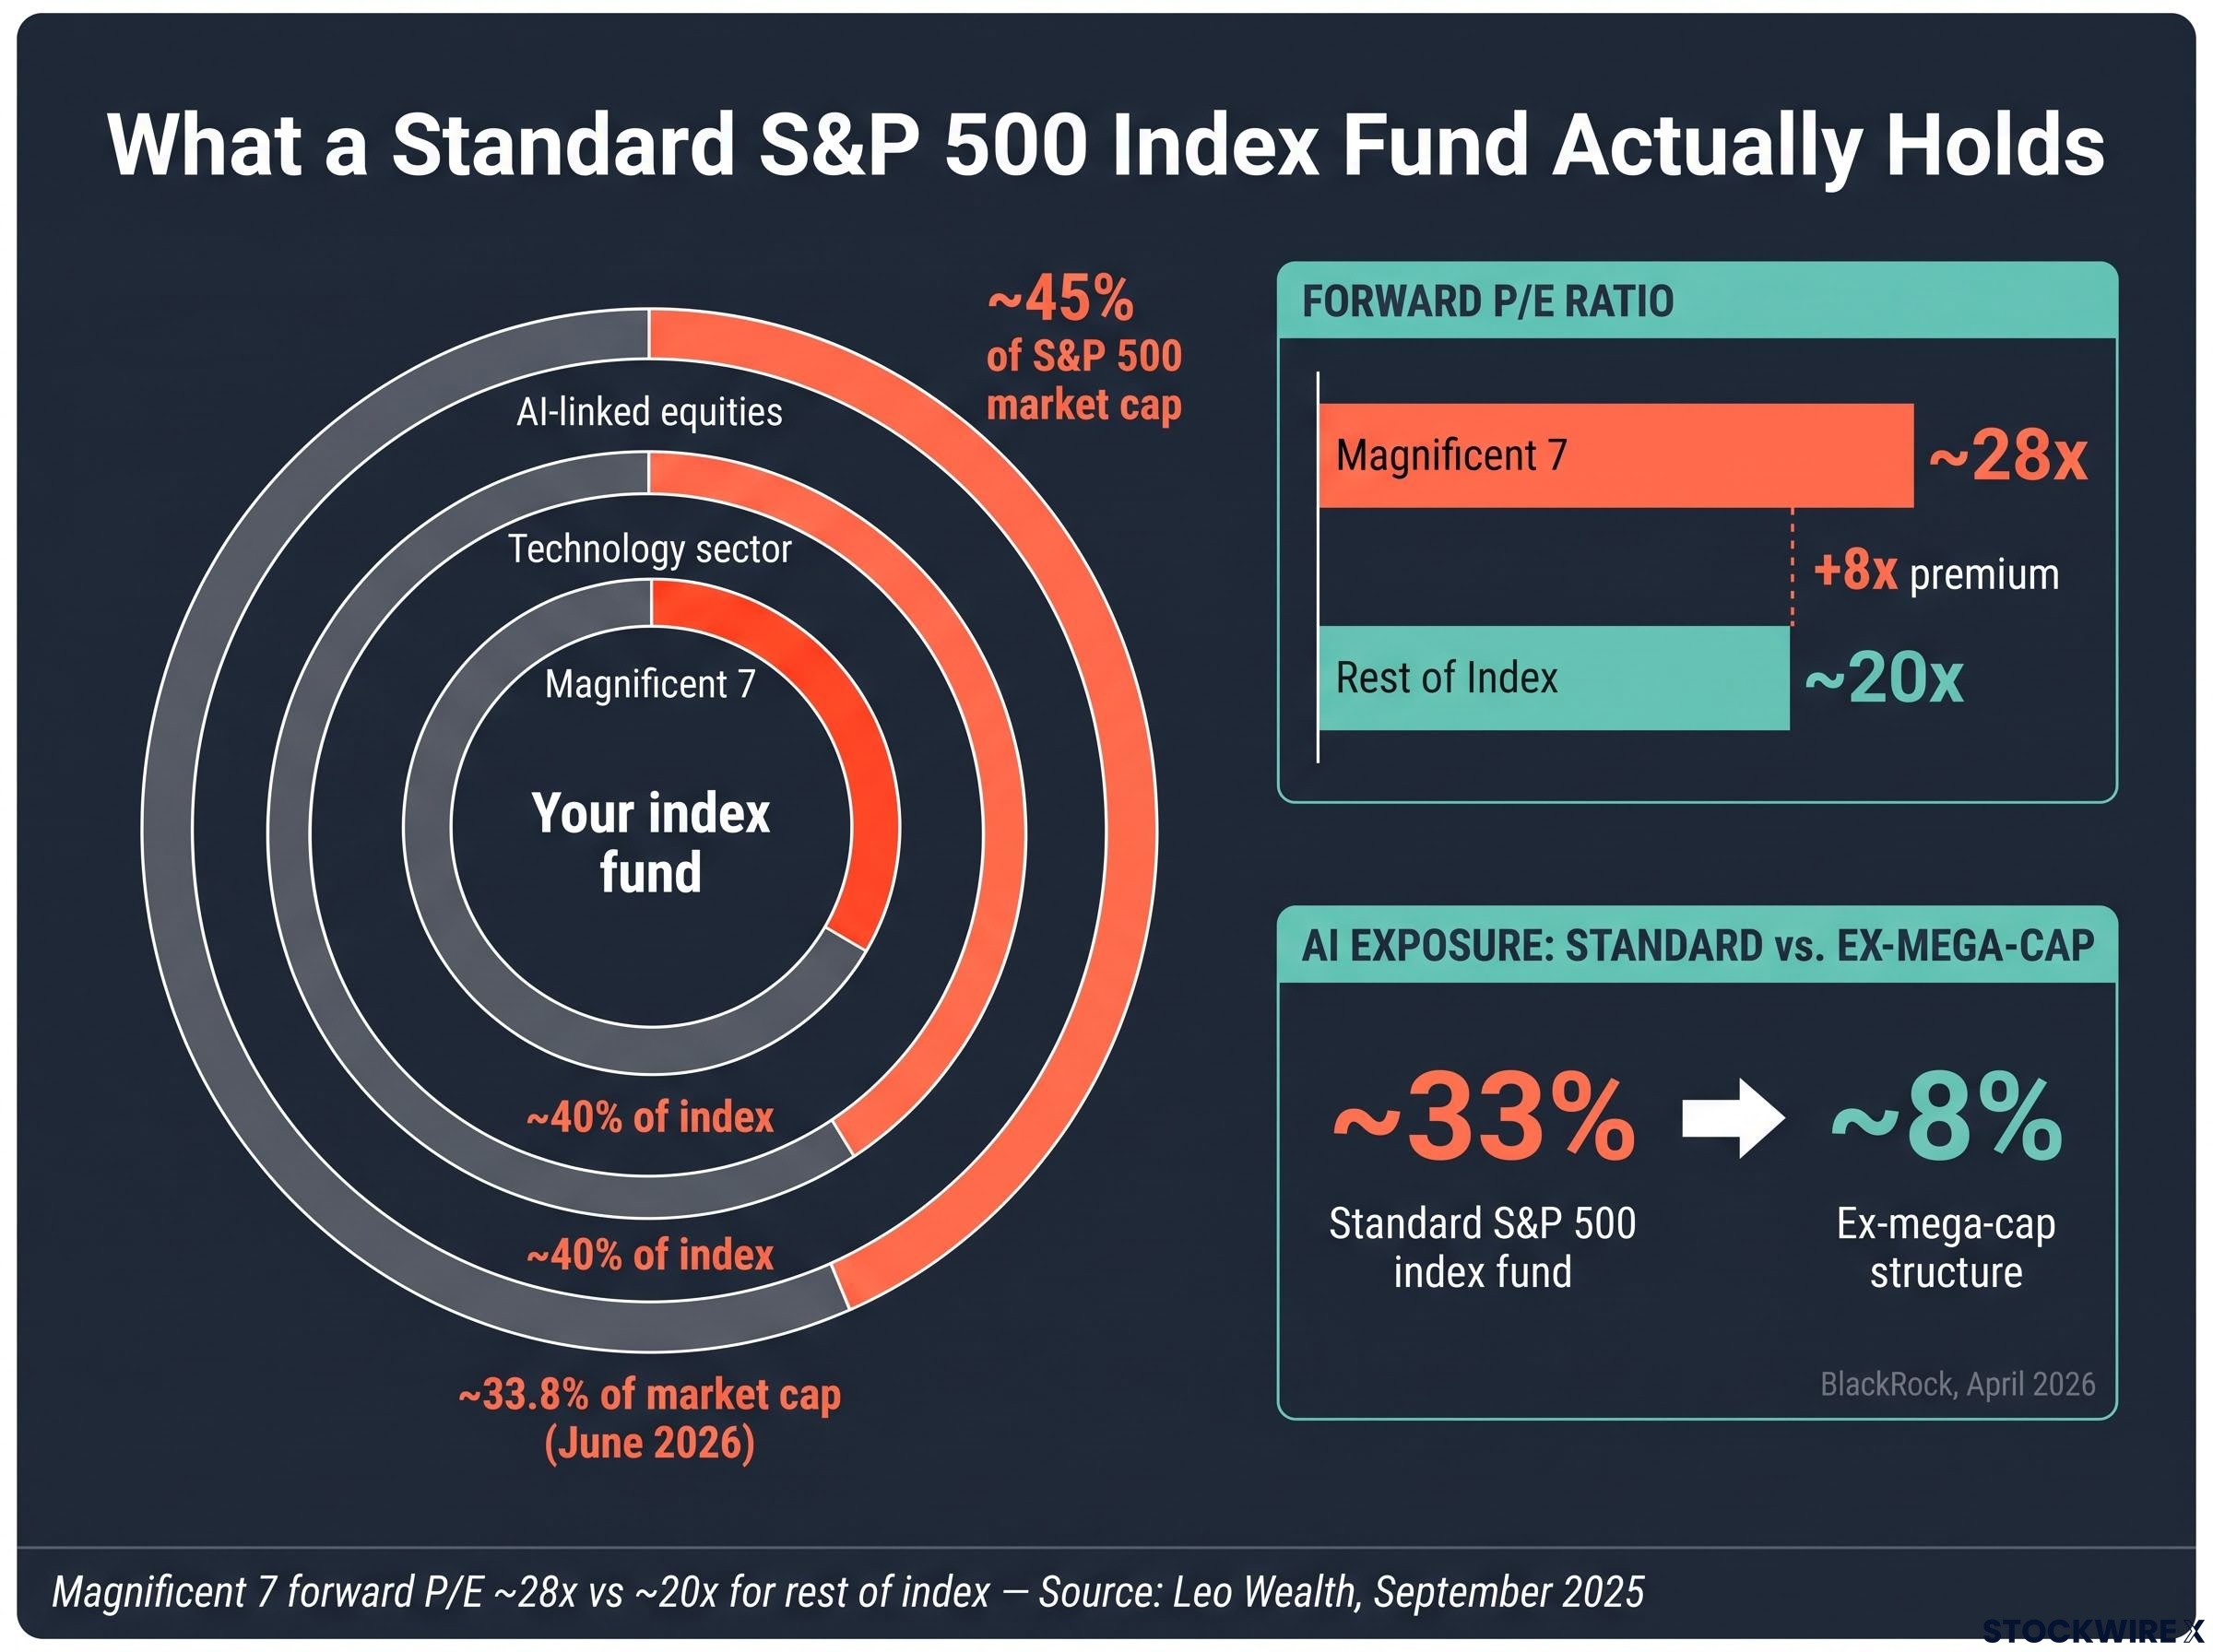
BlackRock, April 2026: An ex-mega-cap S&P 500 ETF can reduce AI exposure from roughly 33% down to about 8%, a structural way to stay in equities while cutting concentration risk.
How markets priced risk the last time the ERP went negative
The last time equities offered this little compensation over bonds was the tail of the dot-com bubble. Eulerpool’s commentary and Damodaran’s long-term series both place current levels as the lowest since roughly 2002. That parallel is instructive, but not for the reason most people assume.
It does not tell you a crash is coming. It tells you how long a structurally mispriced market can persist before anything forces a repricing.
The structural similarities are genuine. Index concentration then and now is comparable, with today’s AI and tech mega-caps at 33% to 45% of the S&P 500, matching or exceeding dot-com peak concentration. Both eras featured earnings yields sitting at or below Treasury yields, offering virtually no extra reward for equity risk. And both ran on narrative: the internet then, AI now, with valuations resting heavily on optimistic assumptions about future technological payoff.
| Characteristic | 1997 to 2000 | 2025 to 2026 |
|---|---|---|
| ERP level | At or below zero on earnings basis | Negative on simple spread; lowest since ~2002 |
| Index concentration | Tech at dot-com peak weighting | AI/tech at 33% to 45% of S&P 500 |
| Earnings quality of leaders | Largely speculative, many loss-making | Highly profitable, fortress balance sheets |
| Rate environment | Disinflationary, falling yields | Higher nominal and real yields |
Where today’s conditions genuinely differ from the dot-com era
The differences are real, and you should weigh them honestly. Today’s AI leaders are not speculative dreams. Apple, Microsoft, Nvidia and their peers generate enormous actual cash flows, not projected ones. That is a meaningful contrast with the loss-making internet firms of the late 1990s.
The rate environment is also inverted. The 1990s bull market ran on falling yields and disinflation. The current market is testing whether record AI-driven multiples can survive a sustained higher-for-longer rate regime.
But do not mistake these differences for safety. Profitability does not neutralise the premium risk. It changes its shape. If a repricing comes, it is more likely to be triggered by a rate shock than an earnings collapse, and a rate shock strikes faster and gives you less warning.
One more piece of historical discipline matters here. The premium was negative for roughly three years before the dot-com unwind. The signal was real, but its timing was genuinely unknowable, and investors who positioned defensively too early paid a real cost in missed returns.
For readers wanting to examine the dot-com comparison in more depth, our deep-dive into the Cisco parallel for AI investors shows how shareholders who were correct about the internet’s transformative impact still lost 80-90% of their capital for 25 years, a case study in why valuation entry point matters independently of technology thesis quality.
Who is most exposed and what the competing interpretations get wrong
Serious people disagree on what a negative premium means, and you finish better armed by understanding both camps than by being handed a verdict. That said, “this is complicated” is not the same as “this is fine.”
- The overvaluation signal camp. Firms including Eulerpool, Tickeron, TradingKey and Dorsey Wright read a negative premium as a straightforward warning.
- Eulerpool describes current conditions as the highest valuation relative to bonds since 2002.
- Tickeron argues equities now offer “zero risk-adjusted return over bonds,” a hallmark of a bubble.
- Dorsey Wright emphasises that when equities yield less than long Treasuries, the foundational case for holding high-valuation, long-duration assets weakens.
- The structural headwind camp. Damodaran and WisdomTree argue the picture is more nuanced than a sell button.
- Damodaran points out that the long-term historical average of about 5.44% carries a standard error of roughly 2.12%, making strict benchmarking against it unreliable.
- He argues implied premiums can stay structurally lower if growth expectations rise or investors simply demand less compensation for risk.
- WisdomTree frames the low premium as a “valuation headwind” rather than an imminent crash signal.
Institutional risk monitors sit somewhere in between. National Bank of Canada strategists warn that the market environment becomes increasingly difficult as the 30-year Treasury yield approaches or exceeds 5.5%, a specific level worth watching given it currently sits at 5.13%.
Bank of Canada Financial Stability Report, May 2026: The S&P 500 risk premium sat at the fifth-lowest percentile of its recent historical distribution, a precisely sourced, non-partisan assessment that stocks are offering unusually thin compensation for their risk.
Your practical question is not which camp wins the theoretical argument. It is how much duration and concentration risk your portfolio is carrying at a moment when the cushion between stocks and bonds has either vanished or shrunk to its smallest margin in two decades. Investors concentrated in passive S&P 500 funds or AI-themed ETFs carry more of both than those in globally diversified or ex-mega-cap structures. Understanding both interpretations protects you from false alarm and false comfort in equal measure.
Navigating a market where the risk cushion has thinned
The core takeaway is not a prediction. The negative or deeply compressed equity risk premium is a structural signal, not a timing tool, and what it tells you is that the margin of safety between stocks and bonds is near its lowest point in over 20 years. The S&P 500 earnings yield of roughly 3.9% against a 30-year Treasury at 5.13% produces a raw spread of about -1.2 percentage points. For the first time in two decades, the bond market is a genuine competitor to stocks for your long-term savings.
This does not mean a crash is imminent. It means the error bars on your expected equity returns have widened, and a larger share of your return depends on discount rates staying low than you may have realised.
Rather than react, watch. A handful of specific variables will tell you how this evolves:
- The 30-year Treasury yield relative to the 5.5% threshold flagged by National Bank of Canada.
- The direction of Magnificent 7 forward P/E multiples as yields move.
- Whether AI mega-cap earnings keep pace with the growth assumptions embedded in their valuations.
- The premium spread itself, tracked using one consistent methodology so you compare like with like.
The 30-year Treasury yield closed at 5.33% in August 2026, its highest since 2007, driven by a rising term premium and persistent fiscal deficit concerns rather than a short-term rate shock, meaning the competitive pressure on equity valuations embedded in that yield level reflects structural forces rather than a condition likely to reverse quickly.
The honest question to ask of your own holdings is simple: how much of your return expectation depends on rates staying low, and does your current allocation reflect that dependency? Tools such as BlackRock’s ex-mega-cap approach exist for investors who want to trim AI duration exposure without leaving equities entirely.
This article is for informational purposes only and should not be considered financial advice. Investors should conduct their own research and consult with financial professionals before making investment decisions. Past performance does not guarantee future results, and financial projections are subject to market conditions and various risk factors.