For decades, the Dow Jones Industrial Average was how Americans described what “the market” did on any given day. Then, gradually, the S&P 500 displaced it. No one announced the transition. No regulator mandated it. The Dow simply stopped reflecting the economy’s centre of gravity, and the S&P 500 stepped in because its composition told a more accurate story.
A comparable shift may now be underway, and most investors have not consciously registered it happening. If your portfolio is concentrated in AI and growth names, the index you instinctively call “the market” may already be wrong.
How you define your benchmark shapes what you buy, how you measure yourself, and what risk you believe you are taking. Here is a framework for determining which benchmark actually reflects your exposure, what that choice means for managing risk, and why the answer matters more in an AI-driven cycle than it has in any prior market regime.
From the Dow to the S&P 500 to NASDAQ: how benchmark transitions actually happen
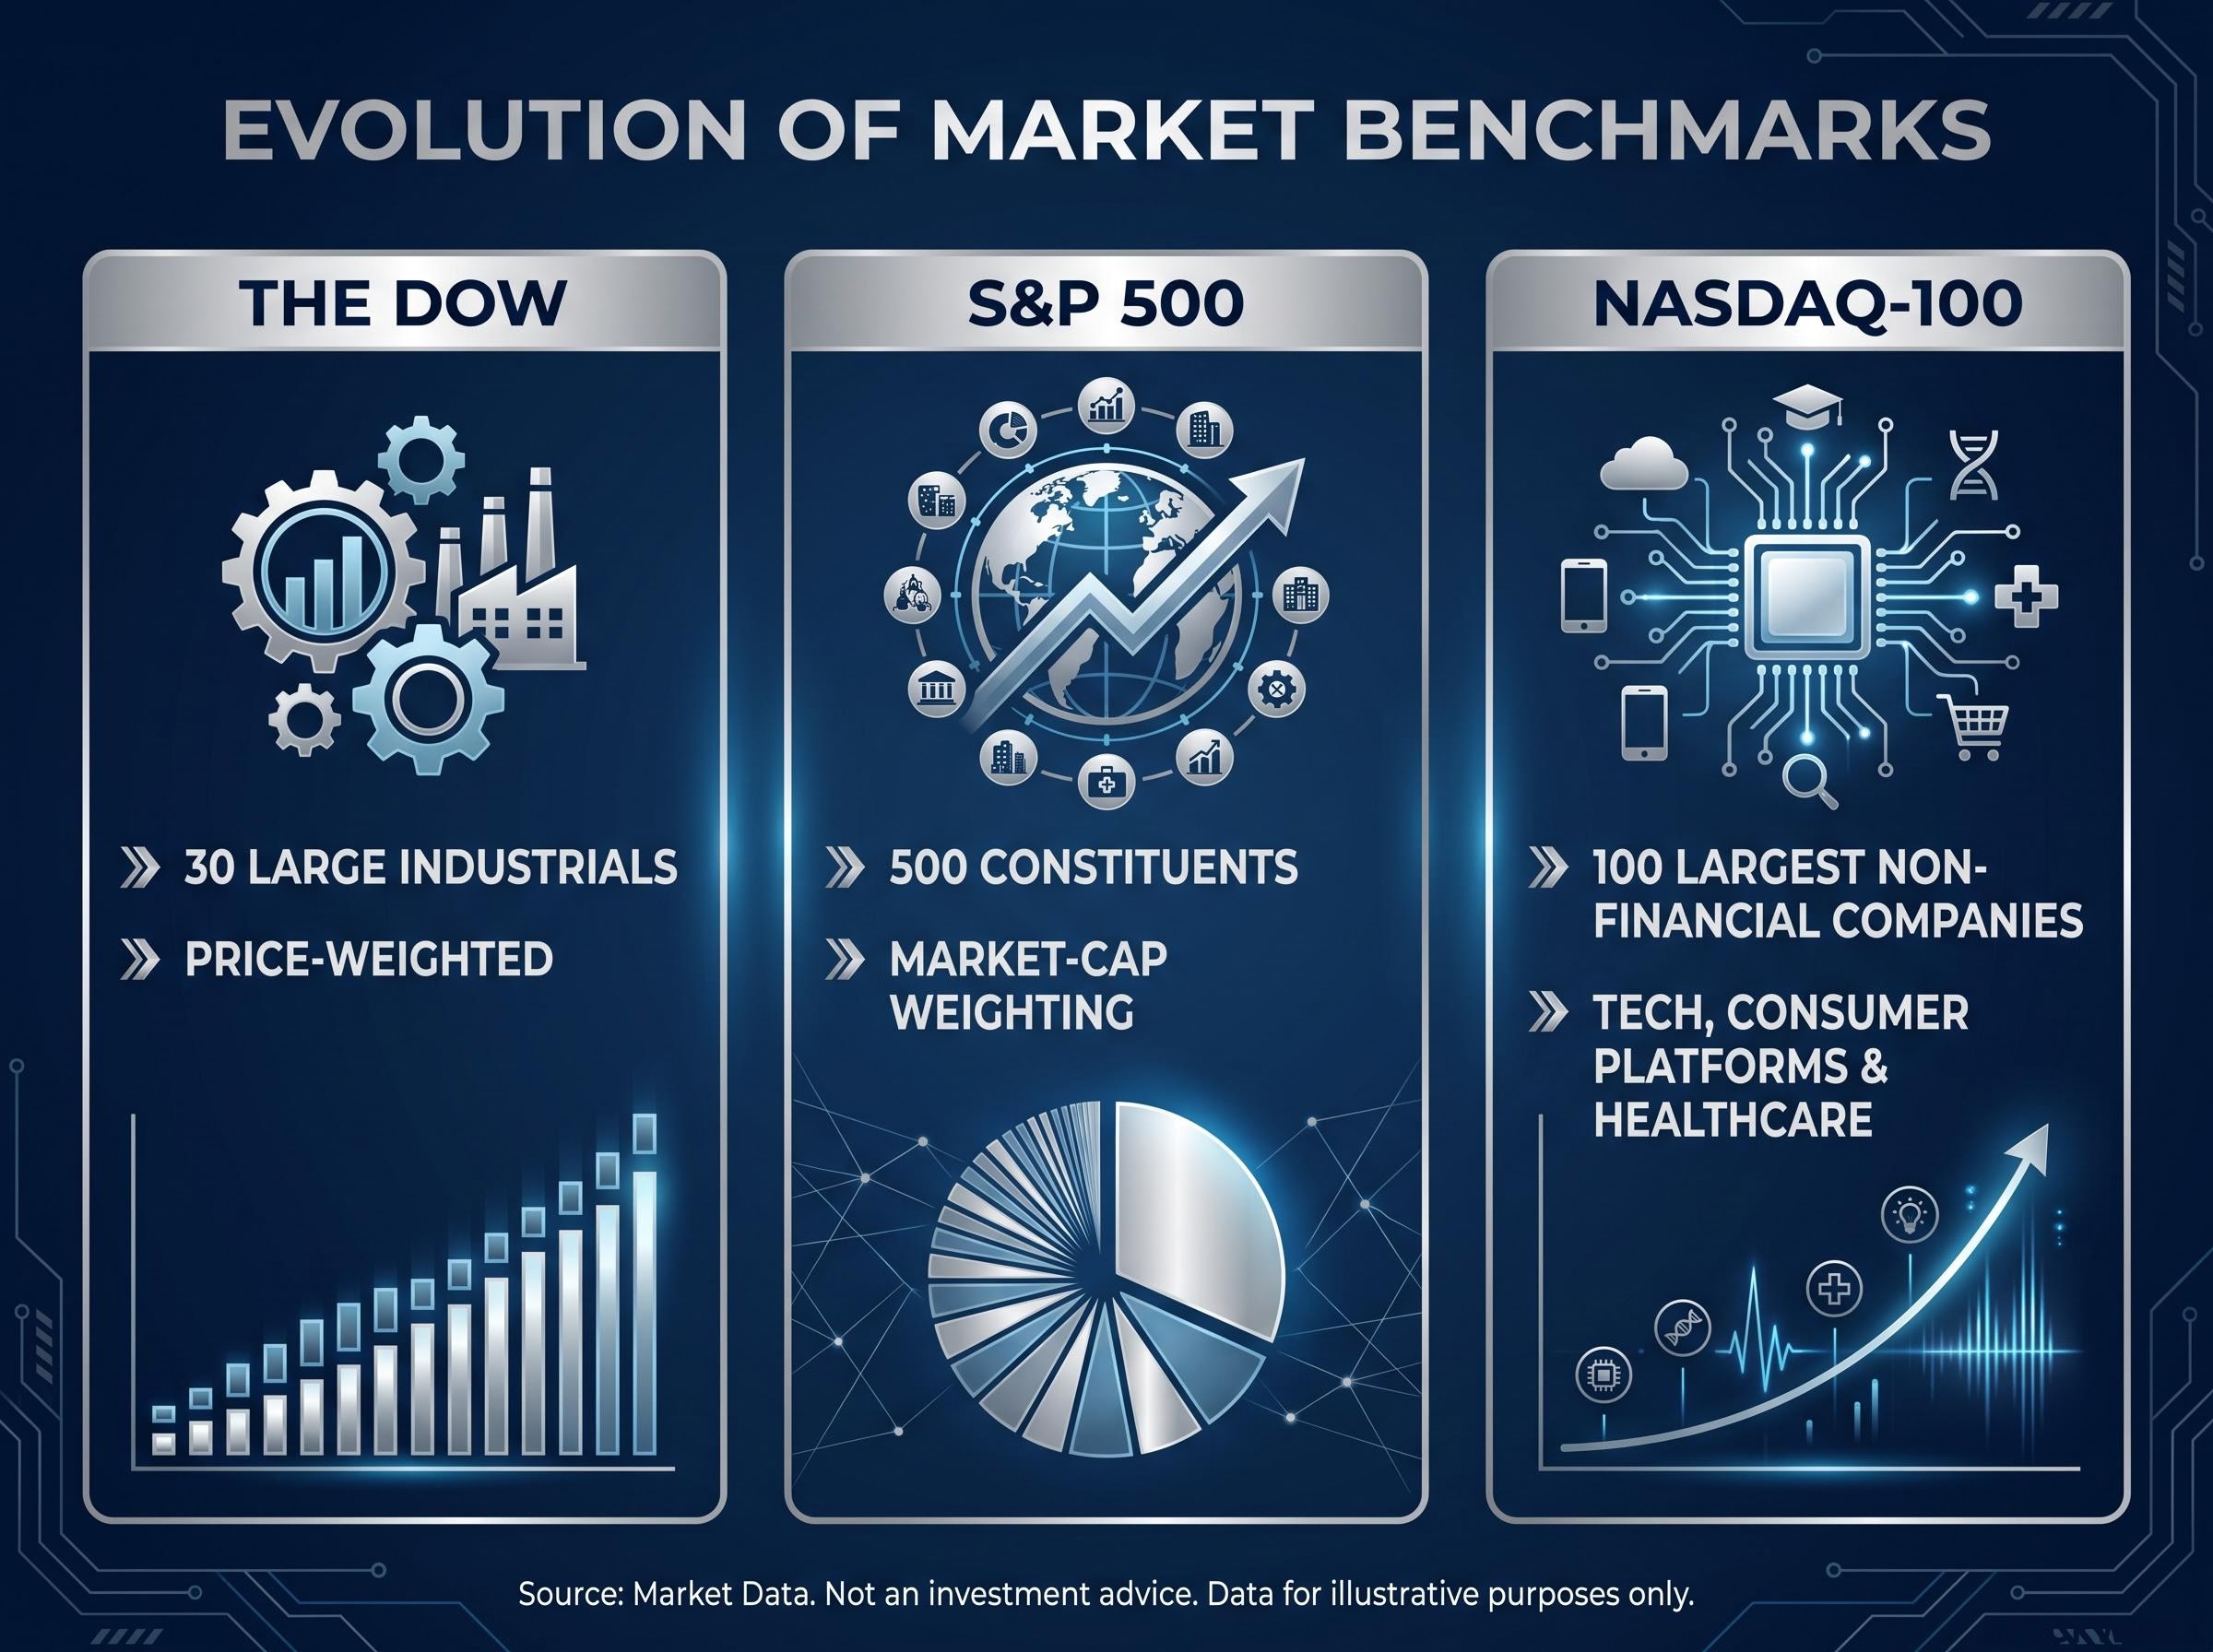
The Dow’s decline as the dominant benchmark was not sudden. It was compositional. The Dow tracked 30 large industrials, price-weighted, in an economy that was becoming services-driven, technology-heavy, and far more complex than 30 names could represent. The S&P 500, with 500 constituents across every major sector and a market-cap weighting methodology, simply matched the economy better. Fund managers started measuring themselves against it. Media followed. The transition was slow, partial, and contested, which is precisely why most market participants missed it while it was occurring.
The Dow’s price-weighted structure amplifies moves in a handful of high-priced stocks rather than reflecting the economy’s actual composition, which is precisely why institutional investors at firms like Morgan Stanley and J.P. Morgan shifted to the S&P 500 as their primary U.S. economic proxy long before the current AI cycle began.
That pattern is repeating. The conversation about earnings growth, innovation, and AI-driven value creation is gravitating toward one index. Not the full NASDAQ exchange, which lists thousands of companies, but a specific vehicle sitting inside it.
Why the Nasdaq-100 specifically, not NASDAQ the exchange
When investors and media say “NASDAQ,” they almost always mean the Nasdaq-100: the 100 largest non-financial companies listed on the exchange, heavily concentrated in technology and growth. It is the Nasdaq-100 that underpins the ecosystem of ETFs, futures, and options with hundreds of billions of dollars in tracking assets. It is the Nasdaq-100 that functions as the benchmark vehicle.
The Nasdaq-100 index methodology updates introduced in 2026 refined Fast Entry eligibility rules and the weighting methodology while eliminating the minimum float requirement, changes that further sharpen the index’s profile as a benchmark for the 100 largest non-financial companies listed on the exchange.
The characteristics that separate it from the S&P 500 matter for how you interpret performance:
- Sector tilt: The Nasdaq-100 has substantially higher technology and growth exposure than the S&P 500, with its top 10 constituents accounting for a disproportionately large share of index weight
- Composition: Excludes financials entirely, concentrating the index in the sectors driving the current AI cycle: technology, consumer platforms, and healthcare
- Derivatives ecosystem: Hundreds of linked products, including some of the most actively traded futures and options contracts in the world
- Long-term return profile: Materially higher average annual returns than the S&P 500 over the past decade-plus, but with commensurately higher volatility
The benchmark handoff is partial. The S&P 500 retains dominance for broad asset allocation, and no institution has formally abandoned it. But for investors whose portfolios are concentrated in AI and growth, the Nasdaq-100 increasingly defines the scoreboard they are actually playing on. Using the wrong one means measuring yourself against exposures you do not hold.
When big ASX news breaks, our subscribers know first
AI earnings as the mechanism cementing NASDAQ’s benchmark role
AI has not lifted all NASDAQ boats equally, and that discrimination is what gives the index its signal quality.
The market is sorting companies within the Nasdaq-100 with unusual precision: firms that can demonstrate near-term financial returns from AI, whether through revenue growth, margin expansion, or measurable competitive advantage, are being rewarded disproportionately. Those investing heavily in AI without demonstrable monetisation have seen their stocks underperform or decline. Companies that cannot show investors a convincing path to covering their capital expenditure commitments have faced sustained share price pressure, and that test has become the defining filter of the current earnings cycle.
That selectivity has turned NASDAQ earnings season into something closer to a quarterly audit of the AI economy’s profit-and-loss statement.
Nvidia’s revenue has been described as approximating roughly $1 billion per day at current run rates, a figure that anchors the sheer scale of AI hardware demand.
The recent results illustrate the pattern clearly:
| Company | Earnings outcome | AI-related signal | Market reaction |
|---|---|---|---|
| Nvidia | Strong beat | Revenue run rate ~$1B/day | Sharply higher on release |
| Salesforce | Impressive beat | AI software monetisation validated | Continued significant climb |
| Dell | Catalyst potential (pre-earnings) | AI infrastructure positioning | Up ~2.5% ahead of release |
| Broadcom (AVGO) | Catalyst potential | Custom AI chip demand | Viewed as next NASDAQ leg driver |
These assessments are attributed to Brent Kachuba, founder of Spot Gamma, with corroboration from Errol Coleman, described as present at the CBOE.
Salesforce’s results are particularly telling. AI-related software companies are demonstrating that revenues can be generated from AI beyond hardware providers alone. The market is rewarding proof of monetisation, not just narrative.
The AI infrastructure ROI test has a harder quantitative framing than most earnings commentary acknowledges: BCA Research places the annual revenue AI infrastructure must generate at roughly $10 trillion, a threshold JPMorgan’s 2030 revenue projections fall several multiples short of, making ROIC trend the metric that determines whether current capex commitments are justified.
What this means for you: if you hold a broad “tech” or “AI” position, sector exposure alone is no longer sufficient. The earnings selectivity pattern means you need to know which of your holdings are on the right side of that ROI test. Earnings calls have become credibility audits, not just revenue updates, and treating them as such gives you a structurally better framework for holding versus trimming.
What the options market reveals that price charts do not
Price is only one signal. The derivatives market provides a second, and for NASDAQ, it currently tells a story that price charts alone cannot.
Three structural characteristics of current NASDAQ options activity frame the picture:
- Approximately 82% of NASDAQ options open interest has a tenor of five days or fewer, according to Brent Kachuba of Spot Gamma
- VXN (the Nasdaq-100’s implied volatility measure, which captures how much future price movement options traders expect) is near annual lows
- During the May-to-June period, semiconductor and memory stocks rallied sharply while implied volatility climbed in tandem, an atypical configuration in which options pricing moved in the same direction as price rather than declining as it normally would
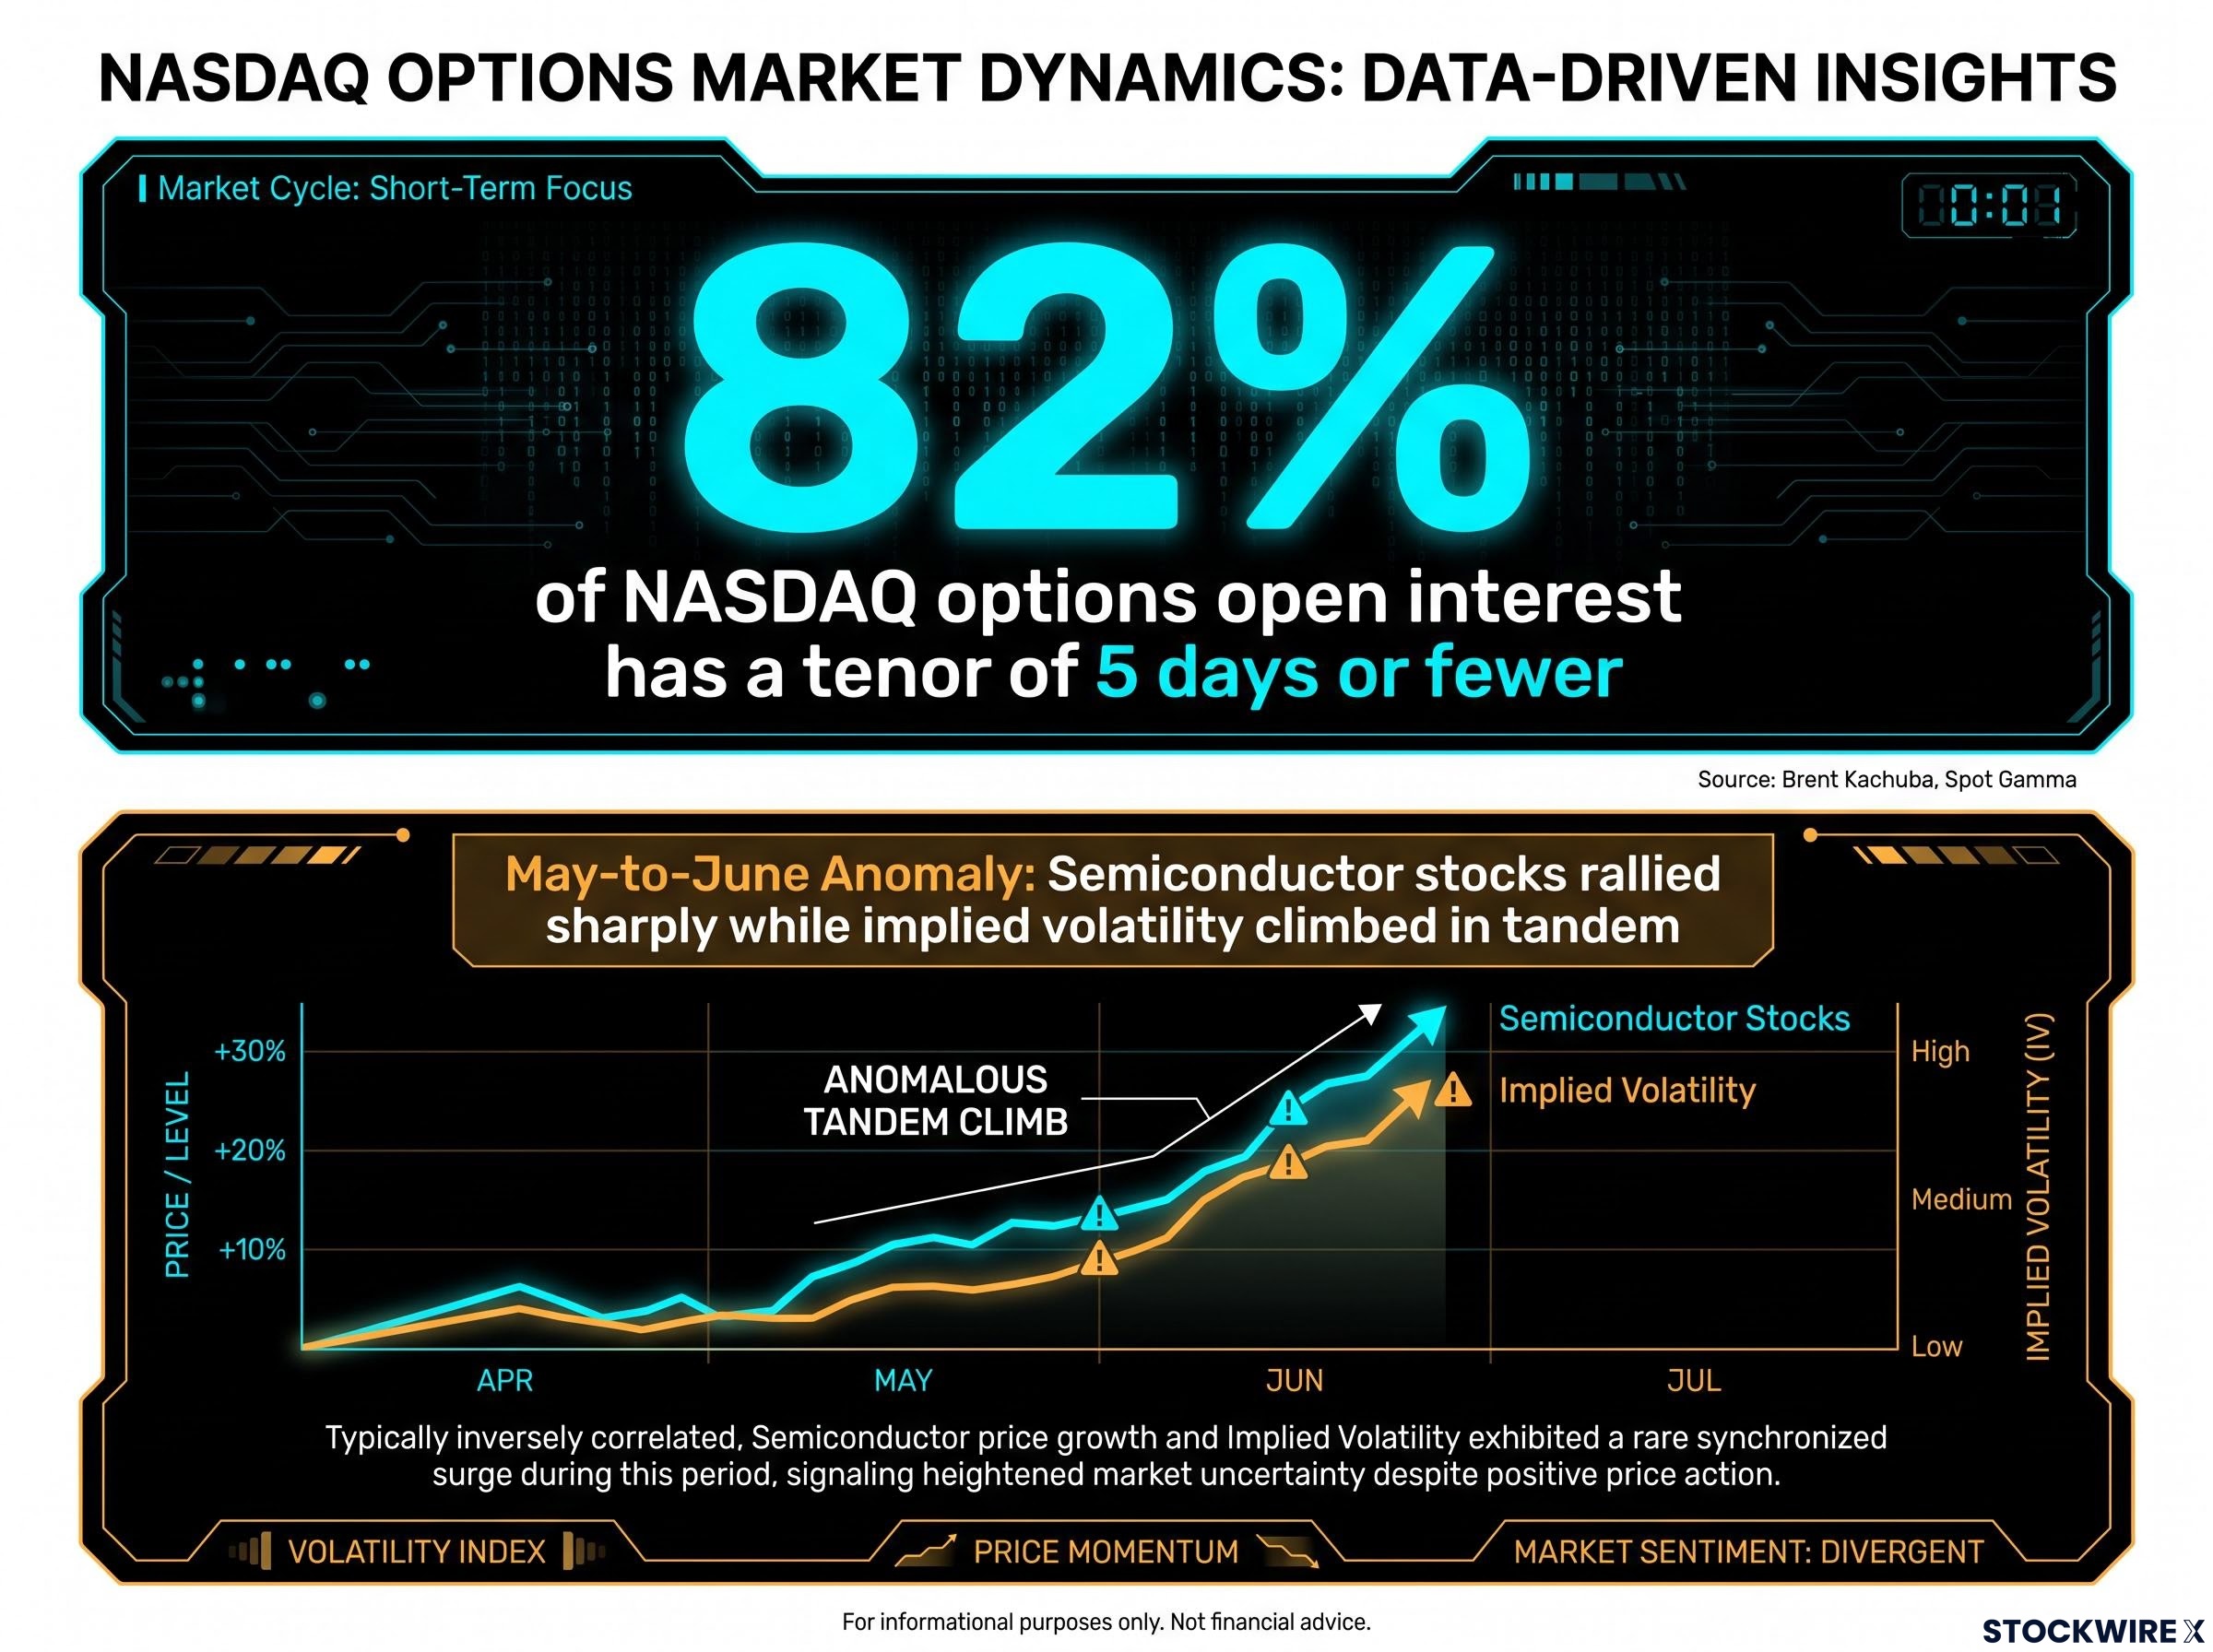
Roughly 82% of NASDAQ options open interest sits in contracts expiring within five days. That concentration in ultra-short-dated expirations means intraday hedging flows can dominate NASDAQ price action on any given day, creating the “air pockets” and sharp intraday swings that long-term AI investors experience as unexplained noise.
Earlier in the year, the VXN-VIX spread widened considerably, reflecting a period when NASDAQ-specific fear priced in substantially more disruption than the broader S&P 500. During the May-to-June semiconductor rally, chip and memory names pushed higher and, in an uncommon pattern, NASDAQ implied volatility climbed alongside them rather than easing. When those stocks subsequently pulled back, VXN declined in step, and the premium that had opened up between the two indices largely closed.
That compression is significant. When NASDAQ-specific fear falls back to S&P-like levels, the derivatives market is telling you something: NASDAQ has stopped trading as an outlier risk and is being re-coupled to macro conditions. Investor focus has shifted back toward interest rates and economic data as the primary drivers of sentiment, which is itself the behaviour you would expect from a benchmark index rather than a concentrated sector play.
When low volatility becomes the risk, not the signal
With VXN near annual lows, the instinct is to read low volatility as a green light. The opposite logic applies.
Low implied volatility means the options market is not pricing much disruption in advance. Protection is relatively inexpensive compared with past spikes. That is precisely the environment in which earnings surprises, policy shifts, or AI-related disappointments can produce sharp repricings, because the cushion has been removed.
For you, particularly if you are holding large unrealised NASDAQ gains, this is the environment in which hedging is cheapest and therefore most worth considering before a catalyst event. Waiting until volatility spikes to buy protection means paying the premium after the market has already priced the risk.
Options chain signals such as implied volatility rank, put-to-call skew, and expected-move brackets apply the same logic at the individual stock level that VXN applies to the Nasdaq-100 as a whole, giving investors a way to calibrate position sizing around specific AI earnings catalysts rather than relying on index-level readings alone.
Five decisions that change when NASDAQ becomes your operating benchmark
Not every investor needs to make this shift. If your goal is broad U.S. economic exposure across sectors, financials, healthcare, industrials, and consumer staples included, the S&P 500 remains the correct benchmark. The question is for the growing population of investors whose portfolios are concentrated in AI-driven growth. For them, five specific decisions change:
- Benchmark selection: Measure your performance against the Nasdaq-100, not the S&P 500. A portfolio concentrated in AI names that “beats the S&P” but trails the Nasdaq-100 has not actually outperformed its relevant opportunity set.
- Performance measurement: Accept that higher returns come with higher volatility. The Nasdaq-100’s long-term outperformance over the S&P 500 has been delivered at materially higher drawdowns. Your risk tolerance needs to match the benchmark you choose.
- Stock selectivity: Outperformance depends more on which AI names you own and how you size them than on simply being overweight technology. Sector exposure is the starting point; ROI discrimination is where alpha lives.
- Volatility management: Use NASDAQ-linked implied volatility (VXN) as a timing tool for hedging decisions. When VXN is near lows, consider relatively inexpensive put protection or collars, especially around AI earnings clusters. Size positions so you can withstand the short-dated options noise without being forced to sell at the wrong time.
- Treatment of major AI IPO events: Treat large AI listings not as single-stock decisions but as market-wide referendums on AI valuation and institutional appetite.
Major AI IPOs as regime tests, not just single-stock events
Anthropic has confidentially filed its S-1, though the IPO has not yet been completed. Early projections from the original source discussion, attributed to Brent Kachuba and corroborated by Errol Coleman, suggested an October timing and a NASDAQ listing. Investors should verify the current status independently before publication.
Regardless of exact timing, the anticipated listing illustrates a structural point. Major AI companies are expected to list on the NASDAQ, reinforcing its position as the primary venue for AI-era price discovery. A strong reception for a company of Anthropic’s scale would validate AI valuations and deepen NASDAQ’s benchmark role. A weak reception would be an early signal that expectations may be running ahead of demonstrated fundamentals.
NASDAQ’s structural position as the expected home for these listings is itself evidence of its benchmark consolidation.
This article is for informational purposes only and should not be considered financial advice. Investors should conduct their own research and consult with financial professionals before making investment decisions.
These statements are speculative and subject to change based on market developments and company performance.
What the benchmark shift has settled, and what it has not
The structural case is credible. NASDAQ’s compositional tilt toward AI and growth, the earnings discrimination between AI spenders and AI earners, the depth of its derivatives ecosystem, and its pipeline as the listing venue for major AI companies collectively support its status as the operating benchmark for growth-focused investors.
What remains genuinely contested is durability. The S&P 500 retains institutional dominance for broad benchmarking, and a sustained AI monetisation shortfall or a macro shock could compress the gap between the two indices rather than widen it. This transition is partial, not settled.
The AI valuation frameworks that matter most for NASDAQ concentration risk deliver split verdicts: the Shiller CAPE at 40.11 and a Minsky-stage classification of major hyperscalers as speculative rather than Ponzi-level financing both inform how durable the current earnings-driven benchmark shift is likely to be.
NASDAQ is no longer just a sector bet; it is becoming the core expression of the AI economy.
The single most actionable conclusion is simpler than the analysis behind it: know which benchmark you are actually measured against. If your portfolio is concentrated in AI-driven growth, the Nasdaq-100 is likely your real scoreboard. Once you accept that, the downstream decisions about selectivity, hedging, and how you interpret earnings results follow with greater clarity. The benchmark question comes first. Everything else is a consequence of getting that answer right.