The investor who bought Cisco in March 2000 was not a fool. They understood, correctly, that the internet would reshape civilisation. Their read on the technology was right. Their portfolio lost 80-90% of its value anyway.
That contradiction is not a quirk of the 1990s. It is a structural pattern in how markets price civilisational shifts, and the same tension is live in AI stocks today. The Magnificent Seven now represent approximately 32% of the S&P 500’s total weight. If you hold a broad index fund, you already own this bet whether you sized it deliberately or not.
Here is a framework for separating genuine conviction about AI as a technology from the harder, less comfortable question of whether today’s prices reflect that conviction fairly, and what the answer means for your specific time horizon.
Why being right about a technology has never been enough
Every major technological transition in the past two centuries has followed a version of the same script. The technology transforms the economy as predicted. Early equity holders suffer anyway. The companies that ultimately capture the most value over 10-20 years frequently look nothing like the consensus winners at the peak of enthusiasm.
The pattern is remarkably consistent across eras:
- Railroads: Transformed commerce and geography as promised, but early railroad equity holders endured repeated boom-bust cycles, bankruptcies, and dilution that destroyed most of the capital committed at peak optimism.
- Electrification: Rewired industrial production exactly as forecasted, yet the dominant utilities and equipment makers of the early boom were largely displaced or restructured by the time the technology matured.
- The internet: Delivered on every prediction about connectivity and commerce, while early investors in consensus “can’t lose” names absorbed catastrophic losses and, in two prominent cases, total destruction.
Felix Breen, a director affiliated with Berkshire Hathaway, has cautioned investors to examine who actually won from the internet era before assuming current AI leaders are safe bets. The caution is well placed. The companies that captured most of the internet’s long-term value, Google, Amazon, Facebook, either barely existed or had not yet been founded when the dot-com peak arrived in 2000.
Carlota Perez’s framework for technological revolutions, which identifies recurring four-phase cycles of irruption, frenzy, synergy, and maturity across five major technology transitions over the past two centuries, provides the structural model underlying this pattern: financial capital floods in during the frenzy phase, peak valuations arrive before productive capital fully deploys, and the companies capturing the most long-term value often emerge only in the synergy phase that follows.
The Magnificent Seven currently command approximately 32% of the S&P 500’s total weight. That concentration means conviction about AI’s importance says almost nothing reliable about which specific companies, at which specific prices, will generate strong returns for investors buying today. The market’s enthusiasm for a transformative technology is not evidence of mispricing by fools. It is a recurring structural feature, which means the same trap is available to sophisticated, well-informed investors right now.
When big ASX news breaks, our subscribers know first
The Cisco lesson: 25 years of dead money from a perfect investment thesis
Cisco was the consensus winner of the early internet. Widely regarded as the backbone provider for a connected world, it was the stock you could not lose on. The numbers that followed tell a different story.
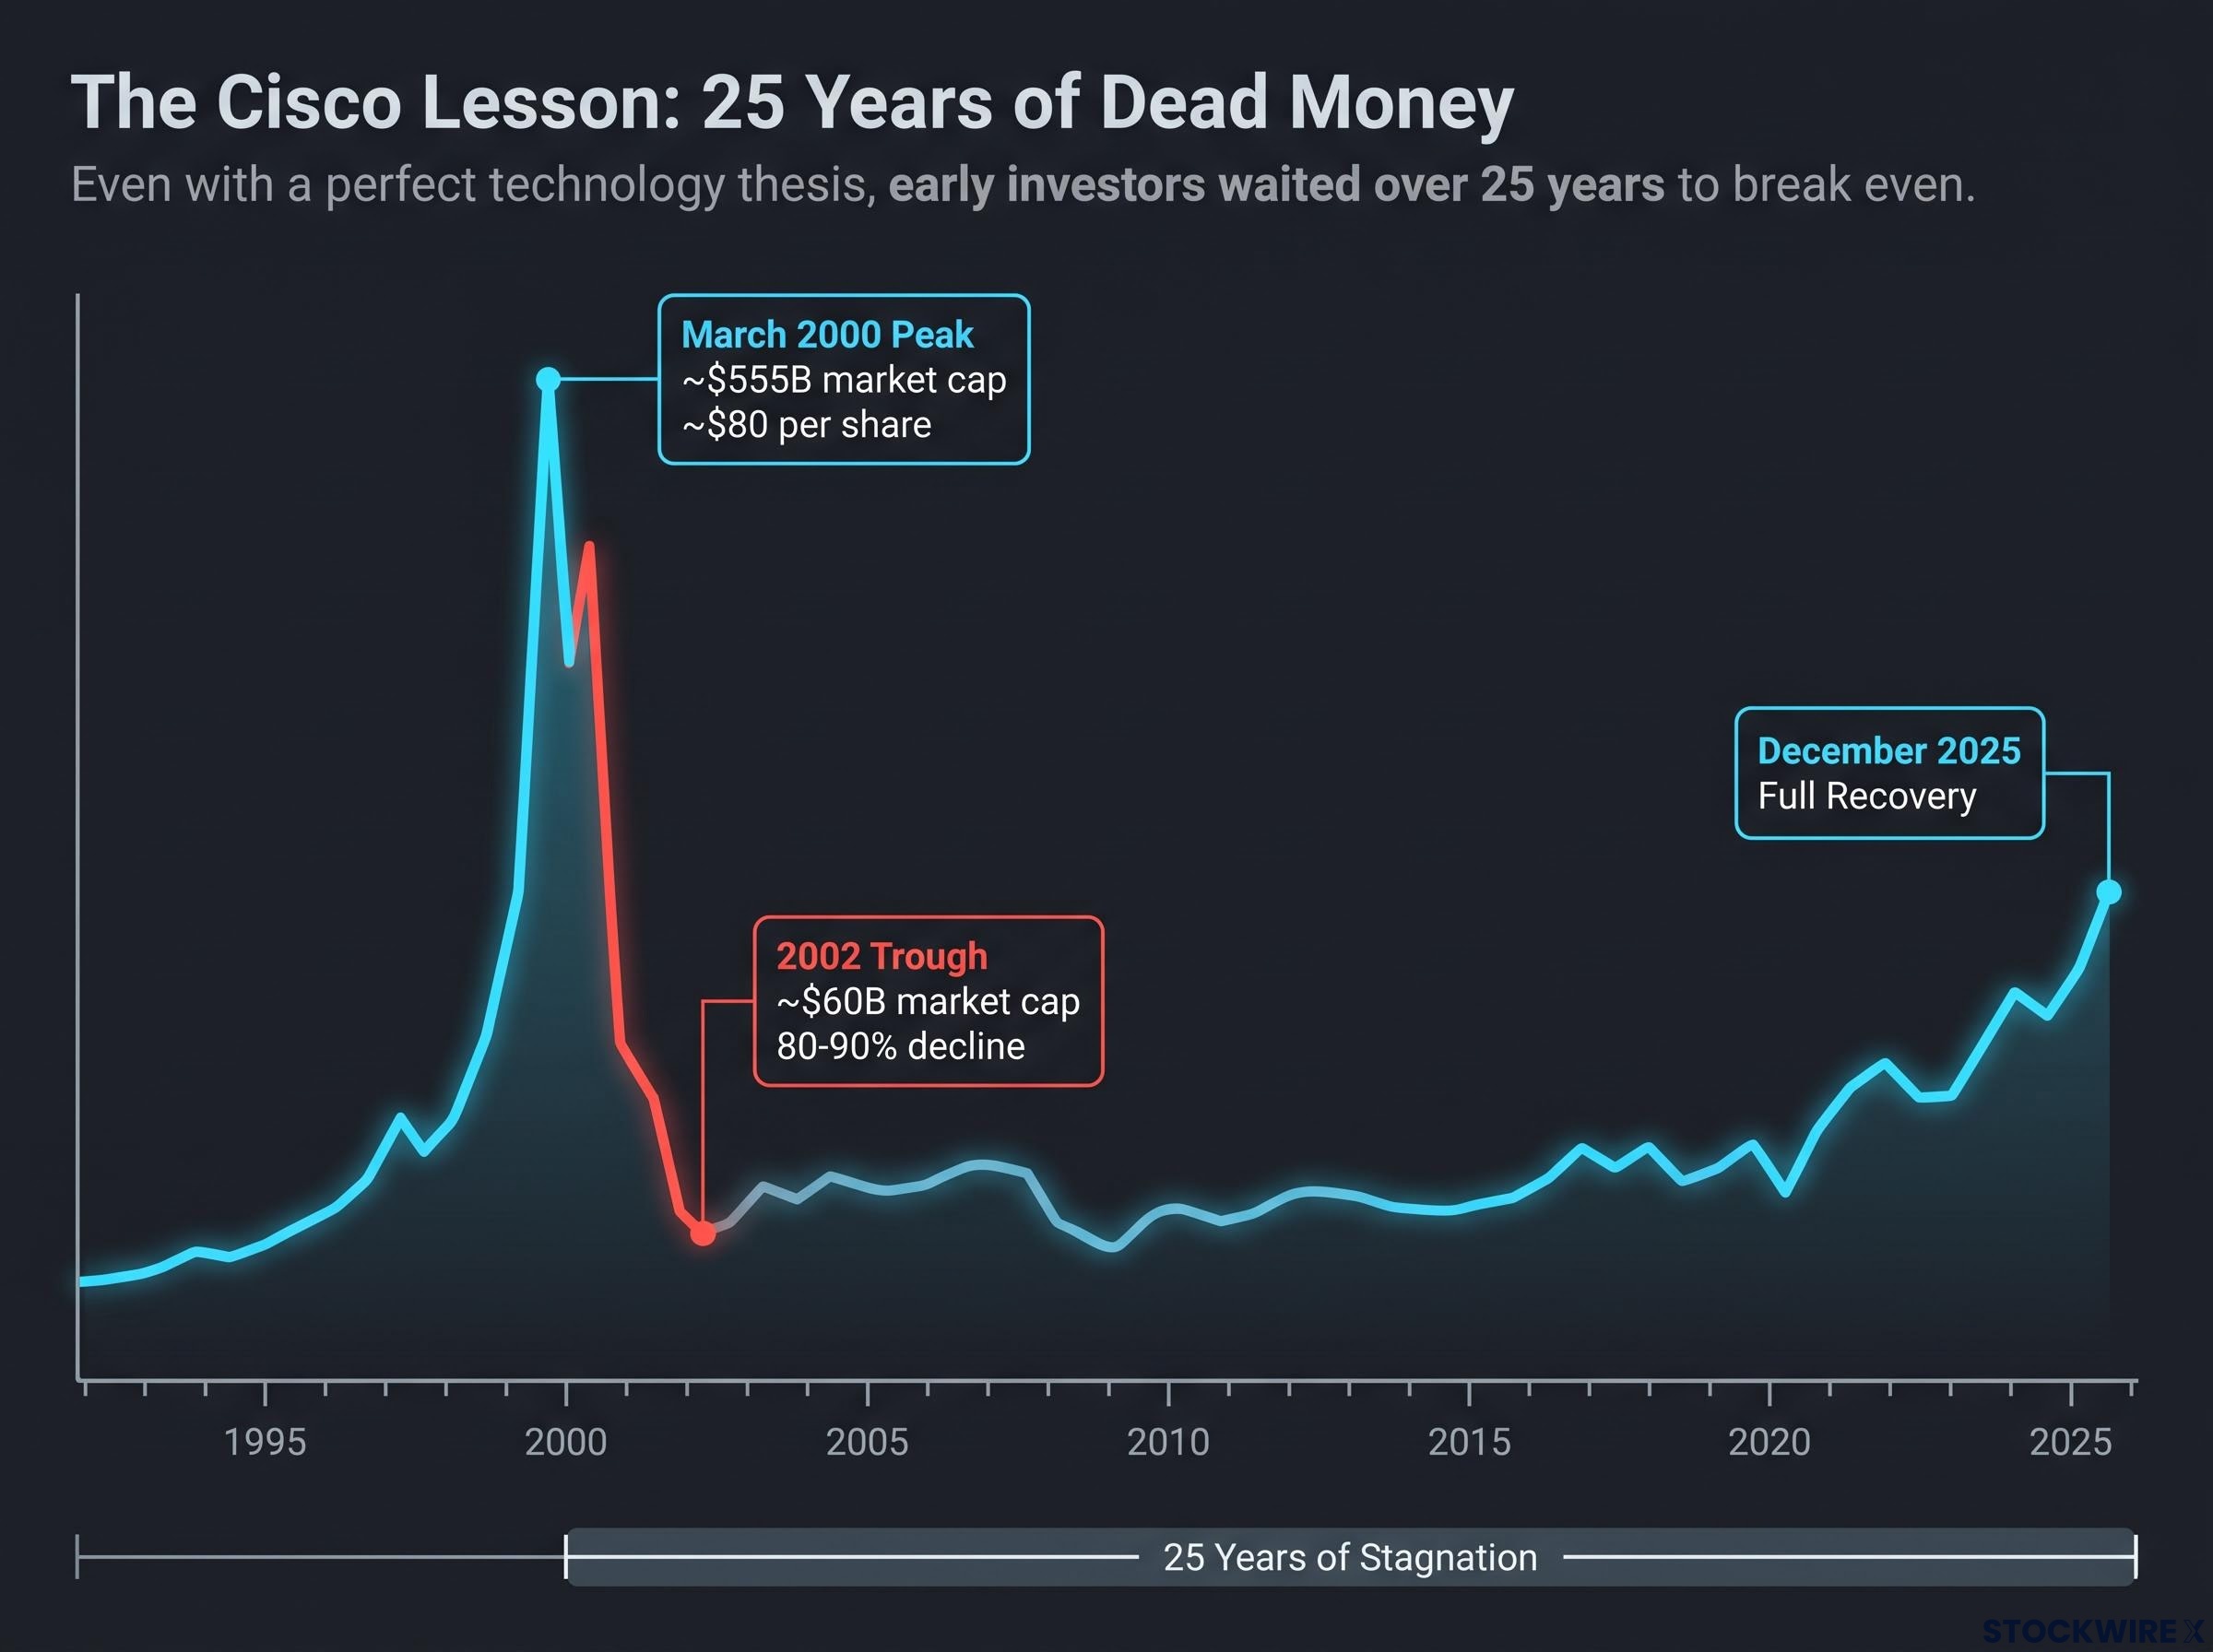
Cisco peaked at a split-adjusted price of approximately $80 per share in March 2000, with a market capitalisation near $555 billion. By 2002, the market cap had collapsed to roughly $60 billion, a peak-to-trough decline of approximately 80-90%. The stock did not surpass its March 2000 high until December 2025, more than 25 years later.
25 years of dead money. An investor who bought Cisco at its March 2000 peak waited more than a quarter century to break even, despite the internet reshaping civilisation exactly as they predicted.
Cisco was the best outcome in its cohort. Yahoo and AOL, the other two consensus “can’t lose” internet leaders, fared far worse.
| Company | Peak valuation context | Outcome by 2002 | Recovery timeline | Status of underlying technology |
|---|---|---|---|---|
| Cisco | ~$555B market cap, ~140-200× forward earnings | Market cap fell to ~$60B (80-90% decline) | 25+ years (December 2025) | Internet succeeded; company survived |
| Yahoo | Top-tier internet portal, consensus winner | Largely destroyed as independent entity | Never recovered | Internet succeeded; company did not |
| AOL | Dominant consumer internet brand | Largely destroyed post-merger collapse | Never recovered | Internet succeeded; company did not |
What the valuation showed that the narrative obscured
At its peak, Cisco traded at approximately 140-200 times forward earnings. Sources conflict on the precise figure, but the character of the multiple holds across all cited estimates: it was arithmetically self-defeating. Even assuming aggressive revenue growth of 20-25% annually, sustained for a decade, the compounding maths required to justify that entry price demanded conditions no company had ever delivered. The numbers were visible at the time to anyone who ran them. Most investors did not run them. The narrative was enough.
How AI valuations compare today, and where the honest worry lives
The comparison between today’s AI market and the dot-com peak is contested, and the honest version is more nuanced than either side typically allows.
On a pure-multiples basis, today’s numbers are materially lower than 2000 extremes. Leading 2000 tech names (Microsoft, Cisco, Intel, Oracle) traded at approximately 70 times two-year forward earnings at the dot-com peak. Today’s main AI hyperscalers trade at roughly 26 times forward earnings:
- Microsoft: approximately 26× forward earnings
- Alphabet: approximately 26× forward earnings
- Amazon: approximately 26× forward earnings
- Meta: approximately 26× forward earnings
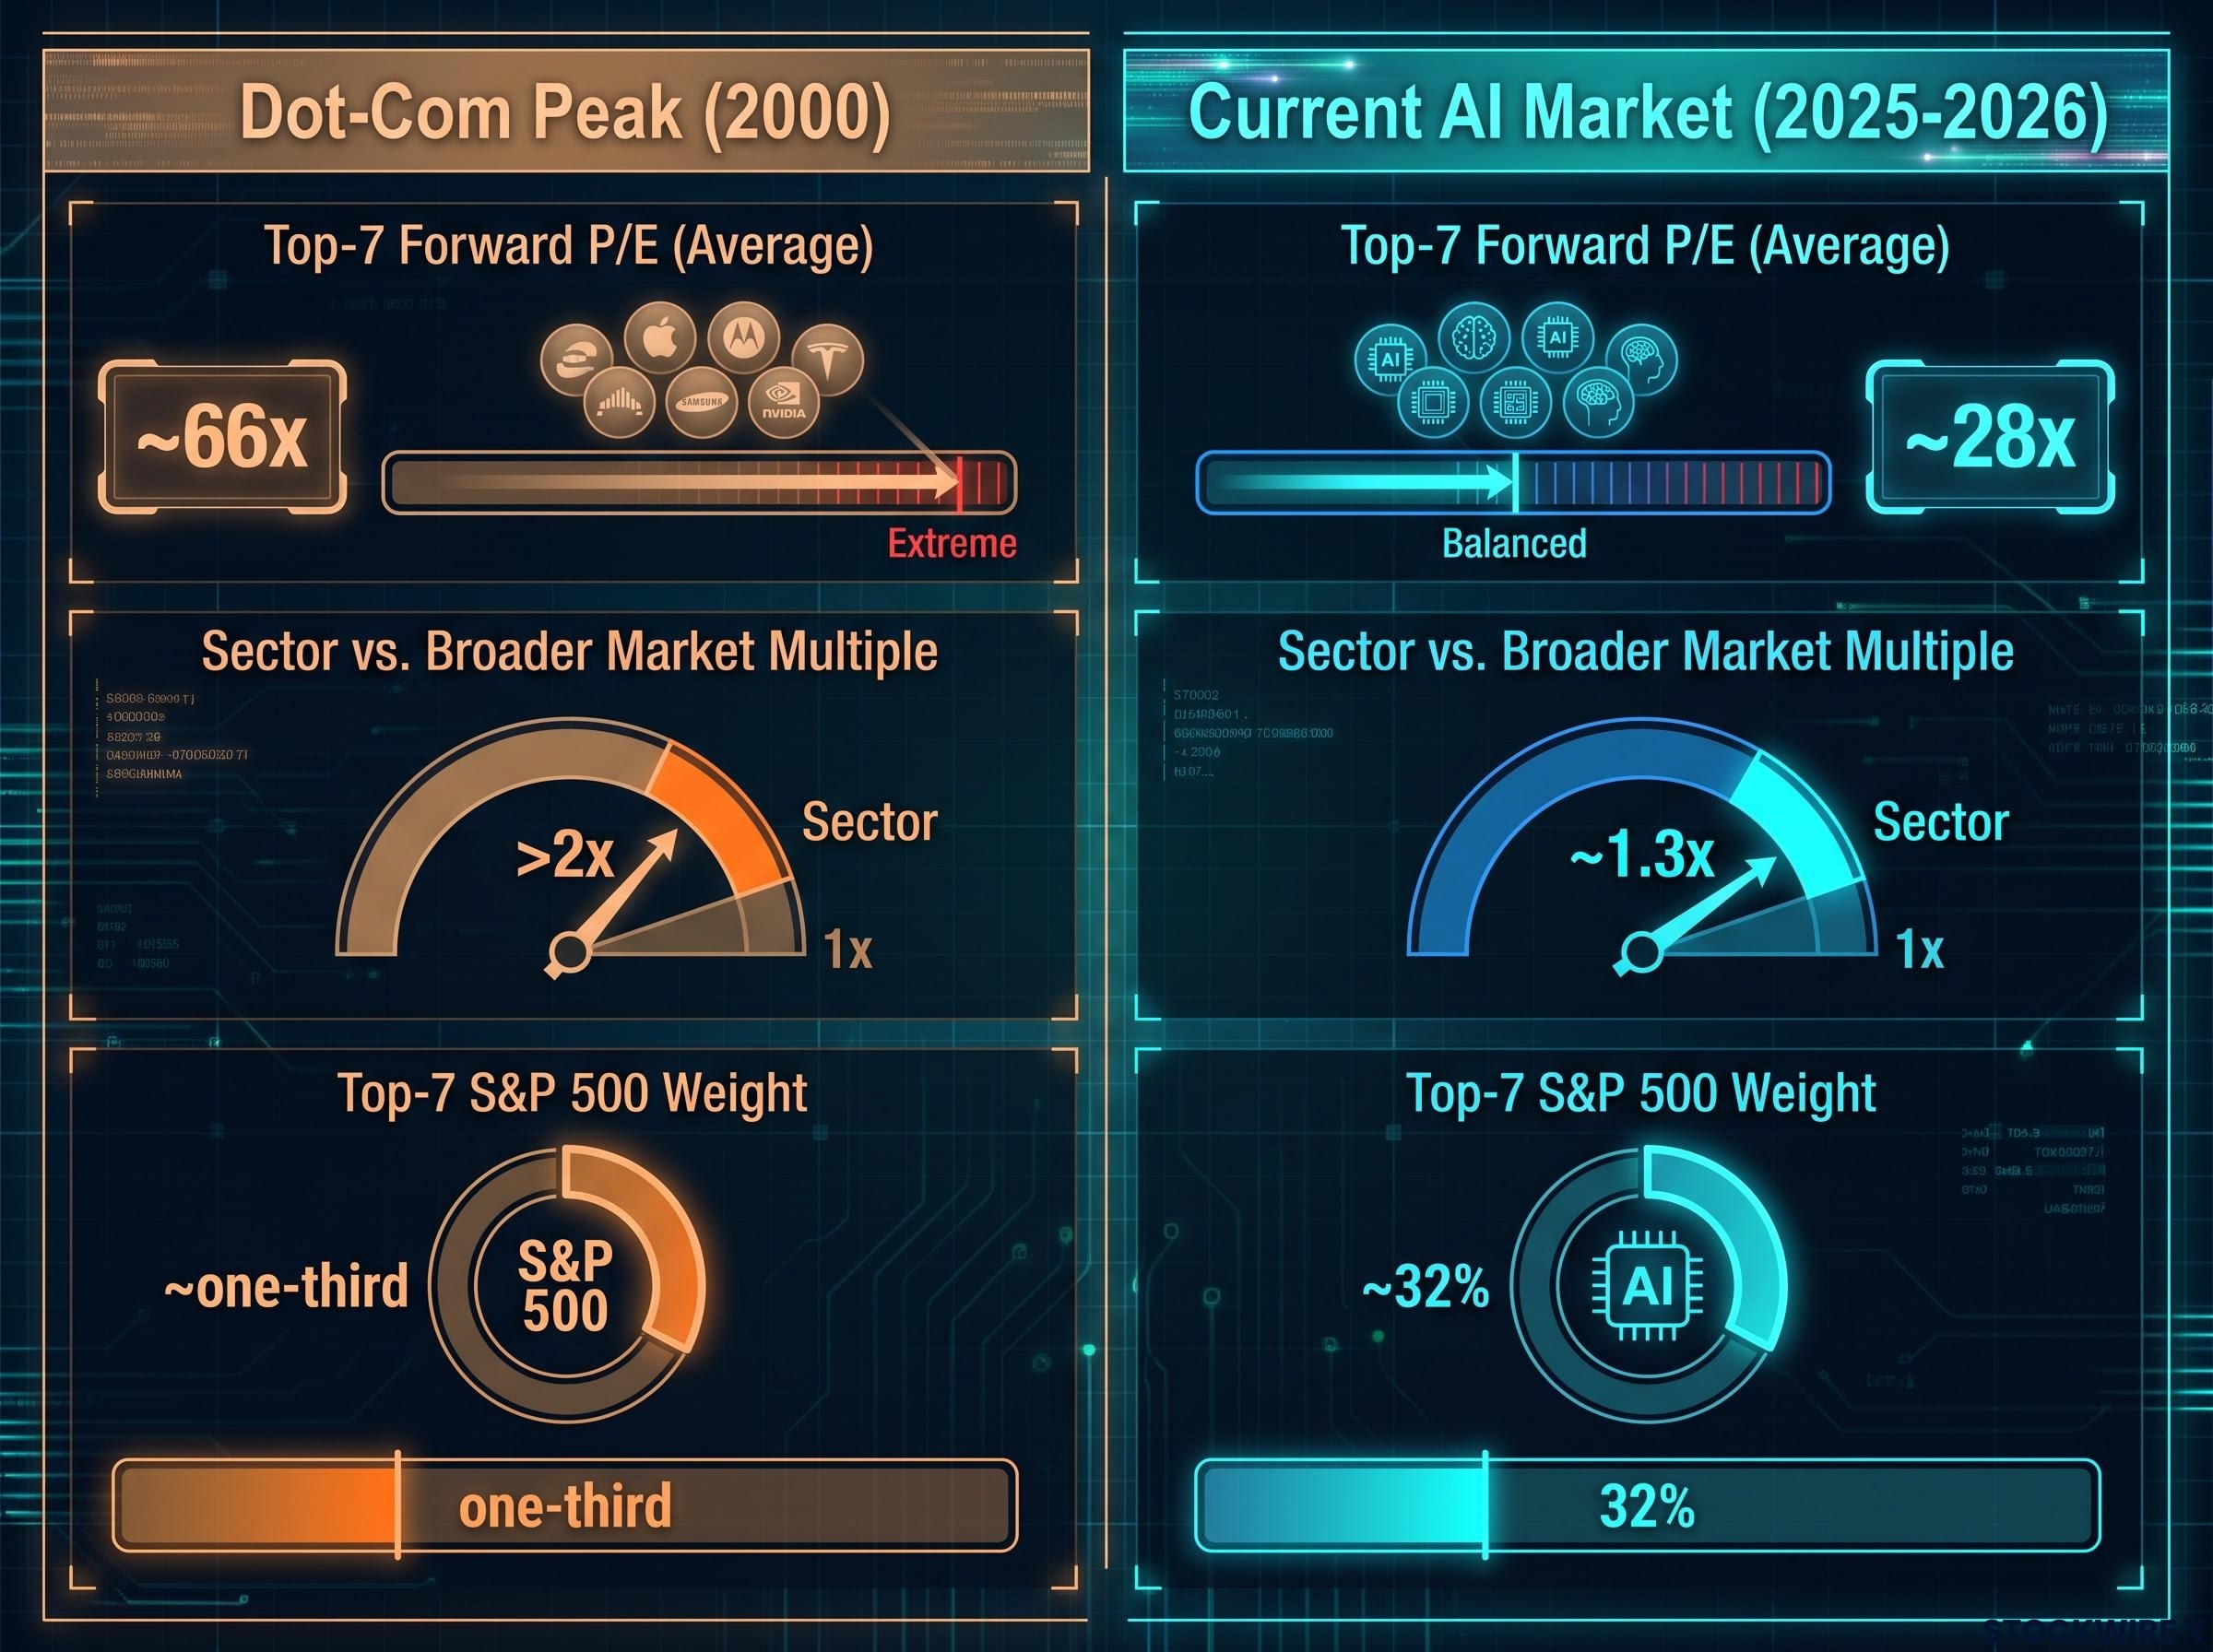
Nvidia’s trailing price-to-earnings ratio (the share price divided by the most recent 12 months of earnings per share) sits in the mid-30s, a fraction of Cisco’s 140-200 times figure at the bubble peak. A quantitative comparison of the top seven stocks by market capitalisation finds an average forward P/E of approximately 28 times today versus roughly 66 times for the top seven names in 1999. At the dot-com peak, the technology sector traded at more than double the multiple of the broad equity market; today, it trades at approximately 1.3 times the broader market multiple.
The CAPE and Minsky frameworks add a further layer to this comparison: the S&P 500 Shiller CAPE ratio of 40-41 as of mid-2026 is the second-highest reading in 155 years of market data, exceeded only by the dot-com peak of 44.2, yet real profits and record index concentration make this cycle harder to categorise than any prior episode.
P/E ratios for AI stocks have actually fallen from 2023 to 2025 as earnings caught up to prices, a dynamic that did not occur during the dot-com period. That is a meaningful difference.
| Metric | Dot-com peak (2000) | Current AI market (2025-2026) |
|---|---|---|
| Top-7 forward P/E (average) | ~66× | ~28× |
| Sector vs. broader market multiple | >2× | ~1.3× |
| Top-7 S&P 500 weight | ~one-third | ~32% |
So the multiples are lower. The concentration is not.
Record market concentration amplifies this risk further: five U.S. companies now control roughly 30% of total U.S. equity market capitalisation, a level with no historical precedent according to Wolfe Research data, while the top 10 S&P 500 stocks represent around 40% of index weight, figures Goldman Sachs and Morgan Stanley describe as extreme by any modern measure.
The top seven U.S. stocks represent approximately 32% of the S&P 500’s total weight as of 2026, rivalling or exceeding the concentration observed in 2000. That is where the defensible concern lives. The risk is less about bubble-era multiples repeating and more about what happens to a “diversified” retirement portfolio when nearly a third of its index weight reprices sharply in a single cycle. If you hold a broad U.S. index fund, you are not as insulated as the word “diversified” implies.
What sequence-of-returns risk means for investors near or in retirement
The standard response to any bubble concern is that markets recover. Over long enough periods, they do. But “long enough” is not the same concept for a 35-year-old accumulating capital and a 62-year-old preparing to draw it down.
Sequence-of-returns risk is the mechanism that makes timing matter even for long-term portfolios. It works like this: when you are withdrawing money from a portfolio (to fund retirement living expenses, for instance) and the portfolio suffers a large early loss, you are forced to sell shares at depressed prices to cover withdrawals. Those shares are no longer in the portfolio when the recovery arrives. The losses become permanent, even if the market eventually recovers to prior levels, because the assets that would have participated in the recovery have already been sold.
A recovery that arrives in year 10 is irrelevant if withdrawals in years 1-3 locked in permanent losses. For investors in the distribution phase, time does not heal all wounds.
This means the “long-term investor” framing does not apply uniformly across life stages. An investor within 5-10 years of retirement faces a structurally different risk calculation than an accumulation-phase investor with the same holdings. A prior live educational session on this topic drew more than 7,000 attendees, which tells you this concern resonates broadly with real investors approaching this exact decision point.
The practical diagnostic is straightforward. Retirement-planning literature uses approximately 25% exposure to mega-cap tech and AI names as the threshold where deliberate review is warranted, with 15-20% as a more conservative personal prudence buffer. Most investors have never calculated their actual number. Here is how:
- List every fund and account you hold.
- Identify your positions in each of the named mega-cap tech and AI stocks: Nvidia, Microsoft, Apple, Alphabet, Amazon, Meta, Tesla, and Broadcom.
- Sum the weighted exposure across all accounts (your “look-through” concentration, meaning the total percentage of your portfolio that is effectively invested in these names when you add up every fund that holds them).
- Compare your total against the 25% threshold and the 15-20% conservative buffer.
Many investors holding multiple index funds across different accounts are unaware of how redundant and concentrated their effective exposure has become. The look-through number is often higher than they expect.
Hidden AI concentration runs deeper than most investors appreciate: Microsoft, Alphabet, Amazon, Meta, and Apple now appear simultaneously as equity index weights, data-centre REIT tenants, and investment-grade bond issuers, meaning a standard multi-asset portfolio can carry the same thematic bet across every sleeve without any single allocation decision triggering a warning.
This article is for informational purposes only and should not be considered financial advice. Investors should conduct their own research and consult with financial professionals before making investment decisions.
Separating a sound technology thesis from a sound investment at this price
The Cisco lesson, the valuation data, and the concentration risk converge on a single practical question. It is not whether to have AI exposure. It is whether your current exposure level, at current prices, with current concentration, is appropriate for your specific time horizon and withdrawal schedule.
The analysis does not require predicting a crash. It requires stress-testing your portfolio against the scenario where the top seven reprice sharply over 2-3 years, as Cisco did when it fell from a $555 billion market cap to $60 billion. With 32% of the S&P 500 riding on a small number of names, even a moderate repricing would ripple through every passive portfolio in the country.
Distributional volatility inside the index adds a layer that aggregate P/E ratios do not capture: low index-level volatility across AI-heavy benchmarks has been masking large opposing moves by individual winners and losers that cancel each other out, leaving passive investors exposed to single-stock risk they believe they have diversified away.
AI companies not yet founded or not yet dominant today may ultimately capture the lion’s share of the technology’s long-term value, just as Google and Facebook did after the internet. The specific-stock selection problem is harder than it appears when you are living inside the enthusiasm.
The distinction that matters is between conviction about the technology and conviction about the price. Most investors have examined only the first. Before sizing any position in an AI-adjacent stock, you should be able to answer three questions:
- What earnings multiple am I paying, and what growth rate does that imply over 10 years?
- What is my look-through concentration across all accounts?
- What is my actual time horizon to first withdrawal?
If you can answer all three with specifics, you have done the work. If you cannot, the technology thesis, however correct, is doing the job that valuation analysis should be doing. Being right about AI is the beginning of the investment question. It was never the answer.
Past performance does not guarantee future results. Financial projections are subject to market conditions and various risk factors.