
Westpac reported approximately A$1.8 billion in statutory net profit for Q3 FY26, a number roughly 3% above its first-half quarterly average. On the surface, that is a steady result from a steady bank. Underneath it, monthly mortgage applications were down 11% against the prior quarter, and once the Federal Budget landed, that run rate deteriorated a further 20% relative to Q2 levels.
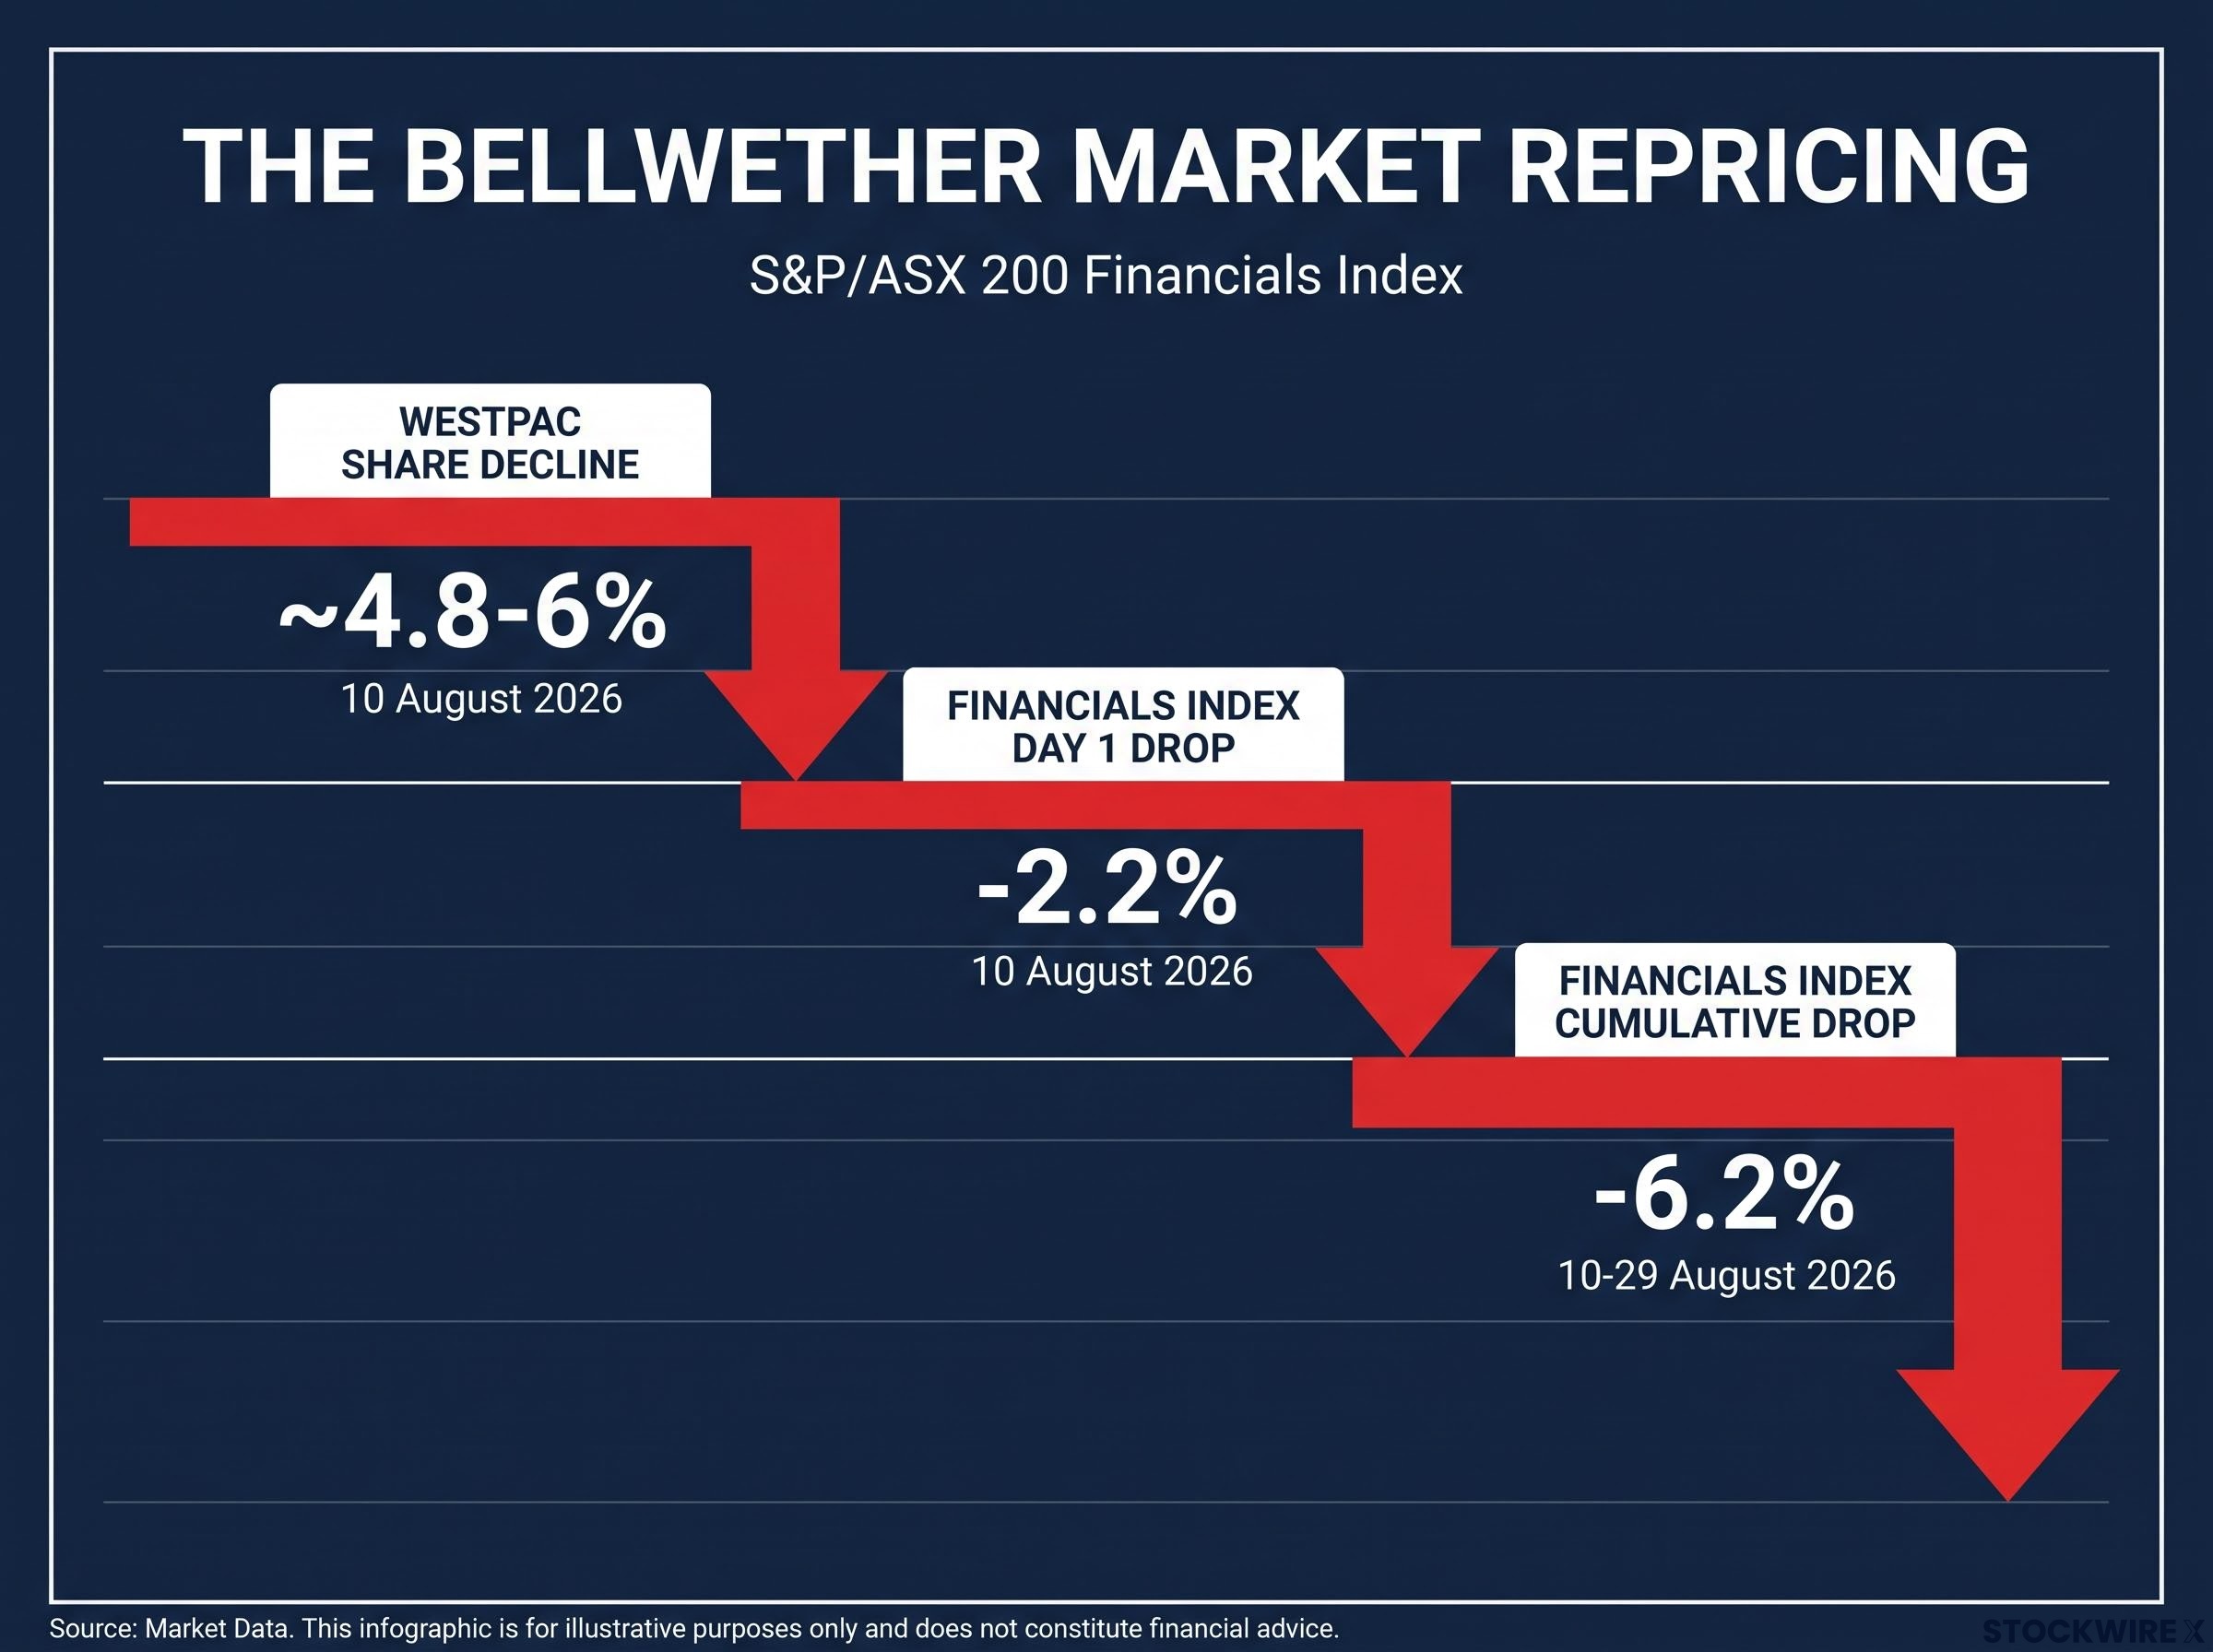
That gap between headline profit and borrower behaviour is why this matters beyond Westpac alone. The bank reported before its peers, which meant the market used its 10 August trading update to reprice every major bank simultaneously. On the day of the disclosure, the S&P/ASX 200 Financials Index shed 2.2%, and by 29 August the cumulative drawdown had reached 6.2%. One bank’s disclosure moved an entire index.
Here is how mortgage application volumes inside a single trading update function as a leading indicator for the broader sector, and how to use that logic the next time a major bank reports early. This is a skill for future reporting seasons, not a recap of one that has passed.
Why a single bank’s trading update moved the whole sector
Westpac is not just another listed company reporting quarterly numbers. It holds one of the largest mortgage books on the ASX. Its systemic size means that when it discloses demand trends in housing credit, markets do not process that information as company-specific news. They process it as a read-through, a term for when investors treat one company’s data as a proxy for what peers are likely to report, for all four major banks.
The bellwether sequence works in three stages:
- Stage one: The earliest-reporting major discloses its trading update, including borrower-behaviour metrics that reflect system-wide demand, not just its own market share.
- Stage two: Peers de-rate before they have reported, as investors infer that the same pressures apply across the sector.
- Stage three: The S&P/ASX 200 Financials Index reprices to reflect the aggregate adjustment, dragging portfolios with broad financials exposure regardless of which individual bank they hold.
The Financials Index dropped 2.2% on 10 August, the day of Westpac’s disclosure, confirming that markets treated this as sector-wide news from the moment it landed.
That sequence played out exactly as the mechanism predicts. Other major banks subsequently echoed Westpac’s mortgage slowdown commentary in their own updates, which retrospectively validated the read-through logic. The market was right to reprice early.
| Metric | Value | Date |
|---|---|---|
| Westpac intraday share decline | ~4.8-6% | 10 August 2026 |
| S&P/ASX 200 Financials Index (day of disclosure) | -2.2% | 10 August 2026 |
| S&P/ASX 200 Financials Index (cumulative decline) | -6.2% | 10-29 August 2026 |
Any investor holding ASX financials broadly was affected by this repricing, whether they owned Westpac specifically or not. Understanding why bellwether disclosures trigger index-level moves is what separates investors who recognise the pattern early from those who only see it in hindsight.
The bellwether mechanism is one expression of a broader ASX structural tendency: index-level divergence between headline returns and constituent-level damage, driven by capitalisation-weighting that allows mega-cap anchors to mask widespread sector stress beneath a flat headline number.
When big ASX news breaks, our subscribers know first
What the mortgage numbers actually reveal about borrower behaviour
The first distinction to draw is between metrics a bank controls and metrics it does not. Westpac controls its pricing, its approval criteria, and its broker incentives. It competes for which mortgage a borrower chooses. What it does not control is whether that borrower decides to seek a mortgage at all.
That is why application volume declines at a lender of Westpac’s scale are a system-level observation, not a market-share problem. A meaningful fall in applications at one of Australia’s largest mortgage originators is strong evidence that fewer households are seeking housing credit across the board.
The RAMS sale as a directional signal
The deterioration arrived in two stages:
- Pre-budget softening: Q3 FY26 application volumes came in 11% below Q2 FY26 levels, signalling that housing credit demand was already softening before any single policy event.
- Post-budget acceleration: Following the May 2026 Federal Budget, the application run rate slipped to roughly 20% beneath the Q2 FY26 baseline. The budget acted as an accelerant on an existing trend, not a standalone cause.
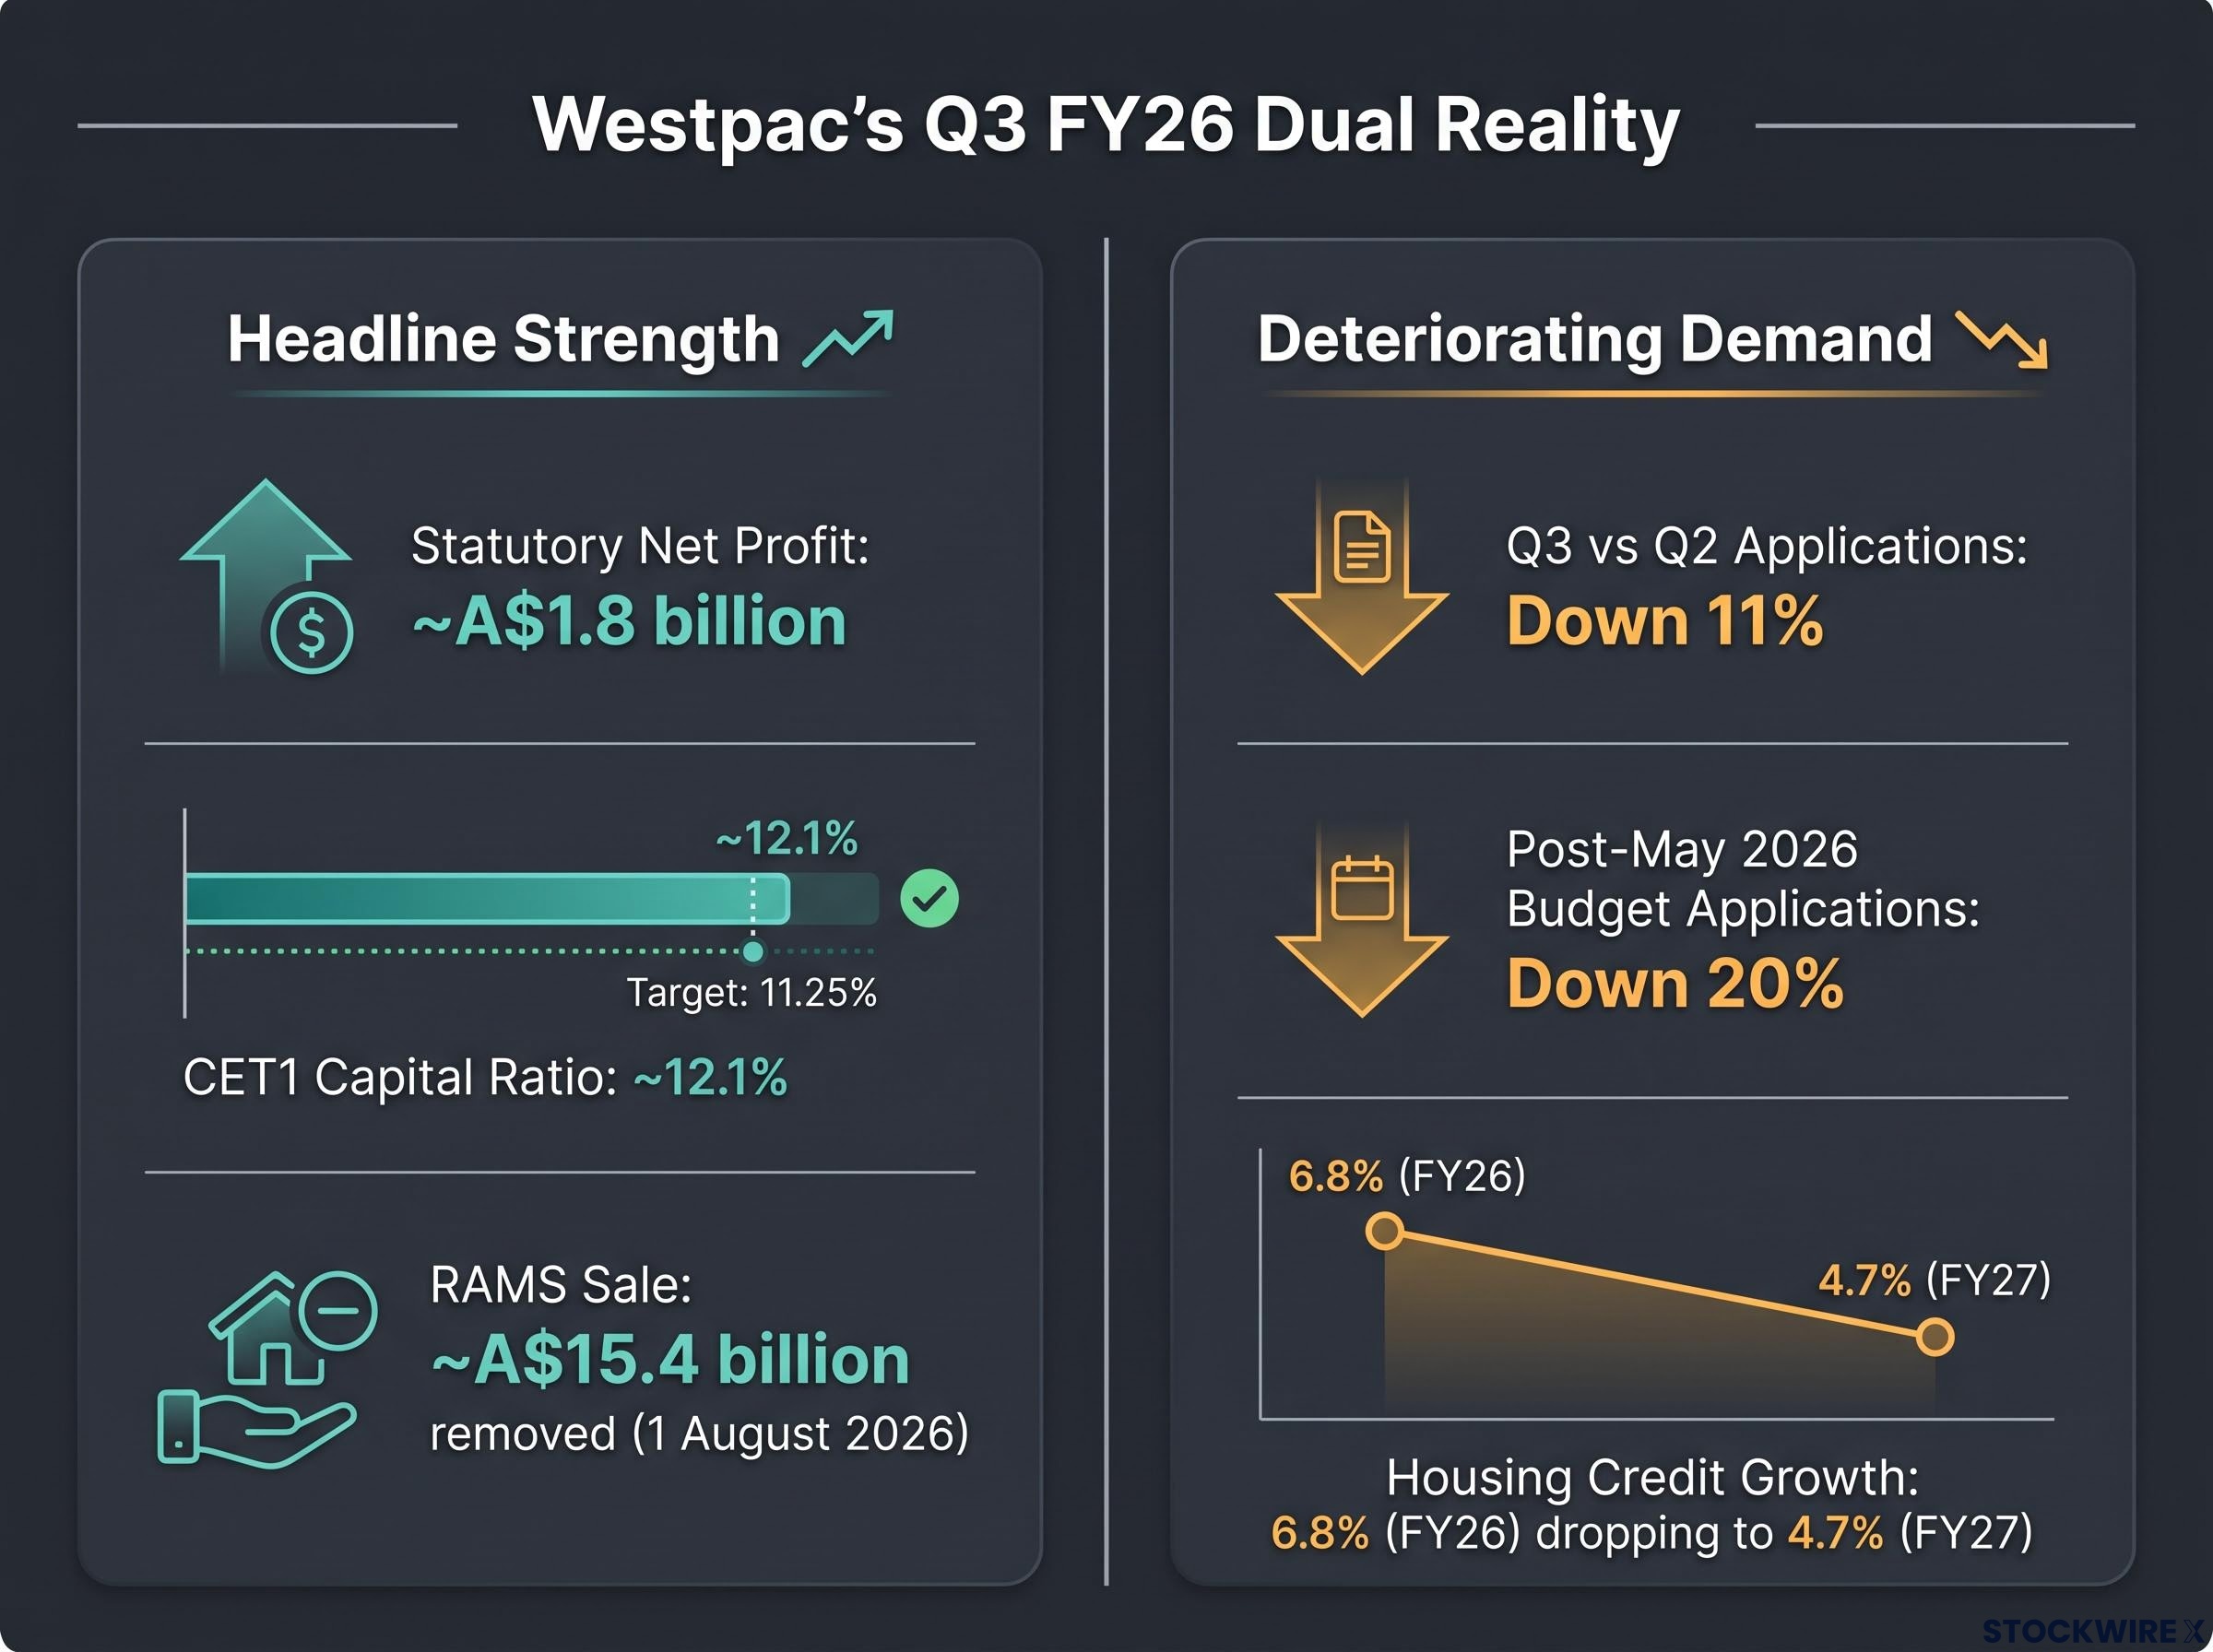
Westpac updated its housing credit growth expectations: 6.8% for FY26, moderating to 4.7% for FY27. That forward guidance quantifies where management believes the demand trajectory leads.
Alongside the volume decline, Westpac completed the sale of its RAMS mortgage portfolio, removing approximately A$15.4 billion from the home-loan book with effect from 1 August 2026. The sale added approximately 23 basis points to the bank’s CET1 capital ratio (the proportion of a bank’s highest-quality capital relative to its risk-weighted assets), bringing it to roughly 12.1% against a target of 11.25%.
Portfolio sales are discretionary management actions, not accounting adjustments. When a major bank voluntarily exits a A$15.4 billion mortgage book, it is communicating a view about where risk-adjusted value lies in housing credit. The capital headroom is welcome, but it does not solve the underlying demand problem. Westpac is repositioning away from a segment of the mortgage market it no longer finds attractive, and that is a stronger signal than a softening volume number alone.
For investors tracking bank reporting seasons, mortgage application volumes are a leading indicator. They show up in trading updates before they appear in impairment charges or revenue lines. Watching them is watching the sector’s future earnings trajectory in real time.
What retailers and airlines are telling you that bank data cannot
The household submitting fewer mortgage applications is the same household shopping at Woolworths, booking flights on Jetstar, and deciding whether to buy vitamins or skip them this month. Consumer-sector earnings from the same reporting season provide independent corroboration of the pressured environment the banks are navigating.
Woolworths internal research, cited during its FY26 earnings commentary, indicated that more than 40% of its customers reported difficulty meeting financial obligations.
That figure is not a banking statistic, but it describes the same household that is choosing not to submit a mortgage application. Woolworths management pointed to persistent inflation, global uncertainty, and successive rate increases as sustained pressures, with elevated multi-retailer shopping behaviour signalling aggressive value-seeking.
The picture across sectors is selective rather than uniformly dire.
| Company | Key Observation | Implication for Credit Demand |
|---|---|---|
| Woolworths | Over 40% of customers report financial difficulty; elevated multi-retailer shopping | Stretched households are less likely to take on new long-duration debt |
| Coles | Improving sales momentum; consumers substituting home dining for eating out | Down-trading behaviour indicates discretionary spend under pressure |
| Sigma Healthcare | Softer trends in vitamins and fragrances; strength in haircare and general healthcare | Discretionary health categories absorbing cuts while essentials hold |
| Qantas | Sustained high travel intent; Jetstar recorded a record trading week | Experience spending is resilient, but does not translate to borrowing appetite |
The pattern is selective belt-tightening. Australians are still flying and buying essentials, but they are substituting, down-trading, and shopping around in the categories they can adjust. What they are not doing is committing to large, long-duration financial obligations. That connects directly to the mortgage application data: stretched households are less willing to lever up further, and the banks are competing aggressively over a smaller pool of new borrowers.
Consumer-sector earnings releases from the same reporting season function as free macroeconomic research for bank investors. Reading them alongside bank updates builds a richer picture of the demand environment than bank data alone can provide.
The household stress visible in Woolworths’ data and Westpac’s mortgage application figures is consistent with per capita economic contraction: headline GDP continued growing through 2025, but output per person fell roughly 0.7% across the full year, corporate insolvencies hit their highest level since the 1990-91 recession, and real wages declined as wage growth failed to keep pace with inflation.
A practical framework for tracking ASX financials through reporting season
The August 2026 episode is one data point. Its value is that it produced a replicable framework. Each of the following five steps is grounded in something specific from the Westpac episode:
- Start with the earliest-reporting major as your reference point. Westpac’s 10 August disclosure set the sector’s base case before peers reported. Identify which bank reports first next season and treat its update as the initial read-through.
- Prioritise borrower-behaviour metrics over headline profit. Application volumes, pre-approvals, and enquiry trends reveal system-level demand. The headline number (A$1.8 billion profit) told you the bank was fine; the 11% application decline told you the sector’s forward trajectory was not.
- Pay closest attention to post-event disclosure windows. The post-budget acceleration (applications down 20%) was the sharpest signal in the entire update. Disclosures following budget announcements and RBA decisions reveal period-specific demand responses that are particularly information-dense.
- Read bank updates alongside consumer-facing sector commentary. The Woolworths, Coles, Sigma Healthcare, and Qantas data from the same reporting season corroborated the household stress environment independently of anything the banks disclosed.
- Track the S&P/ASX 200 Financials Index as the market’s running verdict. The cumulative 6.2% decline between 10 August and 29 August was the index absorbing each new data point. Individual stock moves should be contextualised against this benchmark.
Metrics to hold alongside the framework
Three quantitative anchors are worth checking at each major bank update:
- CET1 capital ratio: Currently approximately 12.1% against a 11.25% target at Westpac. This tells you how much buffer exists before capital constraints affect dividends or buybacks.
- Stressed exposures as a percentage of total committed exposures (TCE): Currently 1.19%. This is the credit quality baseline; watch for deterioration in future updates.
- Housing credit growth guidance: 6.8% in FY26 moderating to 4.7% in FY27. This is management’s own quantification of the earnings headwind.
These are context-setters, not buy or sell signals. They tell you how much room exists before the demand deterioration reaches the capital and credit quality lines.
A 6.2% index decline in under three weeks on data the headline numbers did not fully reveal is the lesson: investors who read the application volume figures early had a head start on the repricing. That advantage is replicable if you know where to look.
For investors wanting to apply these metrics systematically across the sector, our dedicated guide to reading ASX bank results walks through NIM, ROE, and CET1 together using a worked example from a current ASX-listed bank, including how to distinguish genuine earnings strength from capital leverage.
Where the Australian banking sector stands as the reporting season closes
Credit quality today remains sound. Stressed exposures sit at 1.19% of TCE. The CET1 ratio of approximately 12.1% against a 11.25% target provides genuine capital headroom, not a cosmetic buffer. These are real strengths that give the majors flexibility on dividends and buybacks even in a softer environment.
The unresolved question is whether the mortgage demand slowdown is cyclical or structural:
- Cyclical slowdown: Demand recovers with rate cuts or an improvement in economic conditions. Application volumes normalise within two to three quarters. The August correction proves sufficient, and financials re-rate.
- Structural demand reset: Household risk appetite has durably repriced. Borrowers remain cautious regardless of rate relief, and housing credit growth settles at or below the 4.7% FY27 forecast for an extended period. The August correction was the beginning, not the end.
Housing credit growth guidance: 6.8% in FY26, moderating to 4.7% in FY27. That spread quantifies the earnings headwind the market is now pricing.
The divergence between NAB and CBA housing credit forecasts for FY27, ranging from 2.5% to roughly 4-5%, confirms that Westpac’s guidance moderation is not an isolated management call but a sector-wide repricing of forward demand expectations.
The gap between a solid capital position and a deteriorating demand outlook is where the valuation question for ASX financials currently sits. No single data point resolves it. The reporting season is closing, but the story it started is not finished.
Investors who understand the bellwether mechanism, the borrower-behaviour metrics, and the consumer-sector corroboration layer described above are equipped to keep reading the sector as new data arrives, rather than waiting for consensus to form around them.
This article is for informational purposes only and should not be considered financial advice. Investors should conduct their own research and consult with financial professionals before making investment decisions. Past performance does not guarantee future results. Financial projections are subject to market conditions and various risk factors.