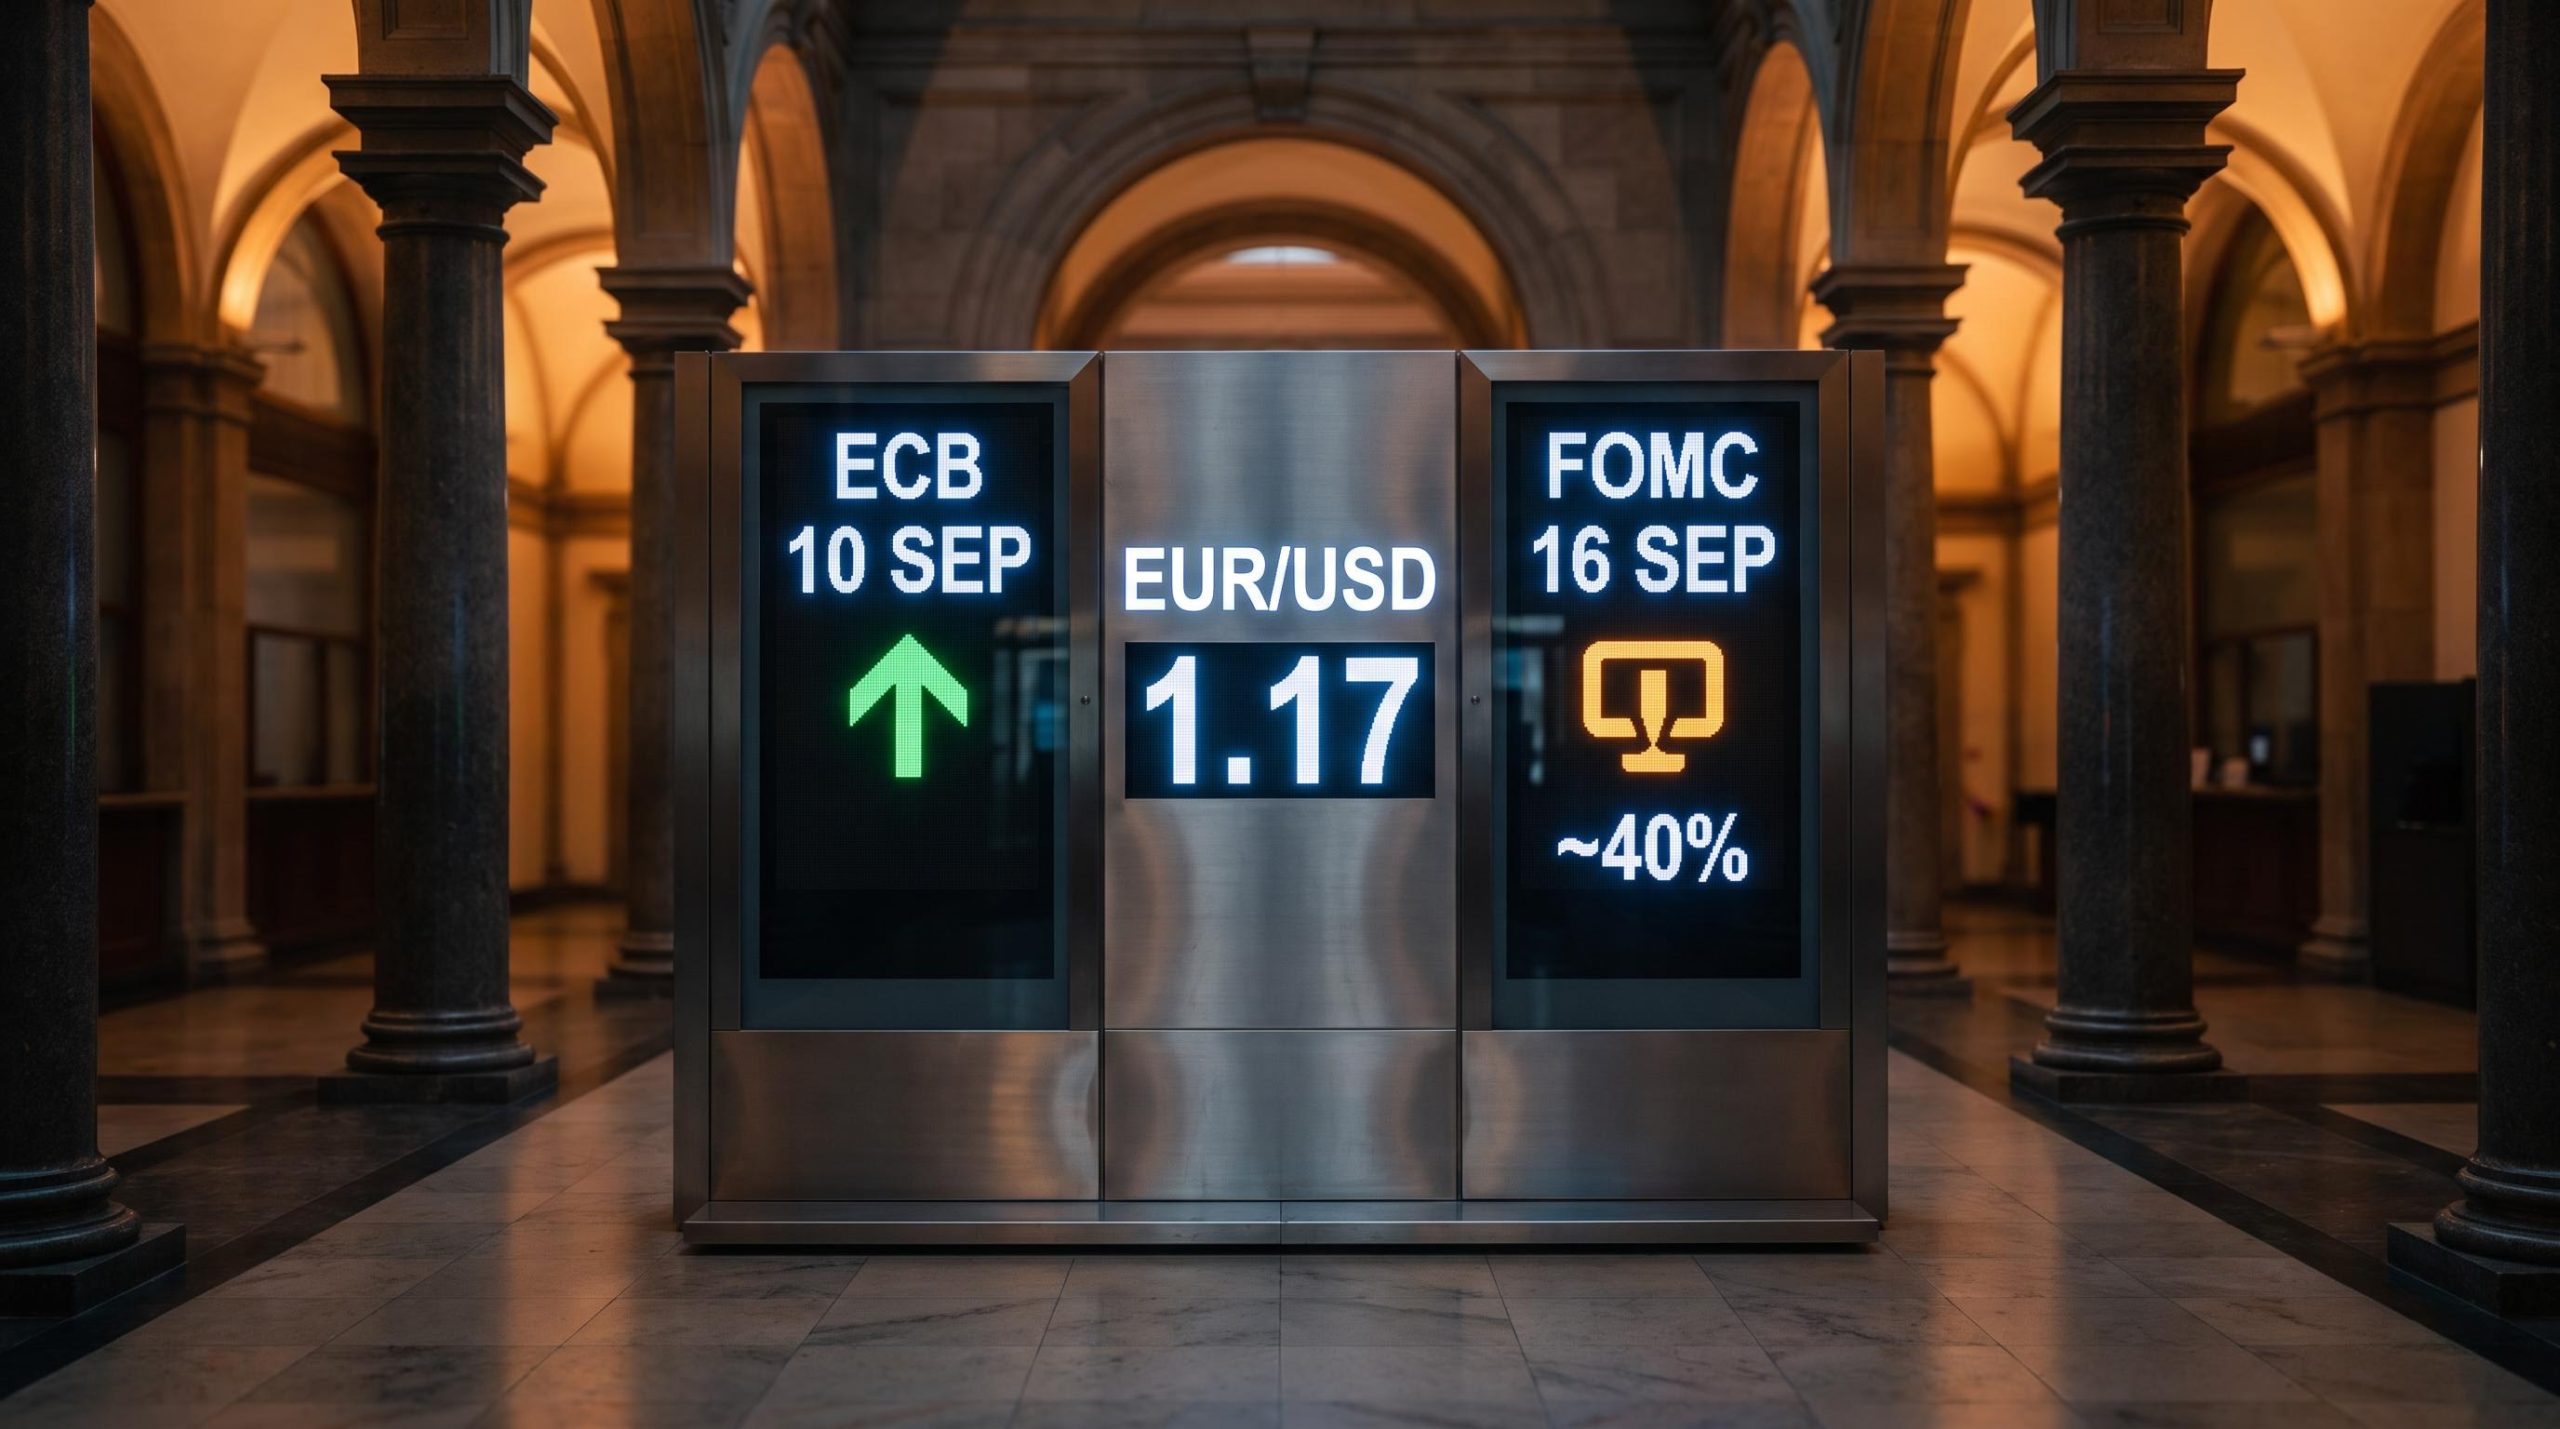
Financial markets have priced a Fed rate increase on 16 September at roughly 40%, while the ECB’s hike on 10 September is treated by traders as a near-certainty. That gap, a single week separating two of the world’s most powerful central banks moving in opposite directions, is the trade.
When both institutions act within days of each other, the EUR/USD rate becomes a referendum on which one has the more credible inflation story. UBS strategists have flagged this September configuration specifically as a likely driver of euro appreciation, but the thesis rests on a narrow window of incoming US data that could flip the narrative entirely before either central bank speaks. Jackson Hole is behind us. The data that will actually determine whether this trade works starts arriving next week.
This EUR/USD forecast lays out what the divergence means mechanically, where it can break down, what positioning makes sense across three distinct data scenarios, and whether September is a tactical one-off or the opening chapter of a longer structural shift. Here is the decision map for the two weeks ahead, and the logic to navigate each turning point.
Why an ECB hike and a Fed hold in the same week is the most consequential forex setup of the month
Start with the mechanics. When one central bank raises its policy rate and another holds steady, the interest rate differential between their currencies widens. That differential is the rate gap between what investors earn holding euro-denominated assets versus dollar-denominated ones. A wider gap in the euro’s favour pulls capital toward EUR instruments, creating buying pressure on the currency.
The mechanical link between policy rate gaps and currency moves runs through interest rate differentials, which reflect where markets expect rates to go rather than where official rates sit today, a distinction that explains why a single CPI miss can reprice EUR/USD more sharply than a fully anticipated central bank decision.
The specific numbers sharpen the picture. The ECB’s Governing Council meets 9-10 September in Berlin, hosted by the Deutsche Bundesbank, with updated Eurosystem staff macroeconomic projections on the table. As of 28 August 2026, a rate increase at that meeting is nearly fully priced. Six days later, the Federal Open Market Committee (FOMC) announces its own decision on 16 September, a Summary of Economic Projections (SEP) meeting that includes the updated dot plot, the chart showing where each policymaker expects rates to land through 2027. Markets have assigned only about 40% probability to a Fed hike at that meeting.
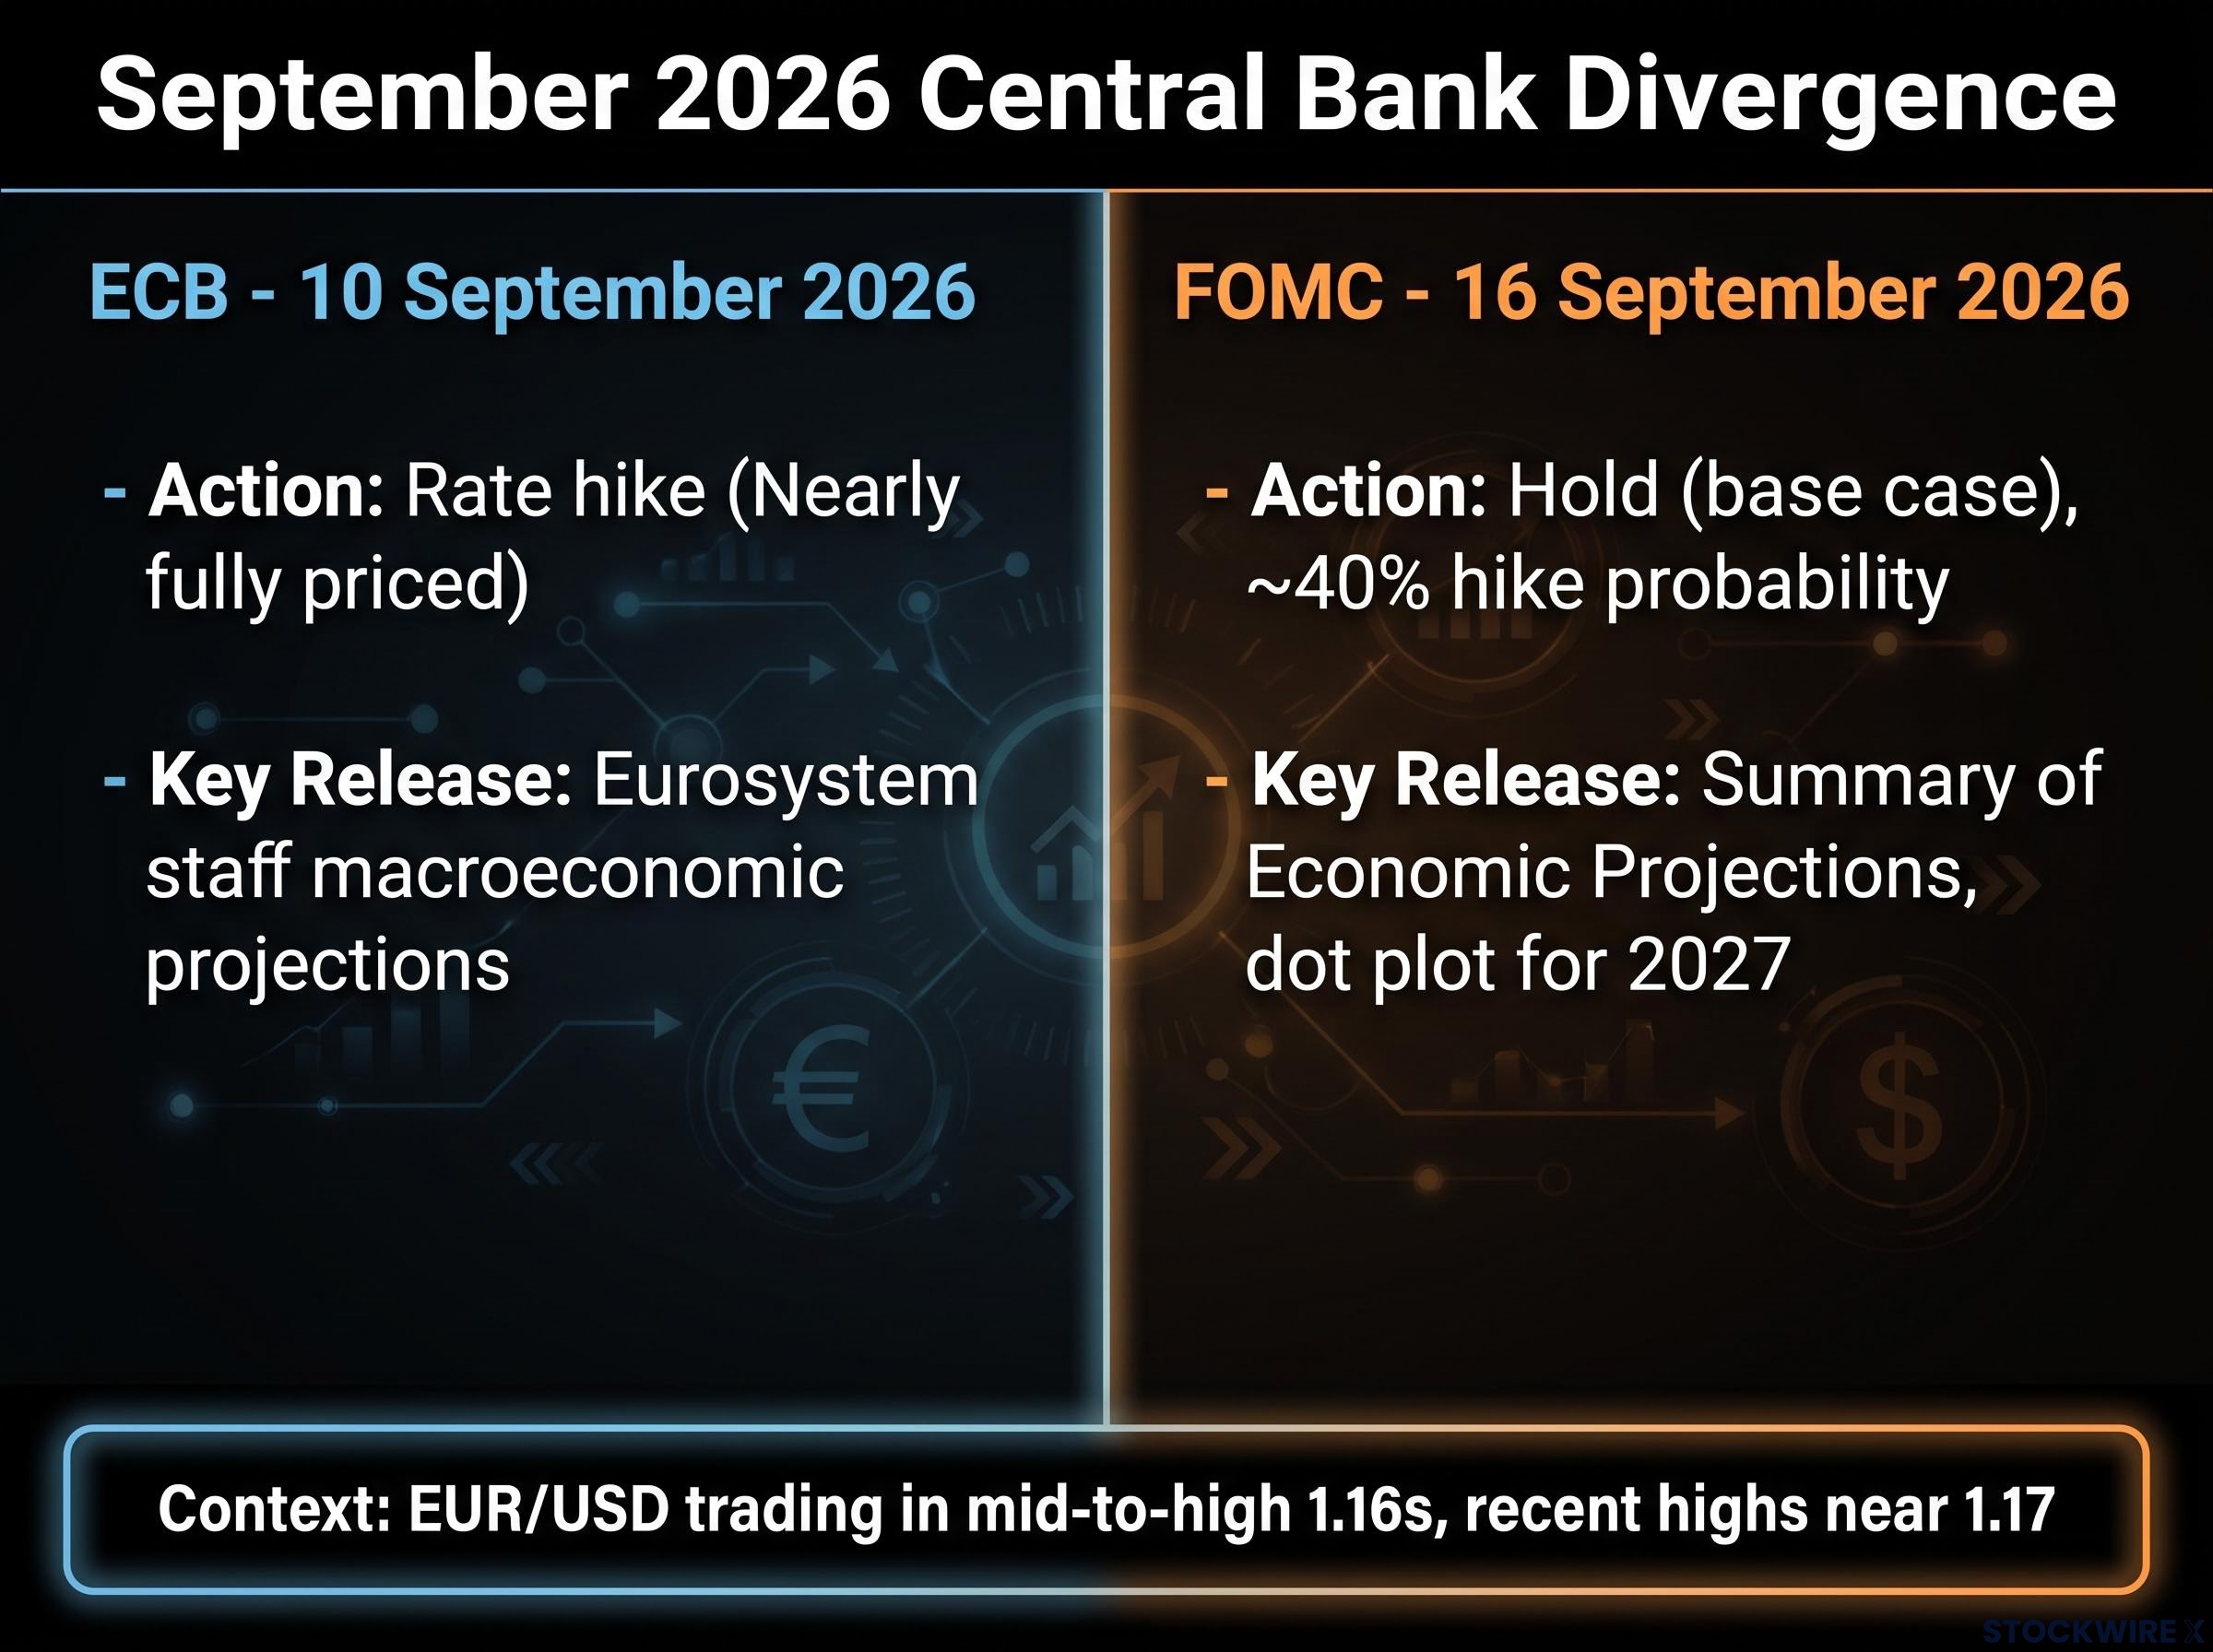
| Central Bank | Decision Date | Expected Action | Market-Implied Probability | Key Document Released |
|---|---|---|---|---|
| ECB | 10 September 2026 | Rate hike | Nearly fully priced | Eurosystem staff macroeconomic projections |
| FOMC | 16 September 2026 | Hold (base case) | ~40% hike probability | Summary of Economic Projections, dot plot |
EUR/USD has traded in the mid-to-high 1.16s through late August, sitting close to recent highs near 1.17. That tells you the divergence narrative already has partial expression in the price. The question is how much more room it has to run.
The role of positioning once a move is priced in
Here is where the asymmetry matters most. When a central bank decision is widely anticipated, the market reaction depends less on the rate decision itself and more on the communication that accompanies it. The ECB hike is in the price; the press conference framing of future rate intentions carries more EUR/USD weight than the hike number.
That means the cleaner expression of this trade is not the ECB meeting. It is the Fed’s dot plot and press conference on 16 September. If Chair Powell’s guidance confirms a comfortable, easing-biased hold, that is the moment that validates the divergence thesis for traders already positioned ahead of it. If the dot plot surprises hawkish, that is the moment the thesis deflates. For anyone sizing this trade, the Fed event carries the most residual surprise potential, and your exposure should reflect that weighting.
When big ASX news breaks, our subscribers know first
Two data releases that could rewrite the entire thesis before September 16
The divergence trade looks clean on paper. The problem is that two US data releases land inside the trading window before the Fed meets, and either one could reprice expectations sharply enough to close the gap that makes this trade attractive.

The first test arrives on 4 September: US August payrolls. August’s jobs report arrived weaker than anticipated, with the nonfarm payrolls figure turning negative in the July reading released in early August, signalling a contraction in employment. That weakness is a significant part of why the Fed hold is currently the base case.
The July payrolls contraction of 23,000 jobs, missing consensus by 108,000, produced a three-month sequence averaging roughly 20,000 jobs per month, a deterioration severe enough that a single strong August rebound would need to be exceptional to materially shift the Fed’s hold calculus.
UBS noted that a second consecutive set of weak employment readings would further diminish the probability of any rate action at the September meeting.
A strong August rebound, however, tells a different story. If jobs and wages surprise to the upside, the implied probability of a Fed hike climbs above the current 40% baseline, the expected rate gap versus the ECB narrows, and what looked like a clean EUR/USD long becomes a noisier, two-way trade. The dollar picks up support from higher US yields and revived carry appeal.
The second test lands in the week of 10 September: US August Consumer Price Index (CPI), the broadest measure of consumer price inflation. A hotter-than-expected print, particularly in core services and shelter (the sub-components that track sticky, demand-driven inflation rather than volatile food and energy), would challenge the assumption that disinflation is firmly in place. That assumption is the foundation of the “Fed can comfortably hold” narrative. Remove it, and the ECB-hikes-while-Fed-holds story breaks down.
Both risks are worth mapping clearly:
- 4 September, US August payrolls: Watch the headline nonfarm number and average hourly earnings. A strong rebound lifts Fed hike odds, narrows the rate differential, and pressures EUR/USD lower. A second consecutive soft print reinforces the hold case and supports the euro.
- Week of 10 September, US August CPI: Watch core services and shelter. Elevated readings challenge the disinflation narrative and raise the probability of a more hawkish Fed response. Benign readings keep the divergence thesis intact.
For anyone holding a EUR/USD long into these releases, the payrolls number on 4 September is effectively the first vote on whether the divergence trade survives the month. A strong print does not end the thesis outright, but it raises the cost of holding the position and compresses the reward-to-risk ratio. That is the moment to reassess sizing, not the moment to discover you needed a plan.
How to think about positioning across three distinct data scenarios
The question is not whether the divergence trade works in the abstract. It works in the base case. The question is which version of it is available to you given the data that arrives over the next two weeks.
Base case: ECB hikes, Fed holds, data comes in benign. The bias is moderately bullish EUR/USD into and just after the Fed meeting. Because the ECB hike is largely priced, the tactical approach is buying dips rather than chasing the announcement spike. The cleaner entry signal is the Fed statement and dot plot on 16 September: if Chair Powell confirms a comfortable hold with a gradual easing bias, the divergence trade gets its full validation. According to UBS, the available data does not make a compelling case for tightening at this point, and the bank views elevated term premiums in the bond market as reflecting distinct structural forces rather than a basis for Fed action.
Hawkish surprise: strong US jobs or CPI. This is the scenario where “buy the rumour, sell the fact” risk is highest. Both central bank decisions are widely anticipated, and a strong US data print in the interim reprices the Fed side of the equation. The directional long becomes riskier. Reducing EUR/USD exposure ahead of the key data releases is one option. Expressing the view through options structures is another.
| Scenario | Trigger Conditions | EUR/USD Direction | Positioning Implication |
|---|---|---|---|
| Base case | Benign US data, ECB hikes, Fed holds | Moderately bullish | Buy dips; use Fed statement as entry signal |
| Hawkish surprise | Strong payrolls or hot CPI | Neutral to bearish | Reduce directional longs; consider options structures |
| Soft US data | Second consecutive weak payrolls, benign CPI | Strongly bullish | Extend position duration; divergence becomes structural |
Most supportive scenario: weak US data, second consecutive soft employment reading. This is the only configuration that converts September from a tactical trade into a more durable EUR-positive position. Markets would lean harder into a future Fed easing path while the ECB remains comparatively restrictive, extending the policy divergence beyond September.
Why options offer a cleaner expression when data risk is elevated
When two major data releases sit between you and the catalyst you are positioning for, a pure directional long carries risk that does not always match the payoff. Owning EUR calls (the right to buy euros at a set price) and USD puts (the right to sell dollars) while selling topside strikes (higher-priced options that cap your maximum gain) limits the premium you pay upfront and defines your maximum loss if a hawkish Fed surprise materialises. You give up some of the upside in exchange for a position that can survive a data shock without forcing a reactive exit.
The practical takeaway is not a single directional call. It is a decision tree. Identify which scenario your own read of the incoming data favours, and position accordingly. Treating the ECB/Fed week as a single binary event ignores the data releases that will shape the outcome before either central bank speaks.
Is September a one-meeting trade or the start of a structural EUR/USD shift?
This is the question that has been sitting underneath every section of this analysis. The tactical setup is clear enough. The deeper question is whether it matters beyond September.
The answer lives in two documents, not two rate decisions. The ECB’s updated Eurosystem staff macroeconomic projections on 10 September will show revised growth and inflation trajectories for the euro area. The Fed’s updated dot plot on 16 September will show where policymakers expect rates to sit through 2027. How those documents frame the path forward determines whether the divergence is a short-lived, one-meeting event or the beginning of a structural theme.
The FOMC vote split on 16 September will carry as much interpretive weight as the dot plot itself, because the July 2026 nine-to-three hawkish dissent already signalled that a meaningful minority of committee members wanted to move, and a shift in that tally would reprice near-term rate expectations independently of the median projection.
Three indicators to watch in those documents that would confirm a structural rather than tactical divergence:
- The Fed’s 2027 rate projections. If the median dot shifts meaningfully lower, it signals that policymakers see a clear path to cuts, not just a comfortable hold. That extends the divergence timeline well beyond September.
- The ECB’s inflation persistence assessment. If the updated projections show eurozone inflation remaining above target further into the forecast horizon, it signals that the ECB’s restrictive stance has months or quarters left to run while the Fed pivots.
- The neutral rate framing in both documents. The neutral rate is the interest rate level that neither stimulates nor restrains economic growth. If the Fed’s estimate of neutral is trending lower while the ECB’s holds steady, the structural gap between where each institution is heading becomes clearer.
The core strategic question for the next 6-12 months: is September a one-meeting divergence that yields a modest EUR/USD move, or the opening chapter of a longer-term structural theme in which the euro remains supported as markets internalise a more dovish Fed path?
UBS argued against the notion that the Fed would step in to bring long-duration bond yields down, observing that elevated term premiums stem from other considerations rather than a policy signal. That framing matters: it suggests the Fed’s tolerance for higher long-end yields gives the ECB room to remain the more hawkish institution for longer without triggering a US policy response.
EUR/USD near 1.17 in late August means the market has partially priced the divergence. Whether the currency can sustain and build on that level over the following 6-12 months, or whether it reverts to range-trading once September passes, depends on what those projections reveal. If the dot plot signals a clear pivot toward cuts in 2027 while the ECB’s projections affirm inflation persistence, traders who positioned tactically will need to consider whether to extend the duration of their exposure. That is a different trade with different instruments and different risk management.
The Treasury buyback programme has been functioning as a structural yield curve cap, compressing the dollar’s rate premium independently of Fed policy decisions and complicating the assumption that a hawkish dot plot would automatically translate into sustained USD strength.
What the next two weeks actually decide
The divergence thesis is coherent and supported by current pricing. Its durability depends entirely on whether US data allows the Fed to stay comfortably on hold. UBS judges that the incoming data picture does not meet the bar required for tightening, placing the hold firmly as the most likely outcome unless a substantial surprise materialises. EUR/USD near recent highs around 1.17 means the story has partial but not full expression in the current price.
Here is the sequence that matters:
- 4 September, US August payrolls. A strong rebound lifts Fed hike odds and pressures the divergence trade. A second consecutive soft print reinforces the hold case and gives EUR/USD room to extend. This is the first and most important test of whether the thesis survives the data window intact.
- 10 September, ECB decision and updated projections. The hike itself is largely priced. The projections and press conference framing of future rate intentions determine whether the divergence is a September story or a multi-quarter theme.
- 16 September, FOMC statement, dot plot, and press conference. The dot plot is the document that answers the structural question. Powell’s tone on inflation and the path forward either confirms the comfortable hold or introduces uncertainty that the market has not priced.
Traders who understand this scenario tree are positioned to act on the data as it arrives rather than chasing moves that have already happened. That is the difference between disciplined positioning and reactive decision-making in a high-volatility fortnight.
This article is for informational purposes only and should not be considered financial advice. Investors should conduct their own research and consult with financial professionals before making investment decisions. Currency trading and leveraged products involve significant risk of loss. These statements are speculative and subject to change based on market developments and central bank actions.