
Most financial milestones land without fanfare in bond markets. The day US gross federal debt crossed $40 trillion was no exception: yields did not spike, auctions did not fail, and the dollar did not flinch. The number was large. The market reaction was not.
That absence of drama is itself the story. The $40 trillion figure that flooded financial headlines on 19 August 2026 is real, but it bundles two structurally different categories of debt together in a way that obscures more than it reveals. For investors trying to assess what this milestone actually means for their fixed-income exposure, the headline number is the wrong starting point.
This piece gives you the analytical tools to separate what the $40 trillion figure confirms, what it exaggerates, and what the bond market is actually pricing right now. It covers the distinction between gross debt and the investor-relevant number, why the Treasury’s expanded buyback programme is routine housekeeping rather than a distress signal, and the specific market conditions that would signal a genuine shift from slow-moving fiscal concern to near-term crisis risk.
The milestone the market already knew was coming
The Congressional Budget Office had projected this trajectory months before the threshold arrived. Analysts, policymakers, and financial media had discussed US gross debt approaching $40 trillion throughout the first half of 2026. By the time the Treasury’s daily statement showed approximately $40.047 trillion on 19 August, the number confirmed what markets had already incorporated into pricing.
The specific crossing date was a function of routine cash flows and tax receipts, not a discrete fiscal event.
The $40 trillion threshold was crossed because of when revenue and spending happened to net out on a particular day, not because of a sudden change in the government’s fiscal position.
That distinction matters. Gross debt has risen roughly one-third in under five years and more than doubled from pre-pandemic levels, driven by primary deficits, higher interest costs, and rising entitlement spending. The trajectory is real and worth monitoring. But bond markets price fiscal information gradually and continuously. They do not wait for round-number thresholds to reprice.
No abrupt regime change in yields or auction behaviour was tied specifically to the crossing date. What this tells you as an investor is straightforward: the bond market had already incorporated this fiscal trajectory into pricing long before August 2026. The milestone is a useful narrative marker, but it is not a signal to act on.
When big ASX news breaks, our subscribers know first
The number investors should actually be watching
The $40 trillion headline combines two fundamentally different types of obligations. Only one of them directly affects your bond exposure.
Debt held by the public, approximately $32.27-$32.31 trillion as of late August 2026, is the portion financed in markets. This is the debt the Treasury sells at auction to private investors, foreign central banks, and institutional buyers. It carries rollover risk, requires ongoing demand, and directly determines what interest costs the government pays to external creditors.
Intragovernmental holdings, approximately $7.78 trillion, are accounting entries between government accounts. These are obligations the government owes to itself, primarily through trust funds like Social Security and Medicare. They represent real future commitments, but they do not face the same near-term financing risk and do not require external market confidence to sustain.
The Treasury Fiscal Data national debt breakdown provides the official split between debt held by the public and intragovernmental holdings, confirming the roughly $32.3 trillion investor-relevant figure that sits at the core of any sound fixed-income risk assessment.
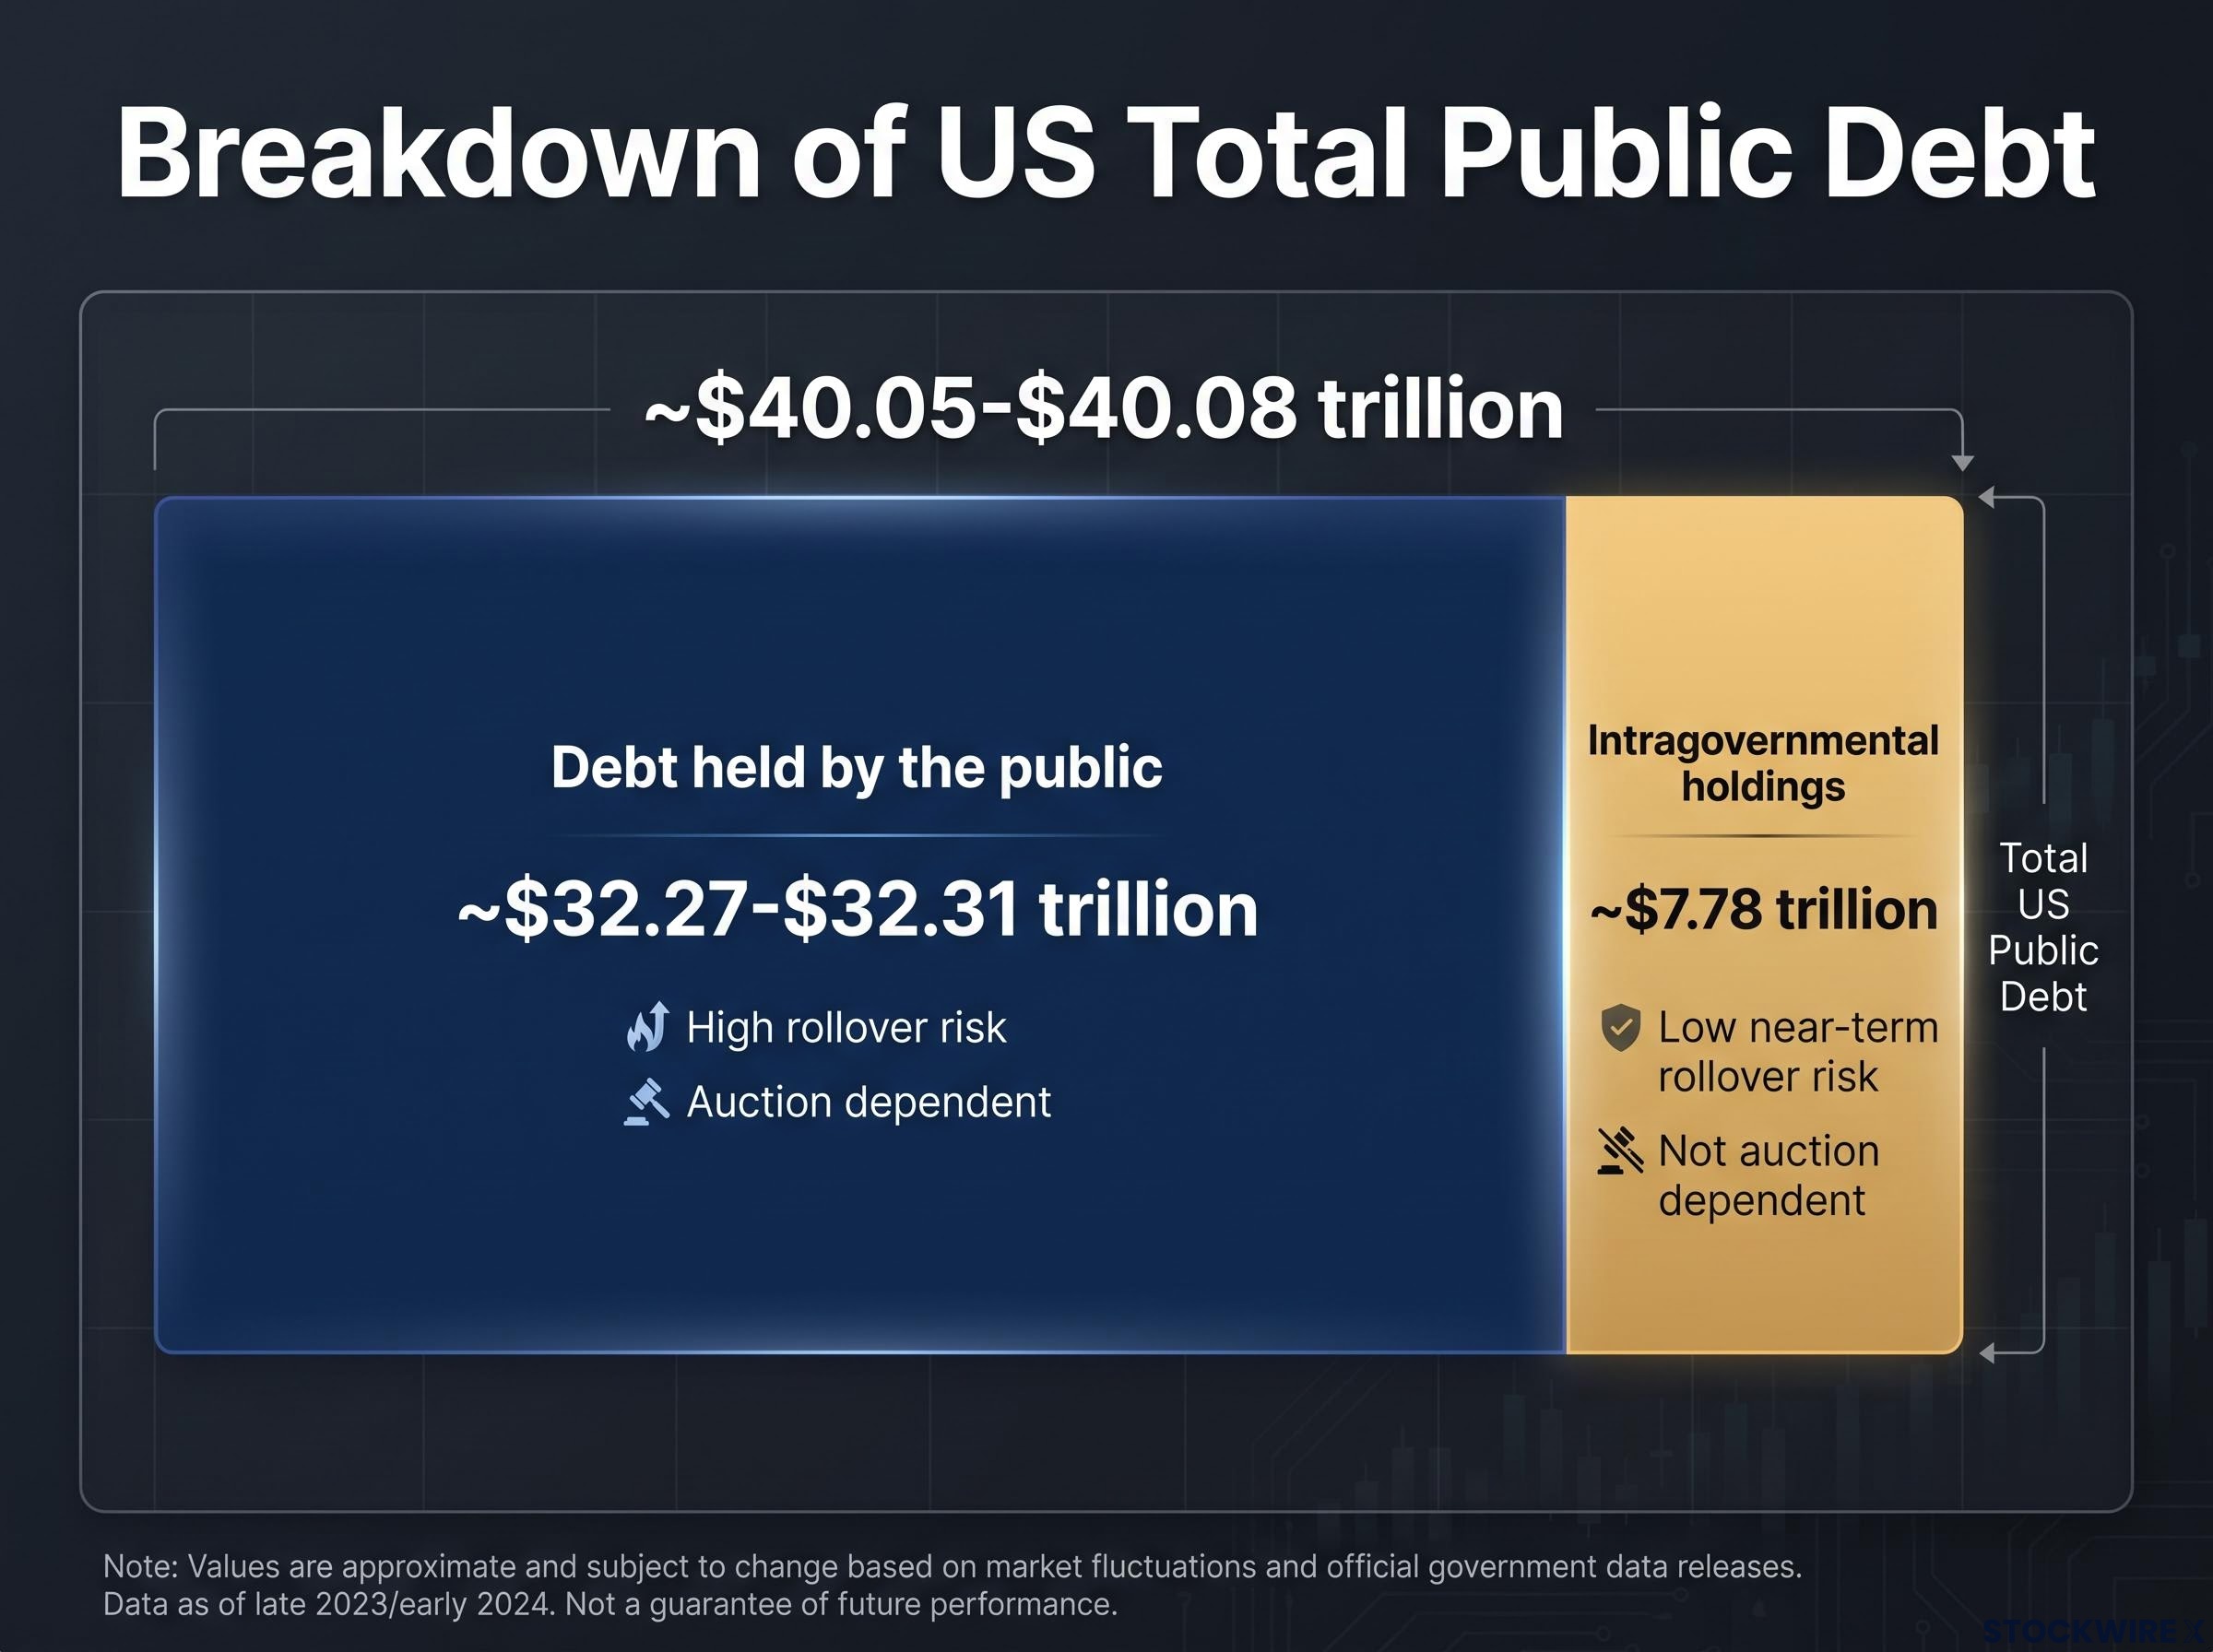
| Debt Category | Approximate Amount | Market Relevance | Rollover Risk | Auction Dependency |
|---|---|---|---|---|
| Total public debt outstanding | ~$40.05-$40.08 trillion | Headline figure; includes all categories | Mixed | Partial |
| Debt held by the public | ~$32.27-$32.31 trillion | Investor-relevant; must be financed in markets | High | Yes |
| Intragovernmental holdings | ~$7.78 trillion | IOUs between government accounts | Low (near-term) | No |
Why the distinction matters for bond allocation decisions
For anyone assessing Treasury market vulnerability, the $32 trillion in publicly held debt is the operational figure. It determines how much the Treasury must borrow from investors, what rate it pays, and how exposed US finances are to shifts in market confidence. The $40 trillion gross total adds context about the full scope of federal obligations but does not directly map to near-term funding risk.
Three metrics give you a more actionable picture of Treasury market health than the gross debt figure:
The interest-to-revenue ratio, currently in the 17-19% range for fiscal year 2025, is a more actionable fiscal affordability measure than gross debt because it directly links debt service costs to actual government cash flows rather than comparing a stock of obligations to the broader economy’s annual output.
- Bid-to-cover ratios at auctions: these measure how many dollars of bids arrive for each dollar of debt issued. Consistent ratios above historical averages signal healthy demand.
- Auction tails: the gap between where the market expected an auction to clear and where it actually cleared. Persistently large tails suggest buyers are demanding more yield than anticipated.
- Term premium movement: the extra yield investors require to hold longer-dated bonds instead of rolling short-term ones. Rising term premiums can signal growing uncertainty about fiscal trajectory or inflation, but they are not equivalent to default pricing.
Tracking these three variables tells you far more about near-term Treasury market conditions than watching the gross debt counter tick upward.
The market signals of sovereign debt stress
A high and rising debt load is a necessary ingredient in sovereign crises. It is not sufficient. Historically, two core market symptoms distinguish a genuine funding crisis from a slow-moving fiscal challenge.
International fiscal precedents from Japan and the United Kingdom demonstrate that high debt ratios do not mechanically produce market crises: Japan has sustained debt above 200% of GDP without sovereign stress, and the UK delivered roughly 30% equity returns after breaching 100% debt-to-GDP in September 2024, a comparison that adds historical texture to the argument that the US fiscal trajectory is a slow-moving structural concern rather than an imminent crisis.
- Yields spike due to credit concerns, not inflation or growth expectations. In a crisis, investors demand compensation for perceived default or restructuring risk. The feedback loop turns destructive: higher yields worsen fiscal arithmetic, which further erodes confidence, which pushes yields higher still.
- Auction demand deteriorates through low bid-to-cover ratios, large tails, and heavy primary-dealer absorption. When primary dealers (the banks obligated to bid at every auction) absorb disproportionate supply because other buyers have stepped back, the market is signalling that voluntary demand is thinning.
- Reserve managers reduce Treasury holdings materially. Foreign central banks and sovereign wealth funds hold Treasuries as reserve assets. A sustained reduction in these holdings would signal that the dollar’s reserve-currency status, which underpins structural demand for US government debt, is eroding.
- Additional crisis symptoms emerge: a collapsing currency, capital flight, or explicit discussion of restructuring among policymakers.
What the current data actually shows
None of those crisis-level thresholds are currently being met. Current yield levels reflect tight monetary policy, inflation expectations, and term premiums rather than explicit default pricing. Structural demand from domestic institutions, foreign central banks, and reserve managers remains intact, supported by the dollar’s reserve-currency role.
Treasury buyer composition has shifted materially over the past two years, with foreign reserve managers plateauing at roughly 33% of outstanding debt while domestic commercial banks have stepped in as the primary marginal buyer, reaching a record $4.8 trillion in holdings, a rotation that reshapes rollover risk across the entire maturity curve.
The long-run concerns are legitimate. Primary deficits continue to compound. Interest costs as a share of federal revenue are climbing. Entitlement spending growth is on a trajectory that narrows fiscal flexibility over time. These are real structural pressures that merit ongoing monitoring.
But they are a different analytical question from near-term crisis risk, and they operate on a different timeframe with different evidence thresholds. A yield curve that steepens further could encourage greater lending volumes and wider economic activity, which would in turn bolster the government’s capacity to meet its debt obligations, providing some counterweight to the fiscal drag from higher long-end rates.
Until you see yields rising because of credit-risk repricing (not inflation or supply dynamics), auction tails widening persistently, or reserve managers reducing Treasury holdings materially, the US fiscal situation is a slow-moving structural problem rather than an imminent market crisis. Your investment decisions should reflect that distinction.
Treasury buybacks: a technical adjustment, not a distress signal
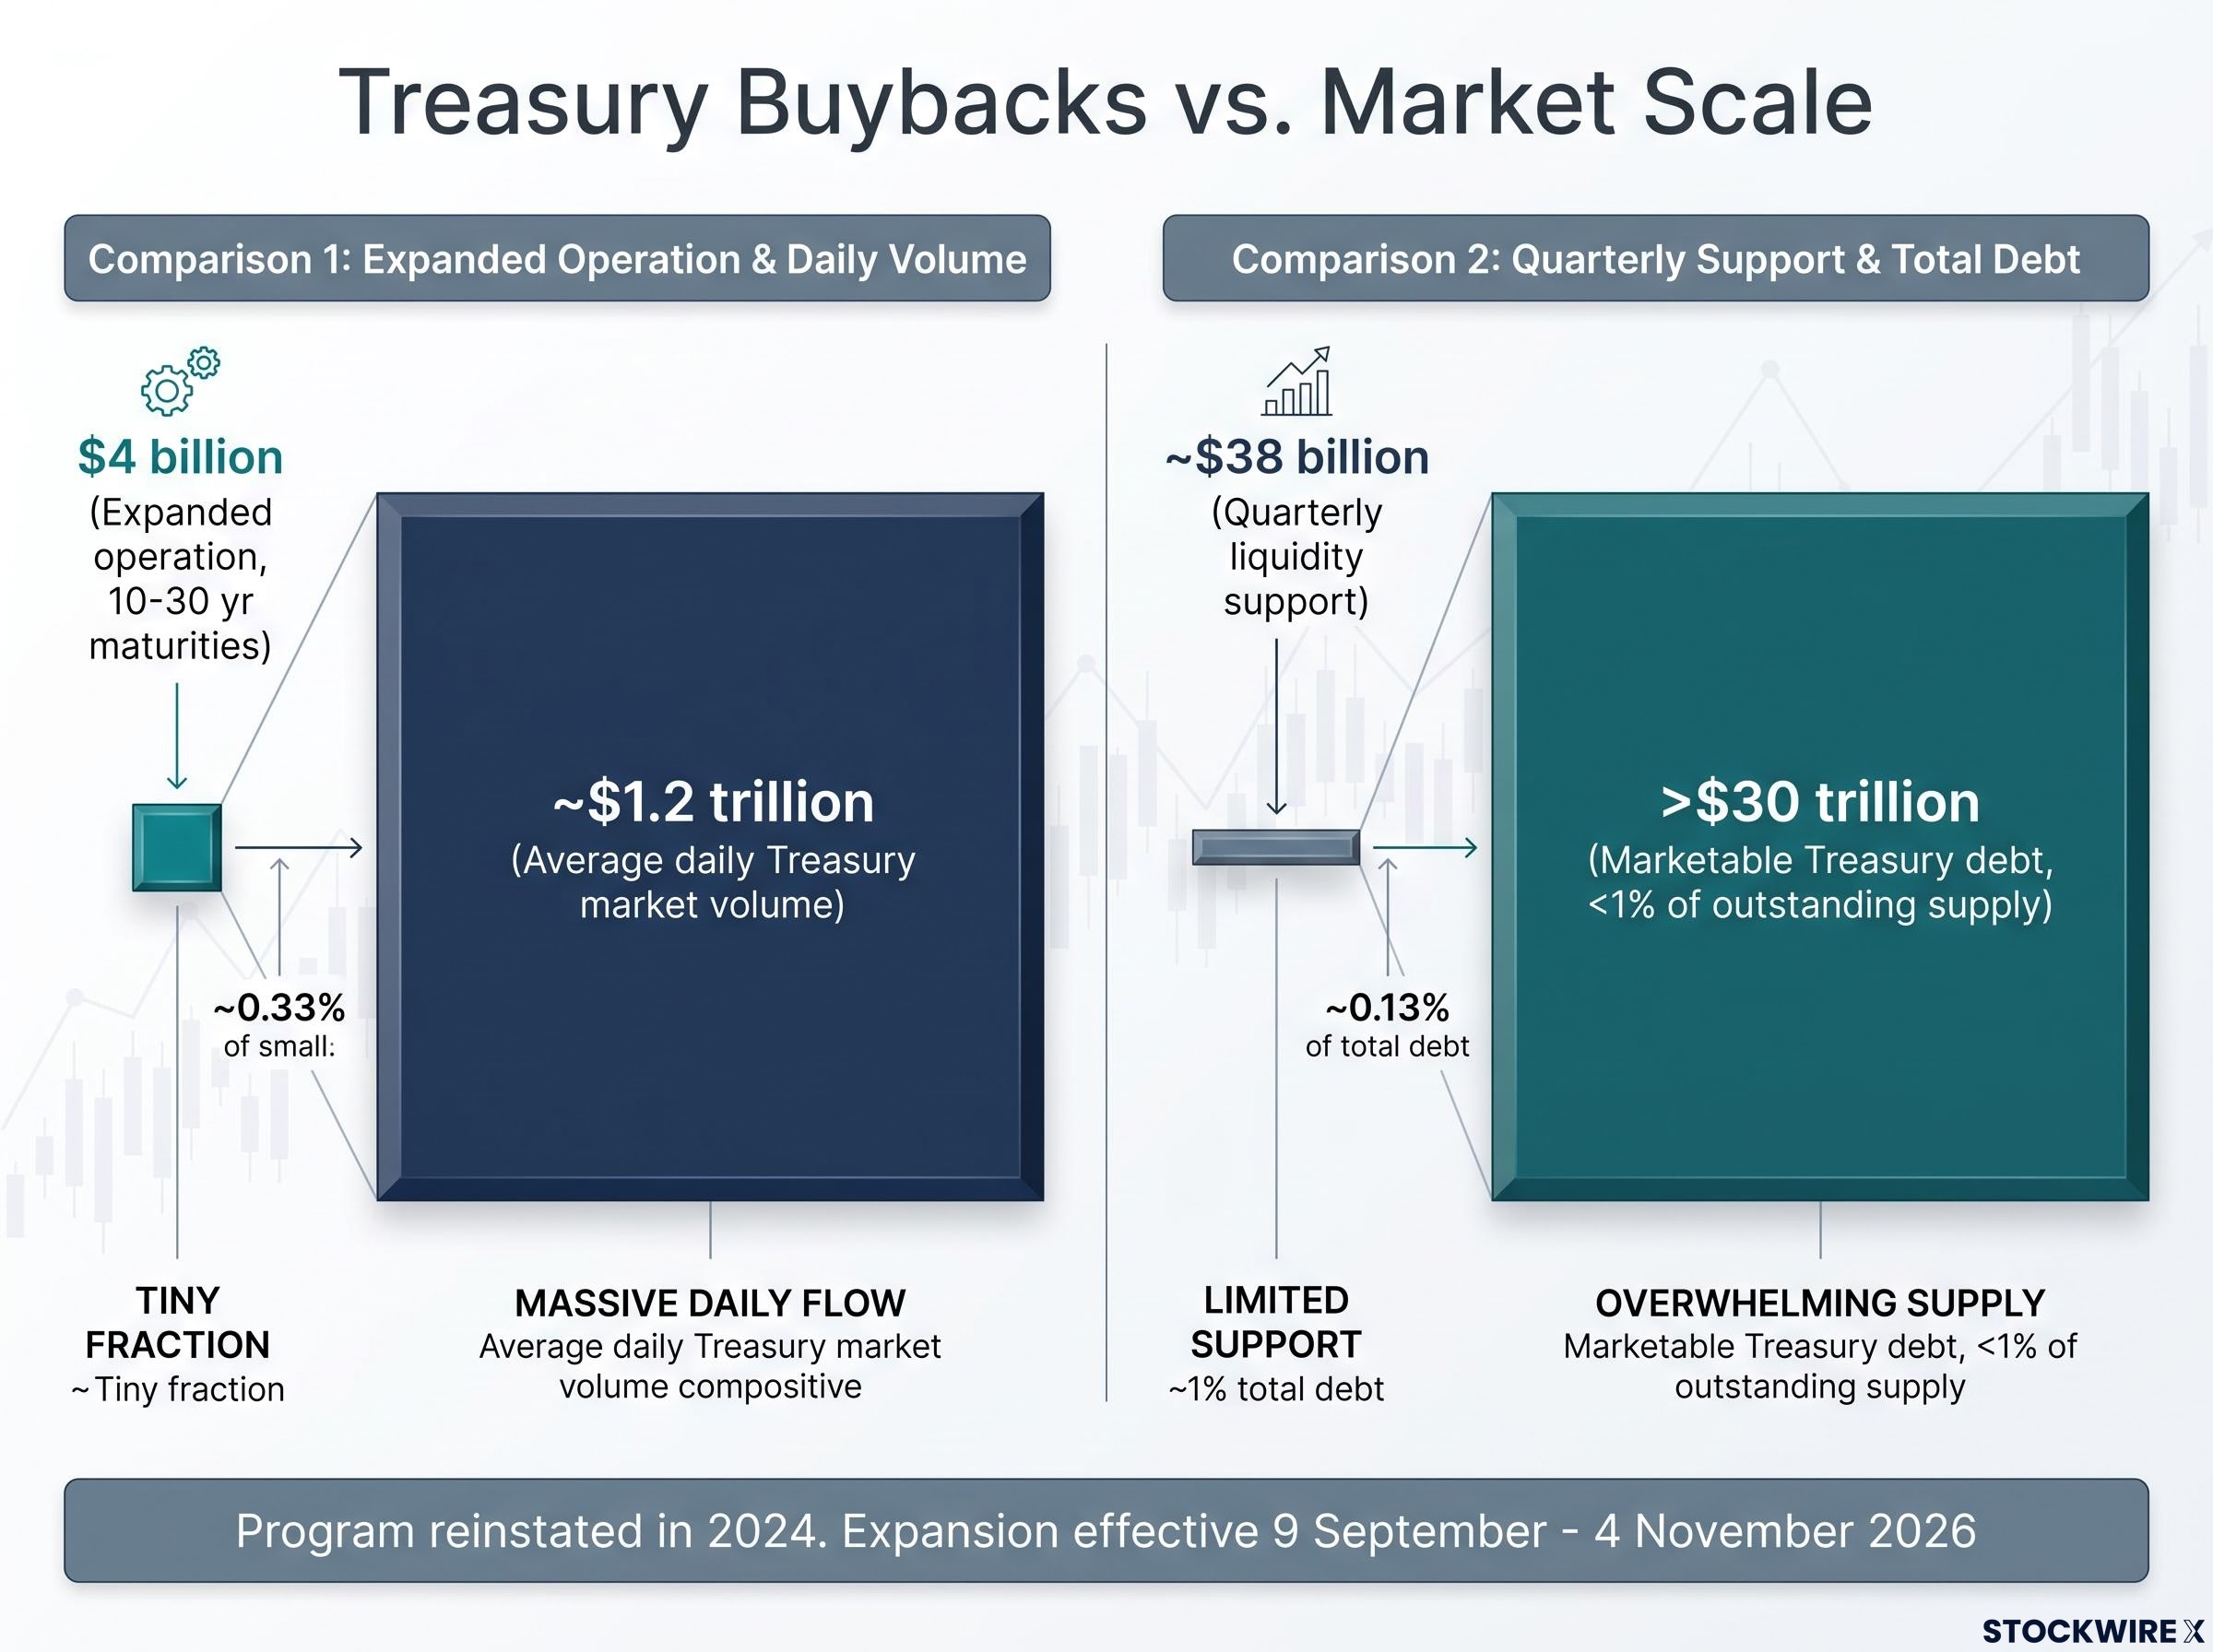
On 19 August 2026, the Treasury announced an expansion of its long-end buyback operations. Operations targeting 10-20 year and 20-30 year maturities will be doubled from $2 billion to at least $4 billion per operation, effective 9 September through 4 November 2026.
Before any alarm interpretation takes hold, consider the scale:
- Each $4 billion operation represents only a small slice of the roughly $1.2 trillion that changes hands in the Treasury market on an average trading day, making it negligible in relative terms.
- The quarterly liquidity support allocation of roughly $38 billion sits against more than $30 trillion in marketable Treasury debt. That is well under 1% of outstanding supply.
- Since the Treasury reinstated a formal buyback programme in 2024, the focus has been on improving liquidity in off-the-run issues (bonds that have been outstanding for some time and trade less actively than newly issued securities). Purchasing older, less liquid bonds in this manner is an established component of routine sovereign debt management, not an emergency intervention.
The Treasury’s stated objective is supporting liquidity and market functioning in longer-dated nominal sectors, consistent with routine curve management rather than crisis aversion.
The expansion tells you the Treasury is focused on improving secondary-market liquidity in less actively traded longer-dated issues. It does not tell you the government is struggling to find buyers or managing an impending funding shortfall. Misreading routine liquidity operations as distress signals can push you toward incorrect conclusions about Treasury market health.
Treasury buyback signal mechanics explain why the 19 August announcement moved the 30-year yield by 9-14 basis points in a single session despite the programme representing just 0.04% of incremental market support: the market reacted to what the operation implied about Treasury’s intentions, not to the raw dollar volume of purchases.
This article is for informational purposes only and should not be considered financial advice. Investors should conduct their own research and consult with financial professionals before making investment decisions.
What the $40 trillion milestone actually changes, and what it does not
The milestone confirms a challenging long-run fiscal trajectory that belongs in your macro outlook. Gross debt has more than doubled from pre-pandemic levels, primary deficits continue to compound, and interest costs are consuming a growing share of federal revenue. None of that is new information, and none of it changed on 19 August.
What the milestone does not represent is a near-term regime change in how the Treasury market functions. The bond market had already priced this trajectory. Auction demand remains solid. The buyback programme expansion is a minor technical factor in curve trading, not a portfolio-level signal.
The most useful thing you can take from this milestone is a refreshed monitoring framework, not a new allocation decision triggered by the number itself. Here is what to watch:
- Auction bid-to-cover ratios in core maturities: sustained declines below historical norms would signal weakening demand from voluntary buyers.
- Yield-curve shape and term premium: rising term premiums driven by credit-risk repricing (as opposed to inflation or monetary policy expectations) would mark a qualitative shift in how the market views US fiscal risk.
- Demand composition at long-end auctions: a persistent increase in primary-dealer absorption, with reduced participation from foreign central banks and institutional investors, would suggest structural demand is thinning.
- Publicly held debt funding conditions: the $32 trillion in market-financed debt, not the $40 trillion gross figure, is the appropriate reference point for ongoing risk assessment.
Past performance does not guarantee future results. Financial projections are subject to market conditions and various risk factors.
Investors who leave with this checklist, rather than a binary verdict of crisis or no-crisis, are better positioned to respond to how fiscal conditions actually evolve over the next 12-24 months. The $40 trillion figure tells you where the US has been. These four variables tell you where it is heading.