Markets closed last week celebrating Nvidia’s earnings, but beneath the AI-driven headline rally, three macro forces are moving simultaneously in a direction that has not yet been priced. Investors tracking the surface and missing the backdrop may be the most exposed when the adjustment comes.
On 26 August 2026, fewer than five commodity vessels transited the Strait of Hormuz. Federal Reserve officials at Jackson Hole are signalling that rate cuts are not close. Canada is preparing $27.6 billion in counter-tariffs set to take effect 8 September. None of these risks is operating in isolation: they are reinforcing each other through shared inflation, rate, and supply-chain channels, and their combined effect on the investment environment is meaningfully different from what any single risk would produce on its own.
Here is what the data actually tells you about the macro environment beneath the surface rally, where the specific pressure points sit in a typical US portfolio, and which dates and variables matter most in the weeks ahead.
Hormuz is not closed, but the disruption is already severe enough to matter
Kpler ship-tracking data, as reported by Reuters, recorded just five commodity vessel crossings of the Strait of Hormuz on 26 August 2026. The previous day, that number was four.
Against a recent 10-day moving average of approximately 15 commodity vessels per day, the single-digit readings represent a drop of roughly two-thirds. Compared with the pre-war norm of well over 130 total ship transits daily across all vessel categories, the waterway is operating at a small fraction of its historical throughput.
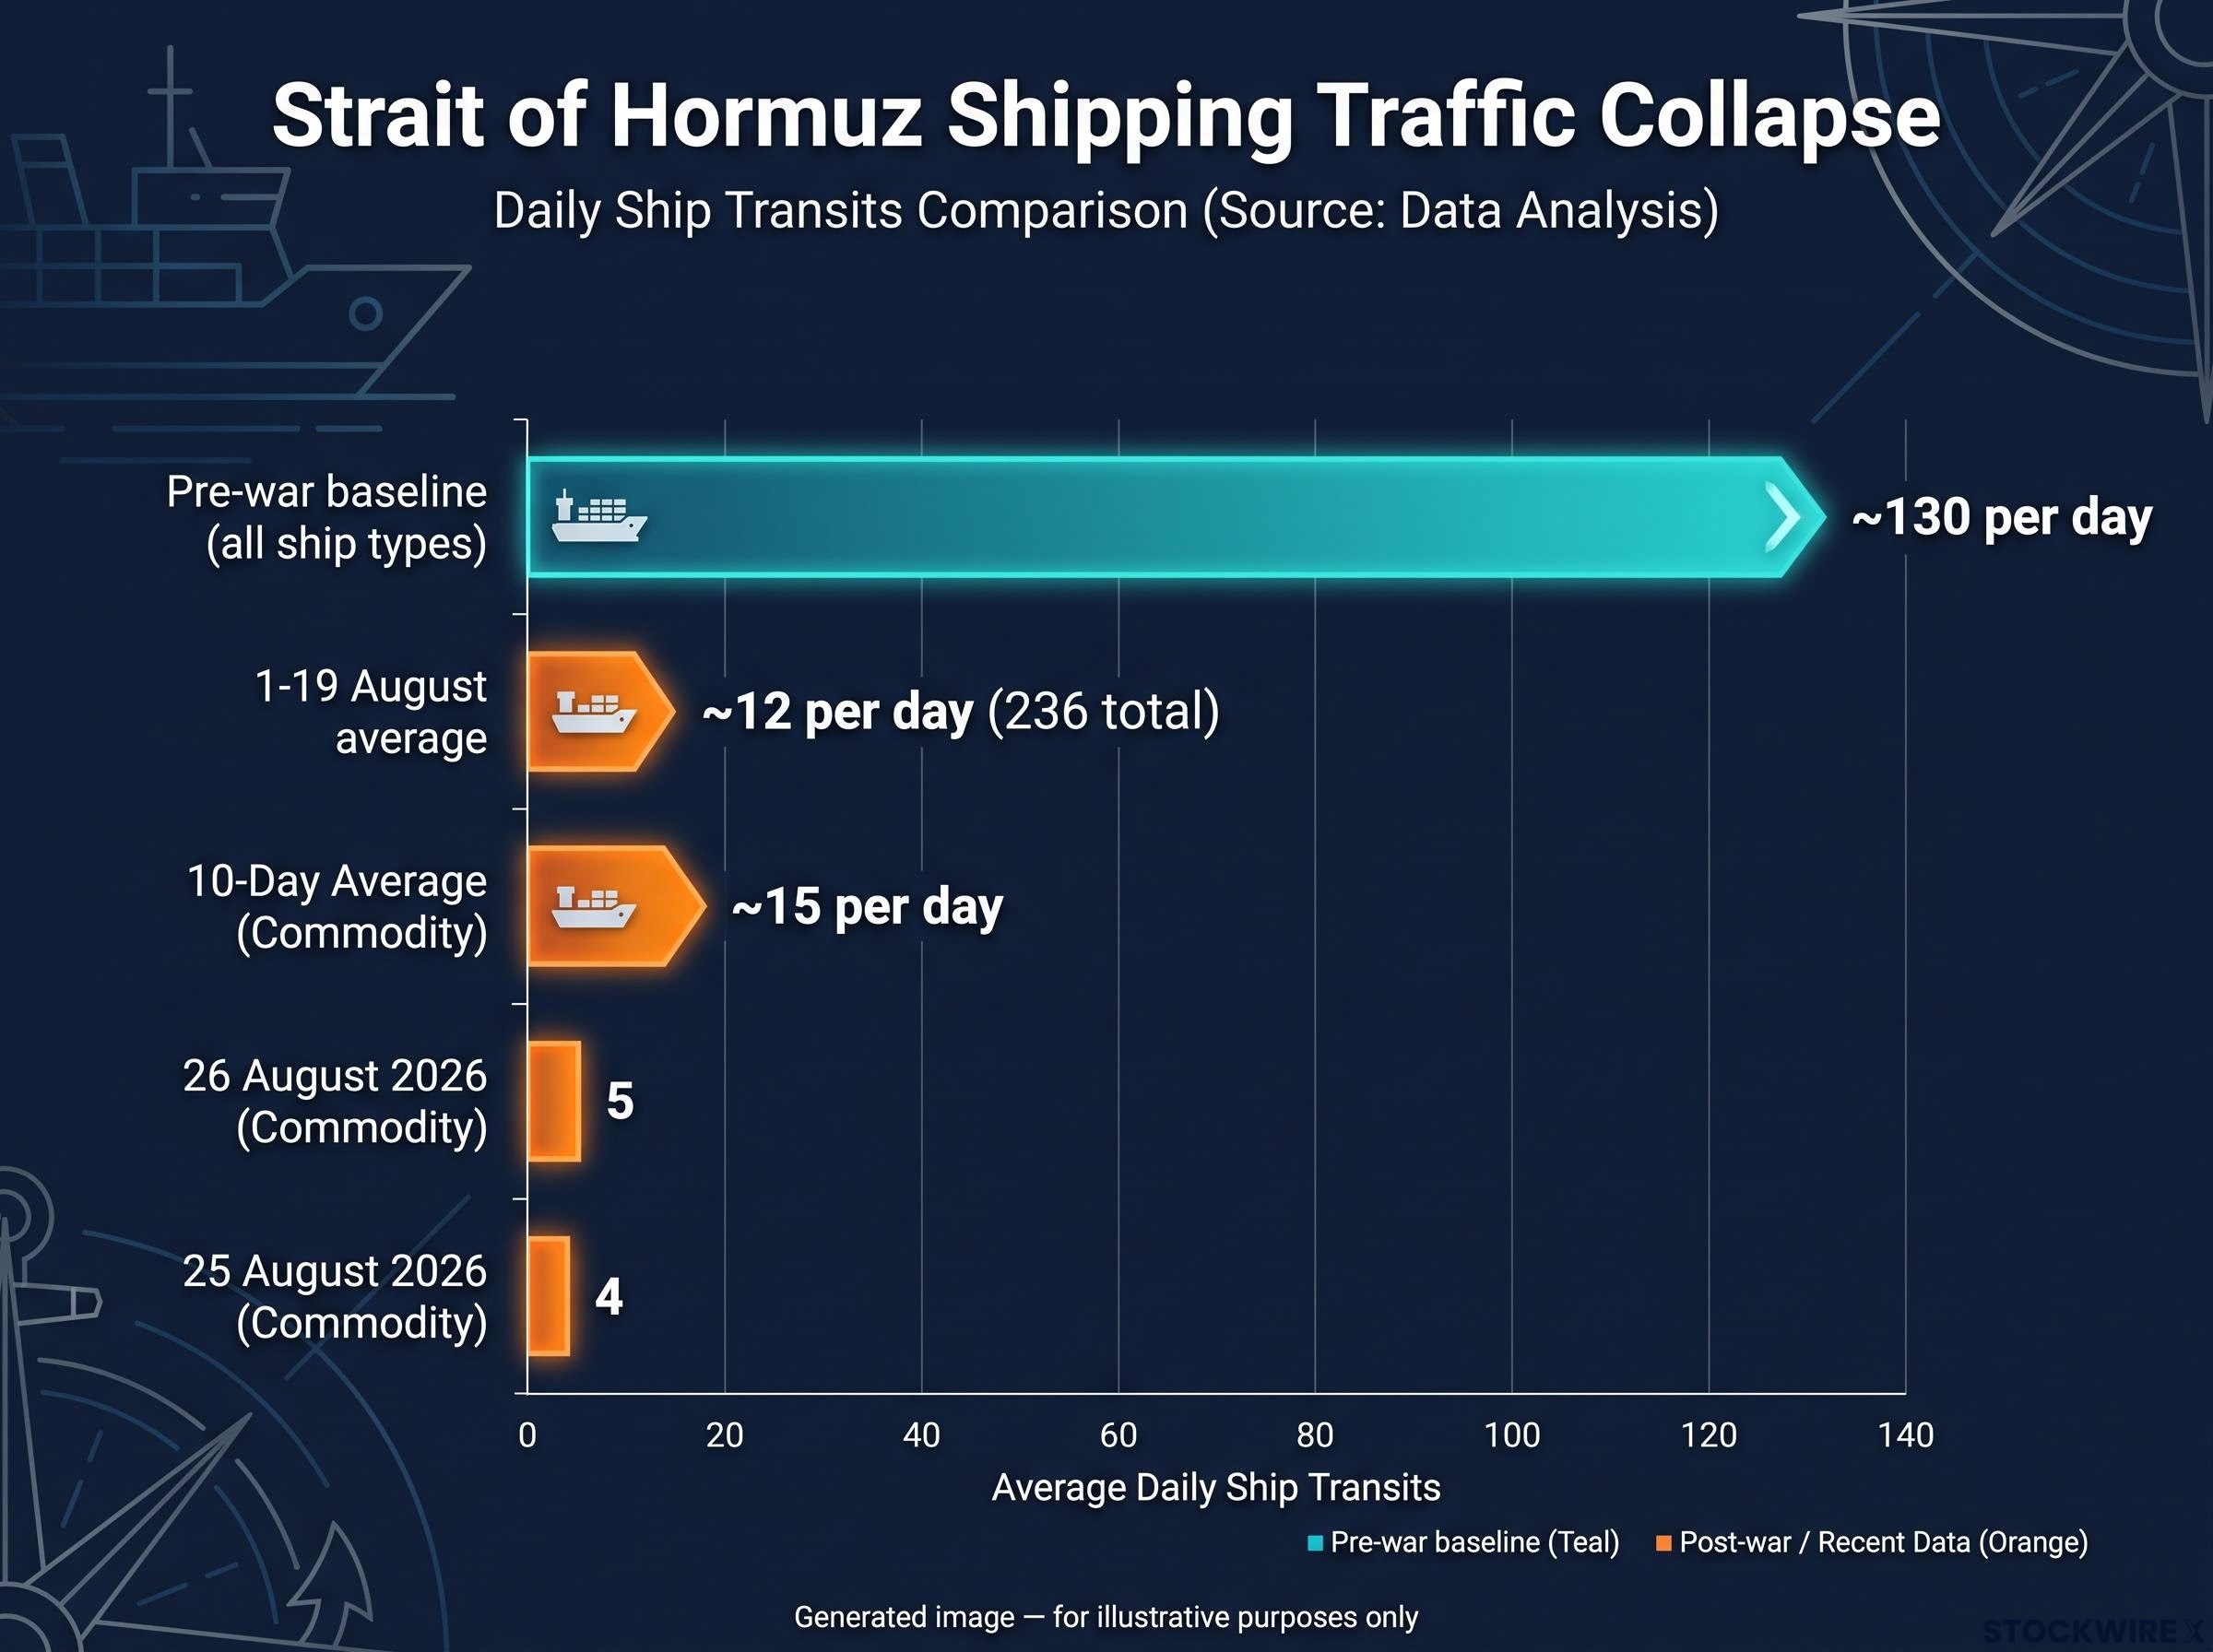
It is worth being precise about what these numbers measure. The four-to-five ship figures refer specifically to commodity vessels, meaning oil, LPG, and similar cargo. Total transits of all ship types have been higher: an Al Jazeera analysis using Kpler data recorded 236 ships of all types between 1 and 19 August, roughly 12 per day. That is still less than a tenth of the pre-war baseline.
| Metric | Pre-War Baseline | 10-Day Average (Commodity) | Recent Daily Range (Commodity) |
|---|---|---|---|
| Daily transits | ~130 (all ship types) | ~15 per day | 4-5 per day |
The diplomatic stalemate holding flows down
The traffic numbers tell you that Hormuz is not a tail risk that may materialise. It is the current condition, and it is sustaining upward pressure on energy prices and headline inflation right now.
Qatar’s prime minister has travelled to Tehran for de-escalation talks. Iran’s security chief Mohsen Rezaei has indicated that Tehran is drawing up a set of conditions to put to Washington before any reopening of the Strait of Hormuz can be considered. The White House has made clear it has no intention of returning to the framework of a prior memorandum of understanding with Iran, with continued economic pressure the preferred approach. An Iran-Oman corridor agreement offers a partial workaround for some commercial shipping, but it is a workaround, not a resolution.
Until a genuine diplomatic breakthrough changes the flow picture, the energy risk premium is structural. Investors relying on continued disinflation to justify Fed easing assumptions need to reckon with that directly.
The Hormuz shipping crisis carries an important structural distinction: war-risk insurance premiums are running at approximately 30 times normal rates and maritime unions have classified the waterway as an active war zone, meaning a diplomatic ceasefire declaration alone cannot restore commercial flows even if the political conditions for one materialised.
When big ASX news breaks, our subscribers know first
What Fed officials at Jackson Hole are actually signalling about rate cuts
Cleveland Fed President Beth Hammack used the Jackson Hole platform to reiterate her view that the current moment calls for tighter policy action.
Kansas City Fed President Jeffrey Schmid went further. He described inflation as entrenched and resistant to progress, and raised doubts about whether the prevailing policy rate is doing enough to restrain economic activity.
According to Schmid, the Fed funds rate of 3.50%-3.75% cannot readily be characterised as sitting in restrictive territory, a view that cuts directly against the market assumption that policy is already sufficiently tight and that easing is simply a question of when.
- Hammack: Current moment calls for tighter policy action
- Schmid: Inflation stubborn and persistent; 3.50%-3.75% may not be genuinely restrictive
- Kevin Warsh: Set to give his inaugural address as Fed chair on Friday 28 August; his positioning relative to prior leadership remains unclear from public statements available at the time of writing
When multiple Fed officials independently characterise the same policy rate as insufficiently restrictive, the “cuts are coming soon” thesis supporting elevated tech multiples looks shakier than the Nvidia rally implies.
The signal is not limited to the US. South Korea’s central bank voted 6-1 to raise its benchmark rate by 25 basis points to 3.00%, marking back-to-back increases, and lifted its 2026 growth outlook to 3.3% from a previous forecast of 2.6%. Asia-Pacific policy is less dovish than market narratives had implied, reinforcing the point that the global rate environment is not softening on the timeline many portfolios have priced in.
The transmission mechanism is direct: if rate cuts are meaningfully delayed, real yields stay elevated, and the valuation support for long-duration assets, whether Treasuries, REITs, or high-multiple growth equities, compresses further. That is duration risk, and portfolios built on an easing assumption are carrying more of it than the headline rally suggests.
Understanding what makes these tariffs different from prior US-Canada friction
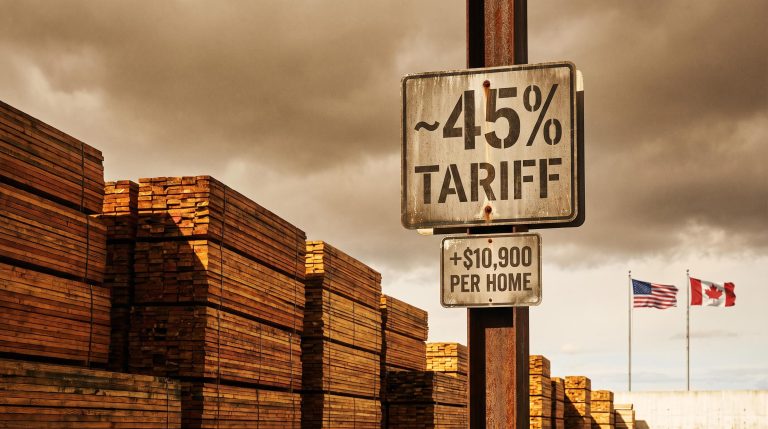
Canada’s counter-tariffs cover approximately $27.6 billion in US imports, effective 8 September 2026, at rates of 15%, 25%, and 50%, calibrated to match US tariff levels on overlapping products. Separately, approximately $20 billion worth of Canadian exports face US tariffs at the 50% rate, a different measurement reflecting the other side of the same trade wall.
Canada’s official counter-tariff announcement, published by the Department of Finance on 25 August, confirms the $27.6 billion import coverage and specifies the 15%, 25%, and 50% rate tiers across steel, dairy, appliances, agricultural equipment, pulp and paper, and electronics, giving investors a precise sector map of where cost pressure lands on 8 September.
The sector coverage is broad:
- Metals, including steel
- Dairy products
- Household appliances
- Farm and agricultural machinery
- Paper and related pulp products
- Consumer and industrial electronics
| Sector | Counter-Tariff Rate |
|---|---|
| Steel | 25% |
| Dairy | 25% |
| Appliances | 25% |
| Agricultural equipment | 15% |
| Pulp and paper | 15% |
| Electronics | 50% |
Why cross-border supply chain integration changes the tariff math
The numbers alone do not capture why this escalation matters more than a typical trade dispute headline. North American supply chains in autos, machinery, and industrials are deeply integrated across the US-Canada border. Components frequently cross that border multiple times during production, meaning a tariff applied once compounds across the chain rather than functioning as a single border cost.
The electronics angle is particularly relevant right now. It introduces additional cost and friction into hardware and components at a moment when tech sector valuations are already under pressure from rate sensitivity. That is not a hypothetical; it is a confirmed cost increase taking effect in 12 days.
Leading Canadian economists briefed Finance Minister François-Philippe Champagne with the assessment that the overall hit from the trade dispute was likely to remain within manageable bounds. If policymakers in Ottawa assess the hit as manageable, that could reduce their urgency to compromise, meaning US companies sitting inside these cross-border supply chains may need to absorb the cost increase rather than wait for a negotiated resolution.
For you as a US investor, the relevant question is not whether Canada retaliates. It is which companies in your portfolio sit inside these cross-border supply chains and are about to see their input costs rise from both sides simultaneously.
How the three risks are feeding each other into a tighter macro environment
These three forces are not sitting side by side. They are connected through a transmission chain where each risk amplifies the next:
- Hormuz sustains energy inflation. Sub-normal commodity flows keep upward pressure on headline and core inflation, preventing the disinflation progress central banks need to justify easing.
- Persistent inflation keeps the Fed hawkish. Sticky energy-driven inflation gives the Fed cover, and perhaps necessity, to maintain restrictive policy longer than markets had assumed. Real yields stay elevated. Valuation support for long-duration assets compresses.
- Higher rates and a stronger dollar compound trade friction. Elevated US rates and the resulting dollar strength complicate export competitiveness and trade diplomacy simultaneously. US-Canada tariffs raise input costs for manufacturers in autos, machinery, and electronics.
- Tariffs feed back into inflation. Higher input costs from tariffs flow through to consumer prices, adding to the inflationary environment already sustained by energy disruption. That further constrains the Fed’s ability to ease, completing the loop.
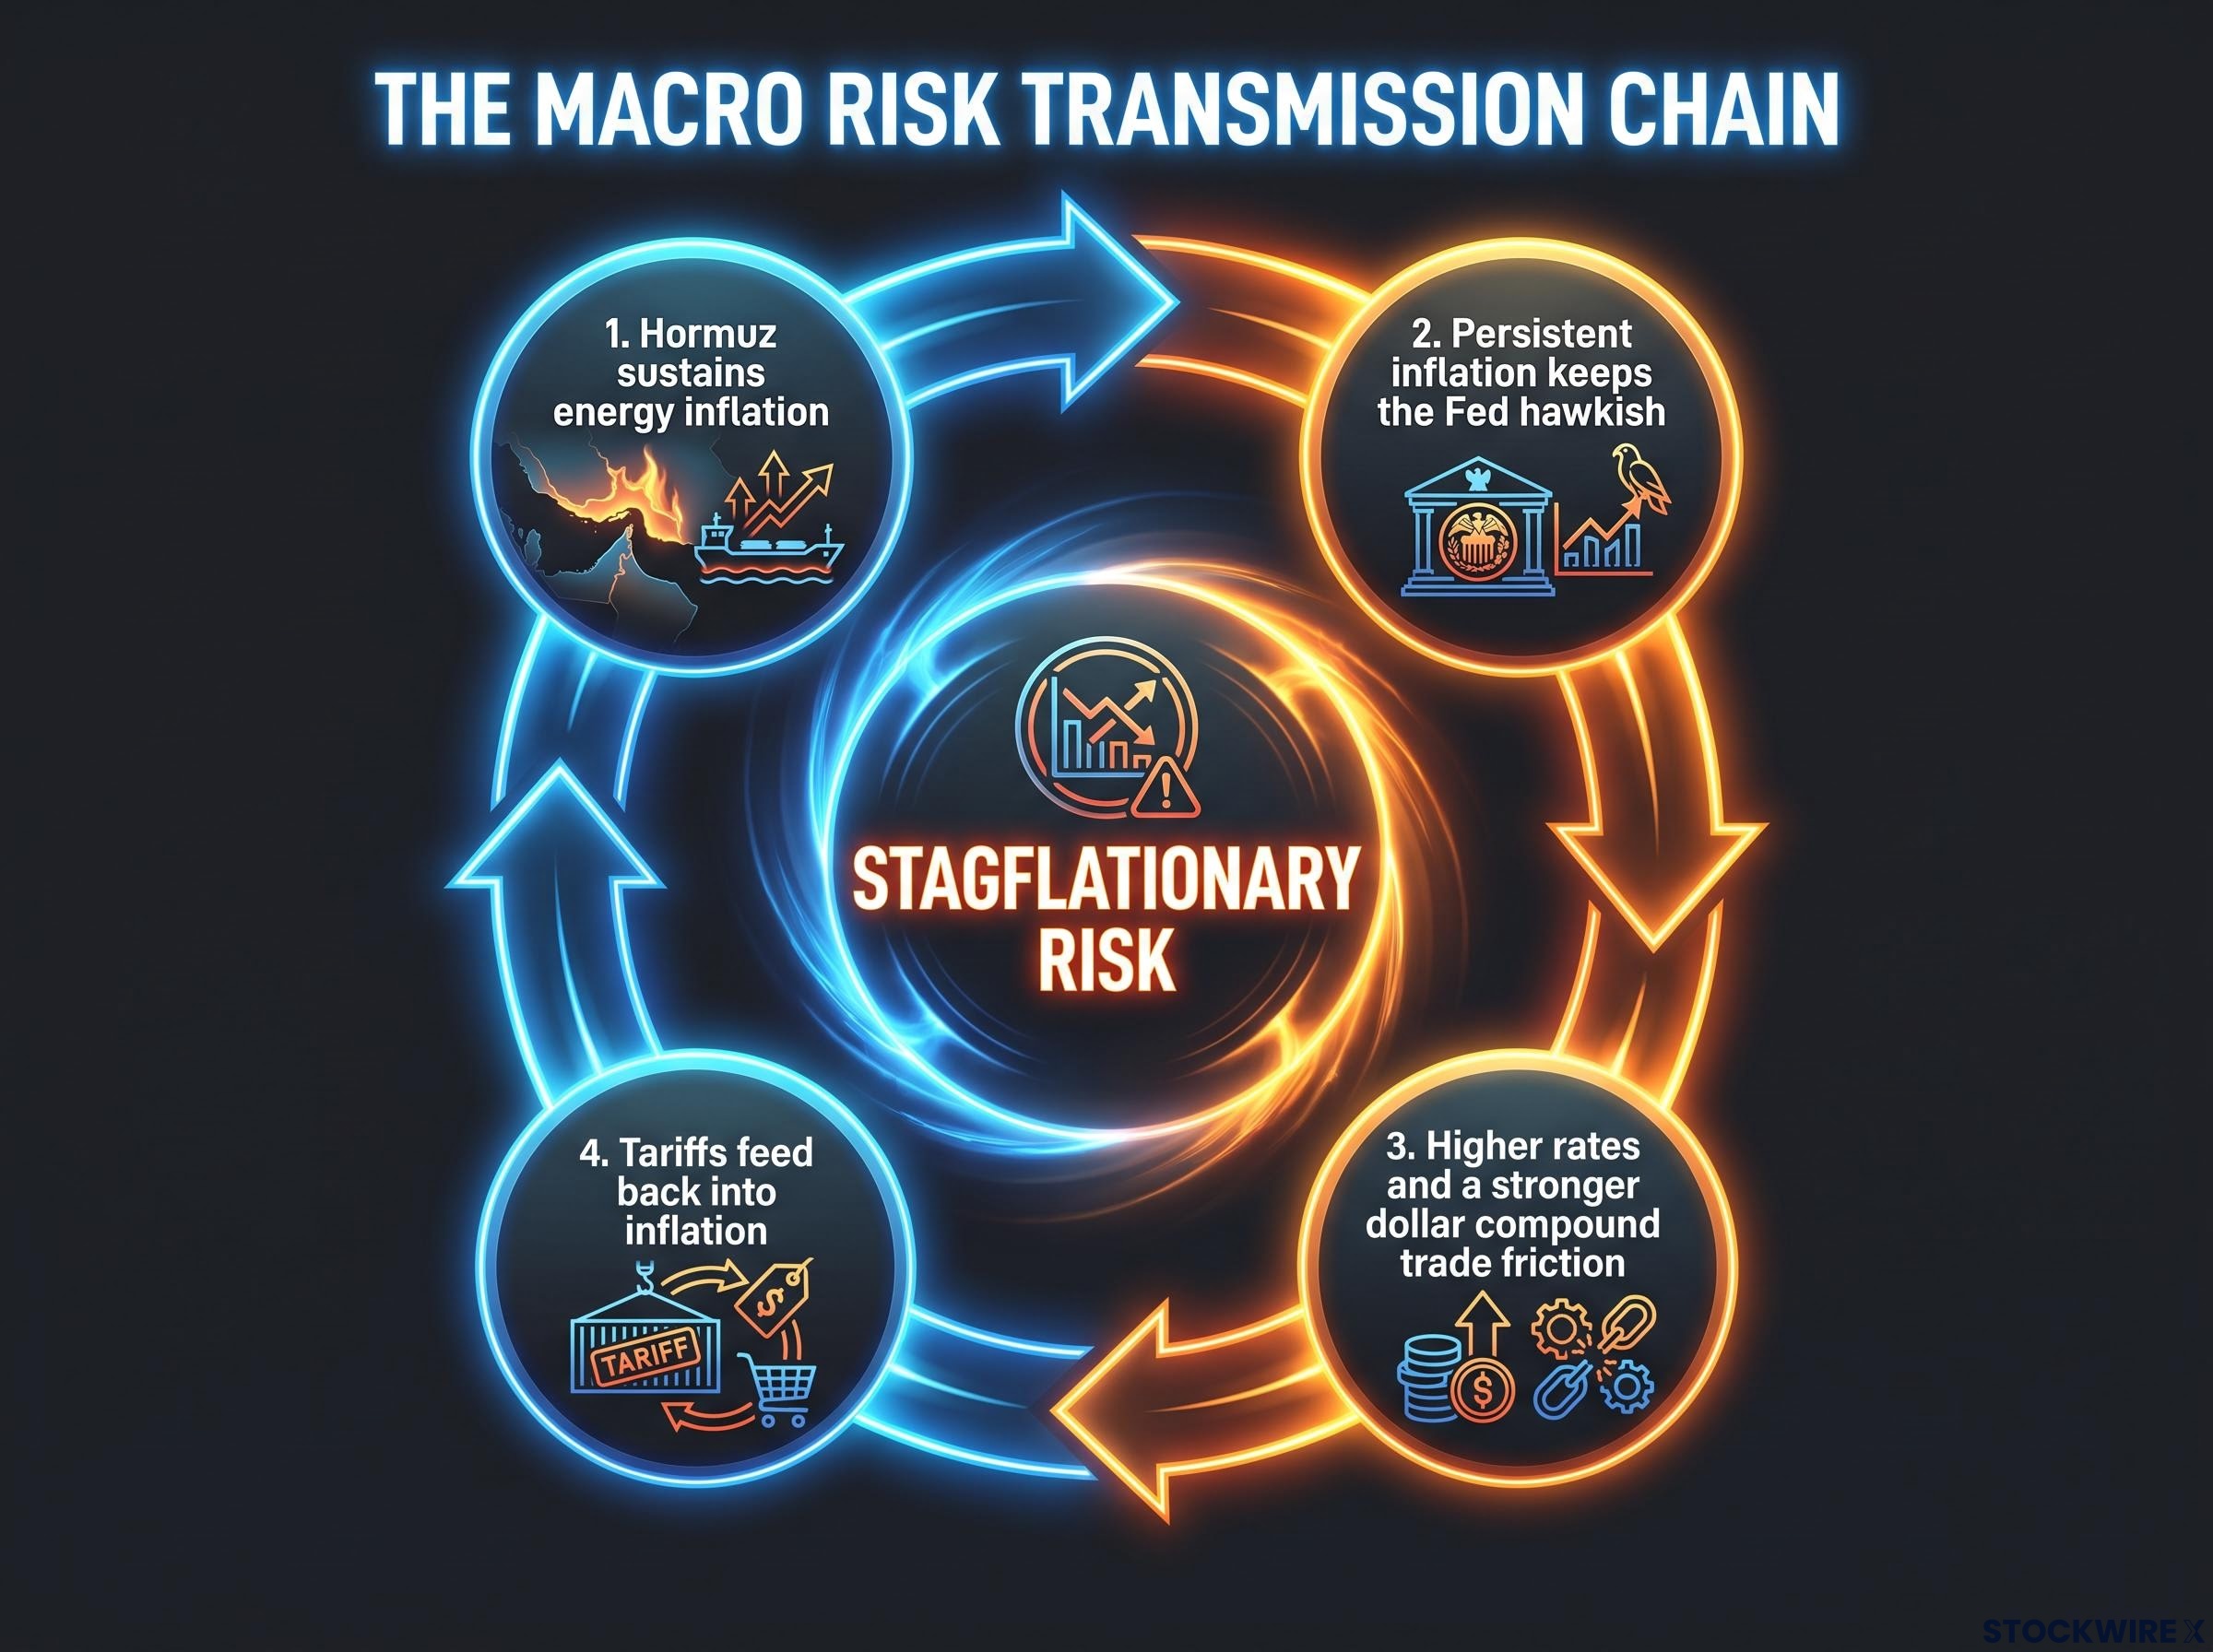
The risk at the intersection of these forces is stagflationary: inflation remains sticky while growth slows, and the Fed has no room to respond with cuts. That is the scenario most damaging for long-duration assets, and the current macro configuration is moving toward it, not away from it.
The stagflation threat was already visible in late July 2026, when Brent at $97.35 prompted Barclays strategists to warn that the April-to-July rally, led by financials and cyclicals, represented precisely the portfolio composition most exposed to the energy-and-rate repricing now accelerating into August.
The convergence is what makes this backdrop meaningfully different from three isolated headlines. None of these risks needs to worsen dramatically. The current configuration, held in place, is already enough to compress multiples and slow the disinflation that markets have been pricing in.
Where your portfolio is exposed and what the data suggests doing about it
The macro case is built. Here is where it lands in a typical US equity and fixed income portfolio:
- Reassess duration exposure first. Stress-test Treasuries, long-dated investment-grade corporates, and rate-sensitive equity sectors like REITs against a scenario where rate cuts are meaningfully delayed. This is not a prediction that cuts never arrive. It is a recognition that the evidence from Jackson Hole and the energy backdrop both point to “later than priced,” and duration-heavy portfolios are carrying more sensitivity to that outcome than the headline rally suggests.
- Build or maintain a measured energy overweight. Hormuz-driven structural supply constraint justifies upside bias in energy equities and select commodities. But position sizing matters: a diplomatic breakthrough could reverse the supply shock rapidly, and political headline risk is real. Size accordingly.
- Map your Canada exposure. Flag names with high cross-border supply-chain dependence or revenue sensitivity in the affected sectors:
- Steel
- Machinery
- Autos
- Appliances
- Pulp and paper products
- Electronics and hardware
The 8 September deadline converts this from a negotiating posture into a confirmed cost increase in less than two weeks.
The technology valuation question in a higher-for-longer environment
- Stress-test, do not exit, technology positions. Nvidia’s earnings confirm AI demand is real. But valuation multiples on high-growth tech names embed assumptions about discount rates that Hammack and Schmid are actively disputing from the Jackson Hole podium. Layer on tariff-driven input cost pressure (especially in electronics) and energy-price-driven reductions in consumer purchasing power, and the margin for error on multiples and margins narrows considerably.
Equity duration explains the mechanical severity of rate-driven drawdowns in growth stocks: Morgan Stanley estimates that a 100 basis point increase in real yields drives 3-4 turns of multiple compression in US growth names with no new fundamental information required, meaning much of what looks like fundamental repricing is a discount-rate adjustment the market has not fully completed.
The directive is not a blanket bearish call on tech. It is a framework question: which positions in your portfolio have enough margin for error to absorb a higher-for-longer rate environment, tariff-driven cost increases, and sticky energy inflation simultaneously? The ones that do not deserve tighter position sizing now, not after the repricing.
What the macro configuration looks like if nothing breaks by September
The 8 September Canadian counter-tariff effective date is the most proximate hard deadline. It converts the trade risk from a negotiating posture into a confirmed cost increase unless a deal materialises in the next 12 days. Once those tariffs take effect, the input-cost pressure on cross-border manufacturers becomes structural rather than threatened.
Hormuz is the variable with the highest asymmetry. A diplomatic breakthrough, potentially through the Iran-Oman corridor mechanism, would rapidly reverse the energy premium. Further deterioration would compound inflation across all three risk channels simultaneously. Watch the corridor’s actual throughput, not just the diplomatic statements around it.
The Iran-Oman corridor mechanism has been discussed as a partial workaround, but as of early August 2026 no formal agreement had restored routine commercial throughput, and five specific verification conditions, covering mine clearance, insurance resumption, and sustained traffic volume, remain unmet before any framework deal can be treated as a genuine reopening.
The Fed’s trajectory is the slowest-moving but most structurally significant variable. The next shift in tone depends on inflation data, and both Hormuz and the tariffs are making that data harder to improve. If energy-driven and tariff-driven inflation stays elevated through the autumn, rate cut expectations push further out, sustaining the pressure on every long-duration position in your portfolio.
Three variables to track in the weeks ahead:
- Hormuz diplomatic progress or deterioration: corridor throughput data and the outcome of Qatar-mediated talks in Tehran
- 8 September tariff deadline: whether any US-Canada negotiated framework emerges before counter-tariffs take effect
- Fed inflation data dependency: September and October CPI prints, which will either confirm or challenge the hawkish Jackson Hole posture
The current macro configuration does not require a dramatic escalation to become more damaging. It simply needs to persist. And 8 September removes one of the remaining off-ramps.
This article is for informational purposes only and should not be considered financial advice. Investors should conduct their own research and consult with financial professionals before making investment decisions. Forward-looking statements regarding Fed policy, trade negotiations, and energy markets are subject to change based on market developments and geopolitical conditions.