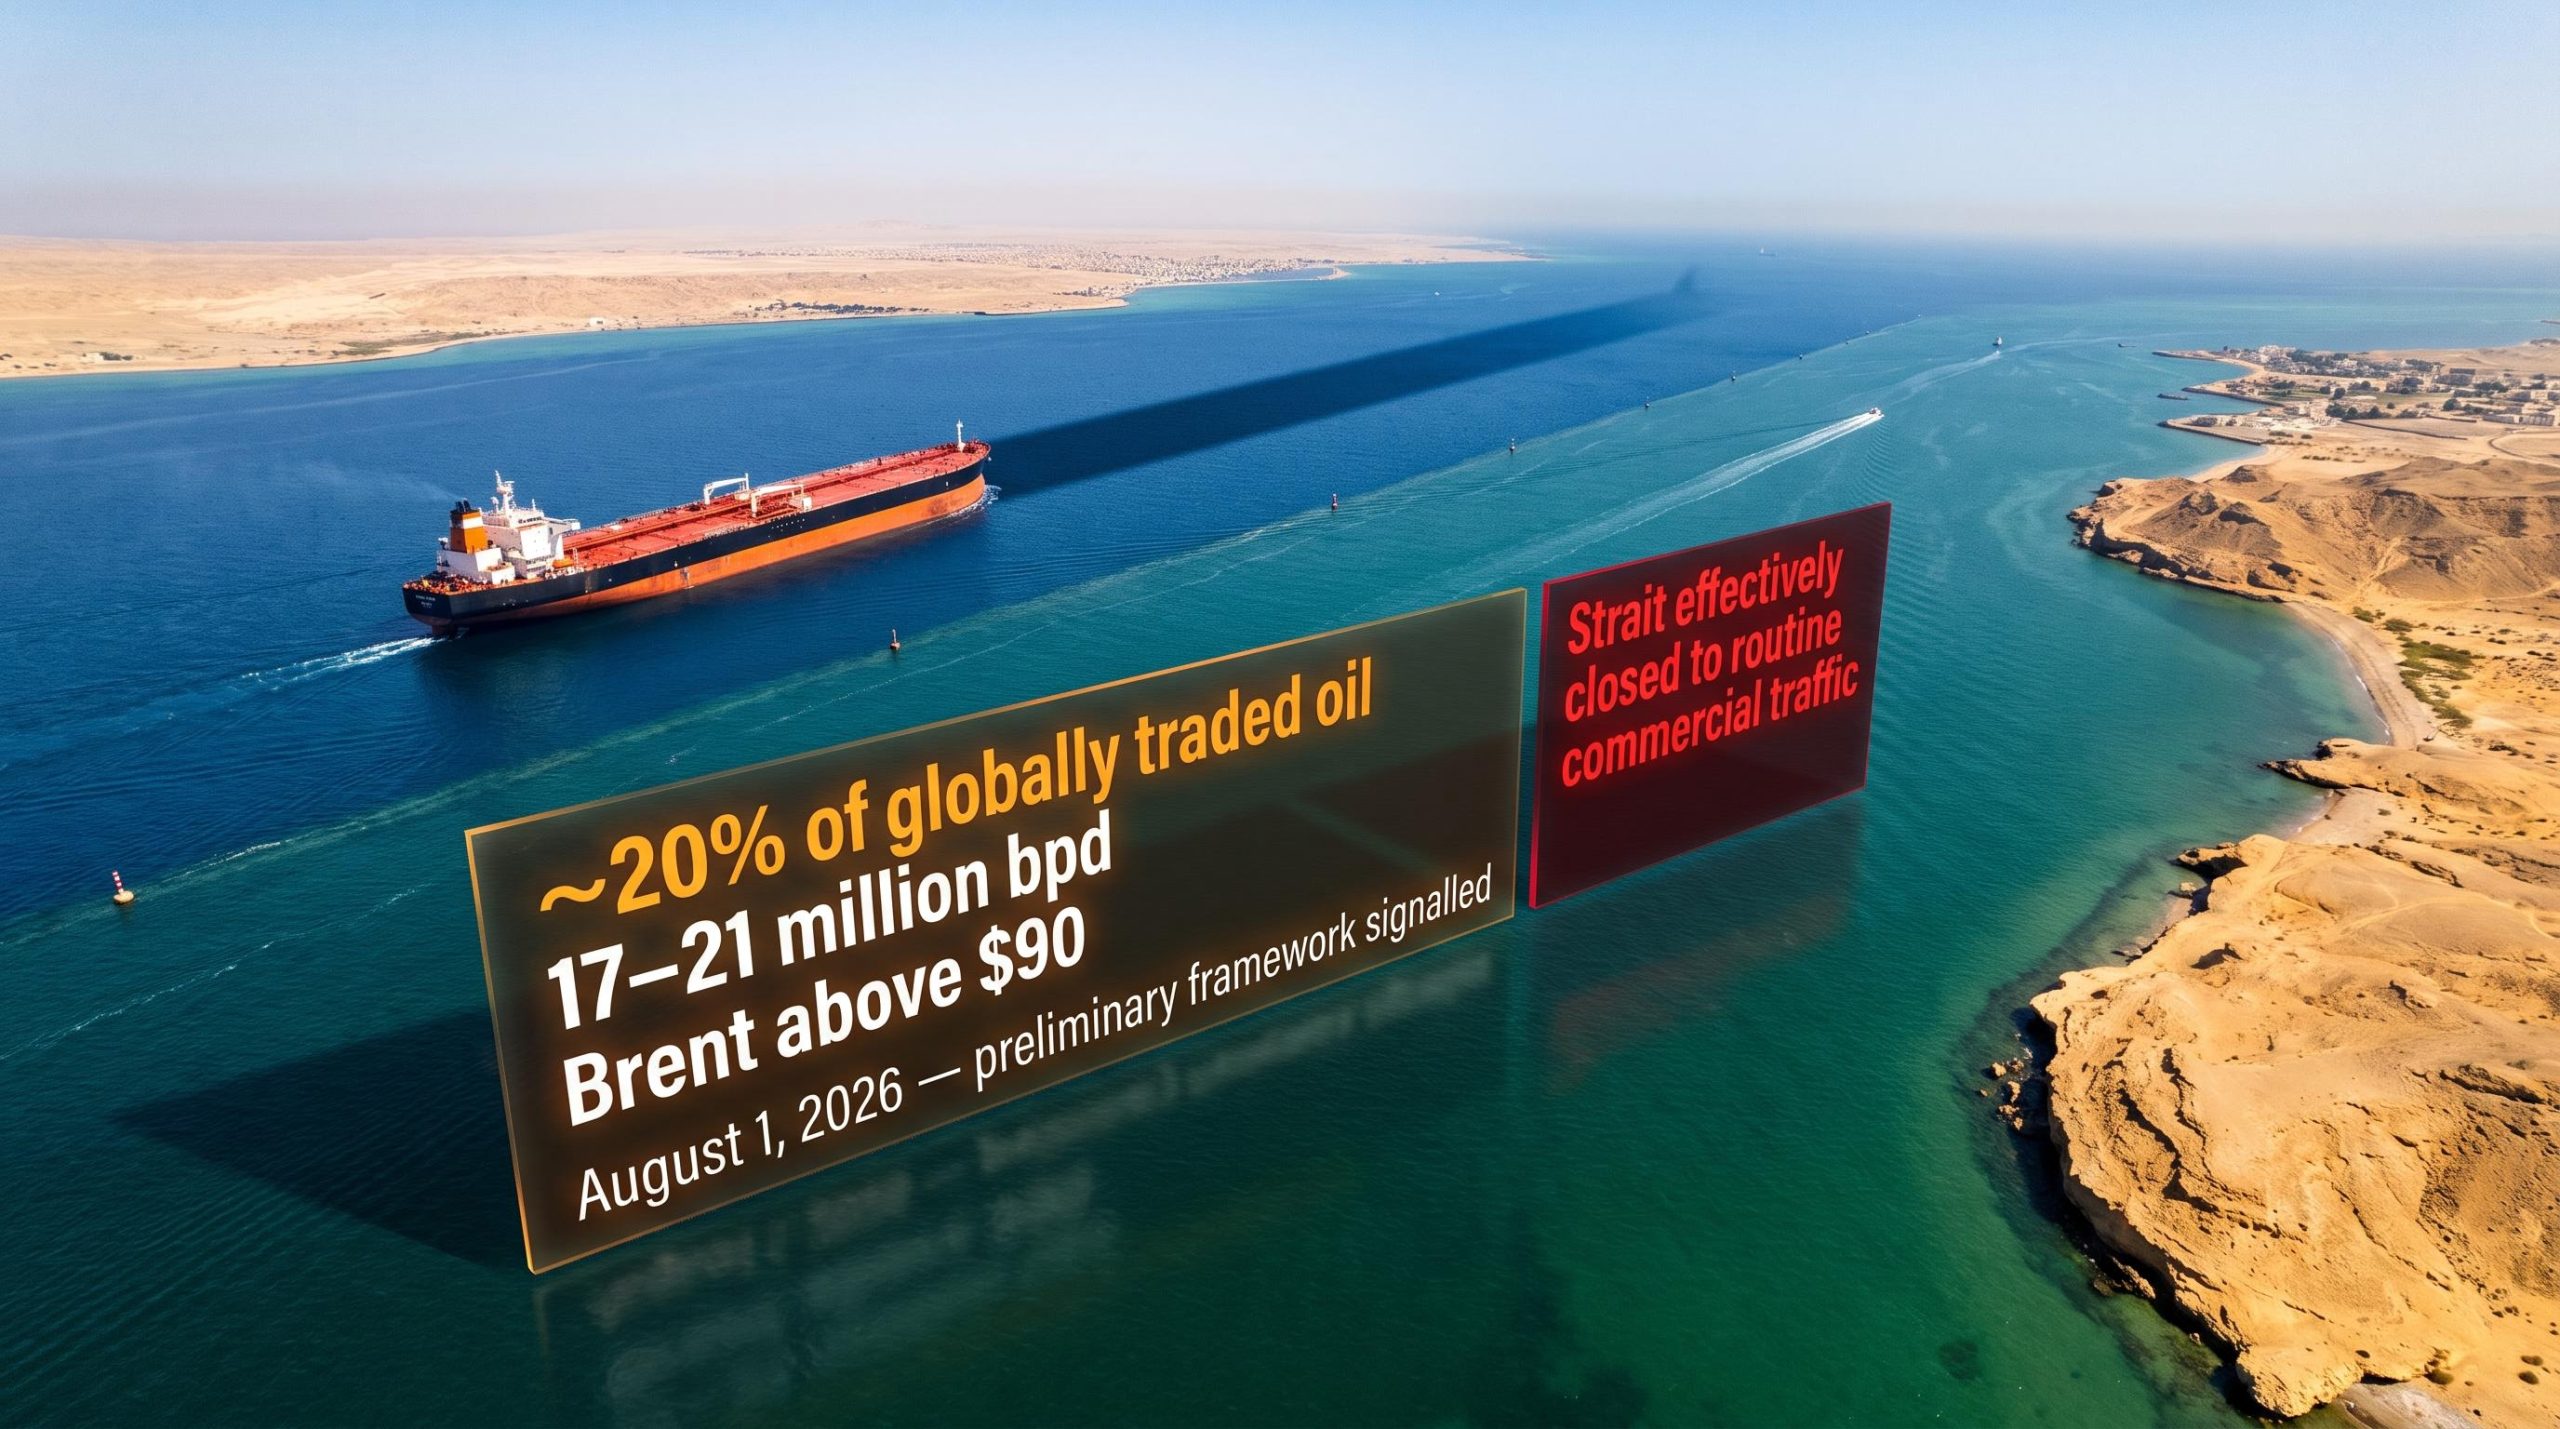
A 21-mile-wide channel between Oman and Iran is currently closed to routine commercial shipping, and roughly one-fifth of the world’s traded oil cannot move through it. On 1 August 2026, President Trump signalled a new preliminary agreement among allied parties that could reopen it. Markets moved on the headline.
The Strait of Hormuz has no adequate alternative route for the bulk of Gulf oil and LNG exports. A June 2026 US-Iran memorandum of understanding (MoU) briefly restored some traffic before collapsing in early July amid renewed fighting. The 1 August signal is the second attempt at a framework in less than two months, and energy markets are pricing the uncertainty of whether this one holds.
Here is exactly why this waterway commands such outsized influence over global oil prices, what the current diplomatic status actually means versus what the headlines suggest, and what a durable reopening or a renewed collapse would do to the energy assets most directly in the line of fire.
What Trump’s August 1 statement actually says, and what it does not
Trump’s 1 August statement, reported by Investing.com, indicated that allied parties in the Middle East had put together a preliminary deal structure containing terms aimed at restoring passage through the Strait of Hormuz. It is not a signed or implemented US-Iran arrangement. No shipping has resumed under it. No governance terms have been published.
This matters because the previous attempt looked more concrete on paper and still failed. The 17-19 June MoU was a formal interim document committing Iran to toll-free passage, committing the US to a staged naval blockade withdrawal, and opening a 60-day negotiating window toward a permanent deal. It collapsed before that window expired, amid renewed attacks in early July.
What the 1 August statement confirmed versus what remains unresolved:
Confirmed:
- Allied parties have reached a preliminary framework
- Provisions address the reopening of the Strait of Hormuz
- The statement signals continued US diplomatic engagement
Unresolved:
- No formal signed agreement between the US and Iran
- No implemented shipping arrangement as of 2 August 2026
- No governance terms for who controls transit
- No mine-clearance timeline or insurance coverage normalisation
- The Strait remains effectively closed to routine commercial traffic
The gap between a presidential signal and an implemented shipping arrangement is exactly where the June deal fell apart. That gap is where the risk exposure lives right now.
When big ASX news breaks, our subscribers know first
Why the Strait of Hormuz holds the global energy system hostage
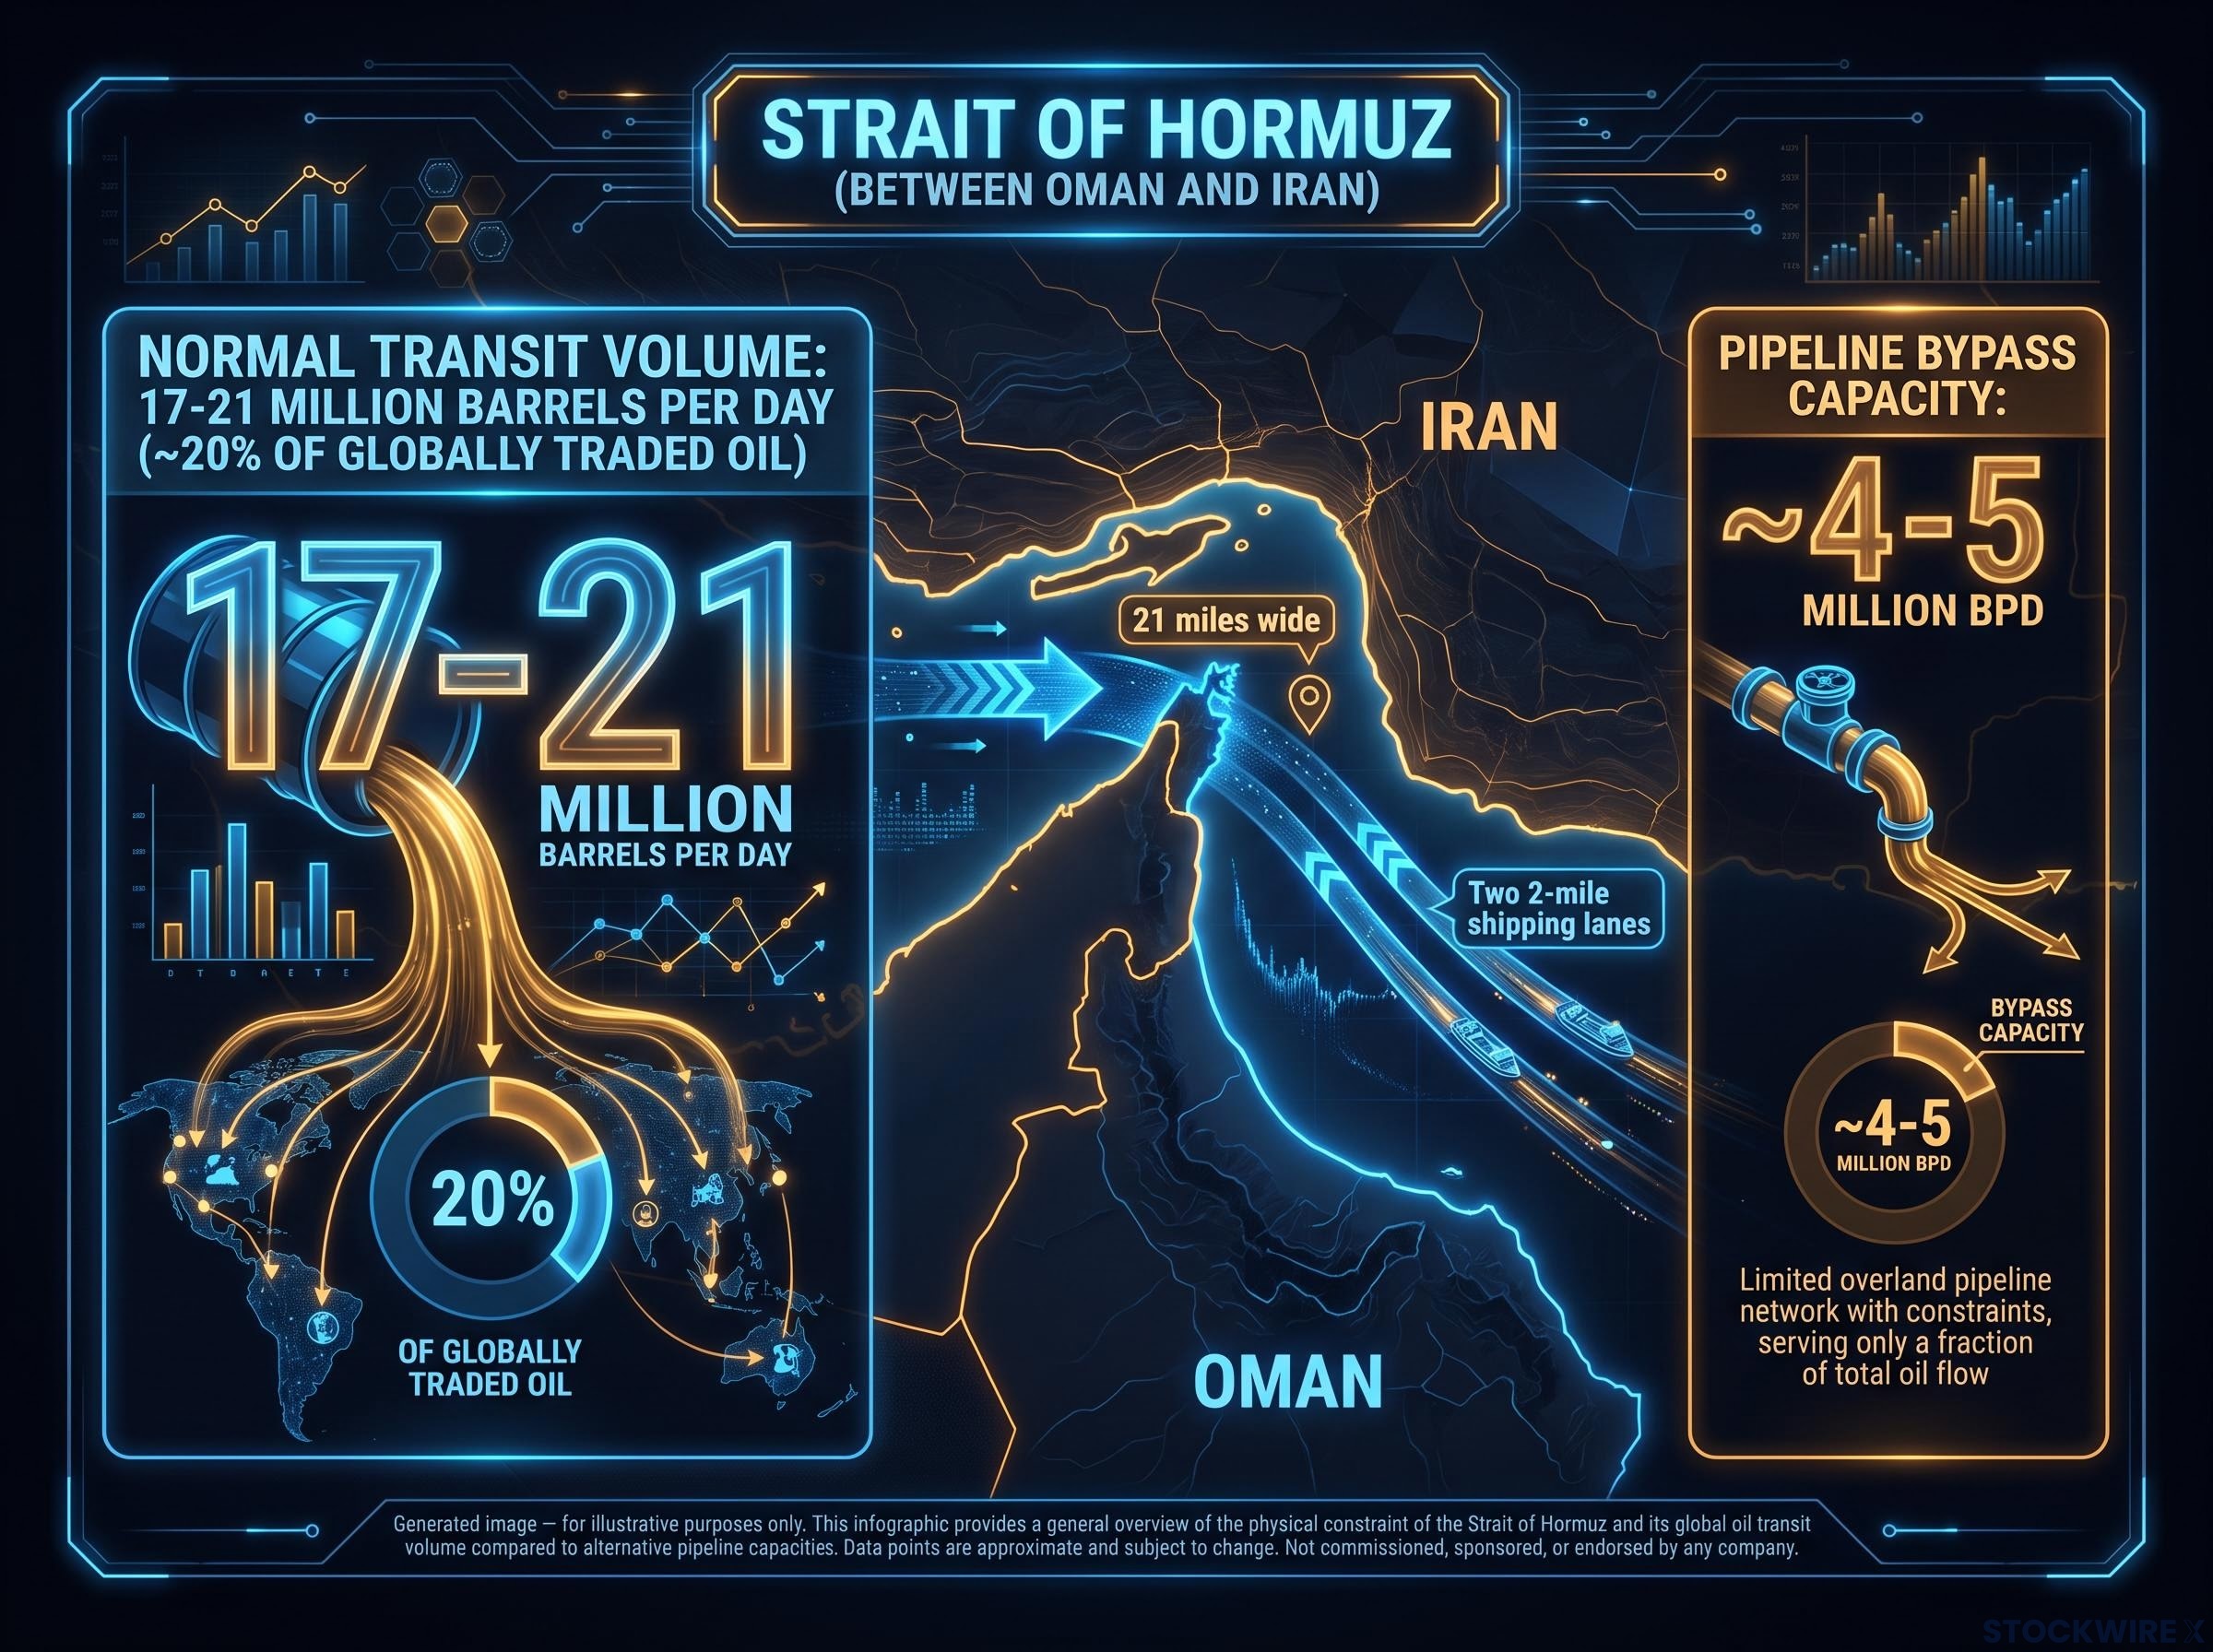
The Strait of Hormuz sits between Oman and Iran, just 21 miles wide, with two 2-mile shipping lanes separated by a buffer zone. Through this corridor flows roughly 17-21 million barrels per day of crude and condensate, representing approximately 20% of globally traded oil. Most seaborne exports from Saudi Arabia, Iraq, Iran, Kuwait, the UAE, Qatar, and Bahrain pass through it. Qatar’s LNG exports, which form a large share of global LNG trade, transit exclusively through Hormuz.
US Congressional research identifies Hormuz as the most strategically important oil chokepoint in the world. The table below shows why.
| Chokepoint | Daily volume (barrels) | Key exporters affected | Bypass capacity |
|---|---|---|---|
| Strait of Hormuz | 17-21 million | Saudi Arabia, Iraq, Iran, Kuwait, UAE, Qatar, Bahrain | ~4-5 million bpd (pipelines) |
| Suez Canal | ~5-6 million | Middle East to Europe/US flows | Cape of Good Hope (adds weeks) |
| Bab el-Mandeb | ~5-6 million | Red Sea transit, linked to Suez | Cape of Good Hope |
| Malacca Strait | ~15-16 million | Middle East to Asia flows | Lombok/Makassar Straits (longer routes) |
The bypass capacity problem
Saudi Arabia’s East-West Pipeline (Petroline) and the Abu Dhabi Crude Oil Pipeline together handle roughly 4-5 million barrels per day. Normal Hormuz transit exceeds 17 million barrels per day. The shortfall is not a planning failure; it is a physical and economic reality. Any serious disruption removes seaborne supply that simply cannot be replaced quickly, regardless of what OPEC or US producers do with their own output. No infrastructure investment in the near term changes this structural fact.
The bypass pipeline alternatives currently absorbing diverted Gulf volumes, including Saudi Arabia’s East-West Pipeline running near full capacity and the UAE’s Habshan-Fujairah pipeline delivering approximately 1.8 million barrels per day, are compressing refiner margins and lifting tanker rates rather than producing an outright upstream volume shortfall.
Iran’s leverage: how geography became a geopolitical weapon
Iran’s northern shoreline gives it direct physical access to the Strait, and that access predates any particular government or crisis. The leverage it creates is geographic before it is military.
Before the 2026 closure, Iran never had to shut the Strait to move markets. Credible threats alone, issued during periods of sanctions pressure, were enough to drive price spikes of several dollars per barrel. The threat itself functioned as a geopolitical instrument.
The 2026 crisis turned the threat into action. Iran’s closure and the associated US naval blockade removed roughly 20% of traded oil and LNG from normal flows, creating a historic energy shock. The question now is not whether Iran can exert this pressure but under what governance framework it agrees to stop doing so.
Iran has consistently insisted on retaining administrative control over which ships may pass. Oman, backed by other Gulf states, advanced a shared governance proposal under which Iran could collect voluntary fees but would not exercise sole control. That proposal remains unresolved. Any framework that does not address the governance question explicitly leaves the same pressure point in place for future crises, which is why markets are treating the 1 August signal as a probability shift rather than a resolution.
The Hormuz governance dispute has already produced one abrupt market reversal: in late May 2026, Brent fell approximately 4.87% in a single session after Iran rejected the US-backed framework over the question of permanent administrative control, erasing weeks of deal-driven price support and demonstrating exactly how quickly a preliminary framework can translate into a failed negotiation.
How oil markets are pricing Hormuz risk right now
Oil prices do not simply track barrels moving today. They reflect continuously updated probability distributions across multiple scenarios: full closure, partial transit, stable reopening, and everything between. The 2026 crisis has given markets three distinct repricing episodes to work with, and the pattern tells you how traders are weighting the current signal.
- June MoU signal (17-19 June 2026): The formal interim agreement produced a partial retracement in crude prices as traders assigned lower probabilities to prolonged supply disruption. Shipping briefly increased.
- July collapse (early July 2026): The MoU fell apart before its 60-day window expired. Crude prices resumed their risk premium as markets re-priced the probability of continued disruption upward.
- August 1 Trump statement: The new preliminary framework signal produced some relief, but a smaller move than the June MoU had generated, reflecting learned caution from the July breakdown.
Brent crude is trading above $90 per barrel as of early August 2026. WTI is above $84 per barrel. Both benchmarks carry a geopolitical risk premium that has not been fully unwound.
The spread between current prices and what a fully normalised Hormuz would imply is effectively the market’s estimate of the probability that this diplomatic effort also fails. That spread remains material. For investors holding energy positions or evaluating entry points, understanding the risk premium embedded in current prices is more useful than watching the headline number alone. The price on screen is a probability-weighted average of multiple scenarios, not a single forecast.
The Hormuz risk premium does not decompress in a straight line even after a ceasefire announcement; the IEA has projected a two-year supply chain recovery timeline under best-case resolution, and VLCC daily hire rates near $110,000 per day have historically moved faster than crude futures as a real-time signal of disruption severity.
What a durable reopening would actually do to energy assets
If the current diplomatic efforts evolve into a verified, long-term reopening, the effects would ripple across four distinct asset categories. The conditionality matters: these effects apply to a confirmed, sustained reopening, not the current preliminary signal.
| Asset category | Effect of durable reopening | Effect of renewed breakdown | Key variable to watch |
|---|---|---|---|
| Brent and WTI crude | Risk premium compresses; prices move lower | Premium widens; prices spike higher | Governance terms and verification regime |
| VLCC tanker rates | Spot rates normalise as rerouting risk falls | Rates stay elevated on dislocation | Insurance underwriting for Gulf routes |
| European TTF and Asian JKM gas | Qatar LNG flows resume; benchmarks ease | Supply tightness persists; benchmarks elevated | Qatar export volumes through Hormuz |
| Gulf-exposed energy equities | Risk discounts narrow; reduced volatility | Valuations remain compressed on disruption risk | Formal signed agreement and traffic data |
A genuine resolution is disinflationary at the macro level. Investors with positions in inflation-linked assets, energy equities, or tanker stocks need a clear view of which direction each exposure moves if the deal actually holds.
Saudi Aramco CEO Amin Nasser has warned that supply normalisation timeline estimates extend into 2027, a projection that aligns with the pattern the current crisis has followed: tanker traffic that collapsed from approximately 130 ships per day to just 2-5, and an estimated 880 million net barrels erased from global markets even before the July breakdown of the June MoU.
LNG and gas markets: the less-discussed Hormuz exposure
Qatar’s LNG exports transit Hormuz and directly affect European TTF and Asian JKM pricing, not just crude markets. Power utilities and industrial users in both regions carry exposure to this risk in ways that are entirely separate from crude oil positions. A durable reopening would relieve tension in gas markets that have been contending with elevated prices and supply uncertainty since the disruption began.
What needs to happen before markets can treat Hormuz as genuinely reopened
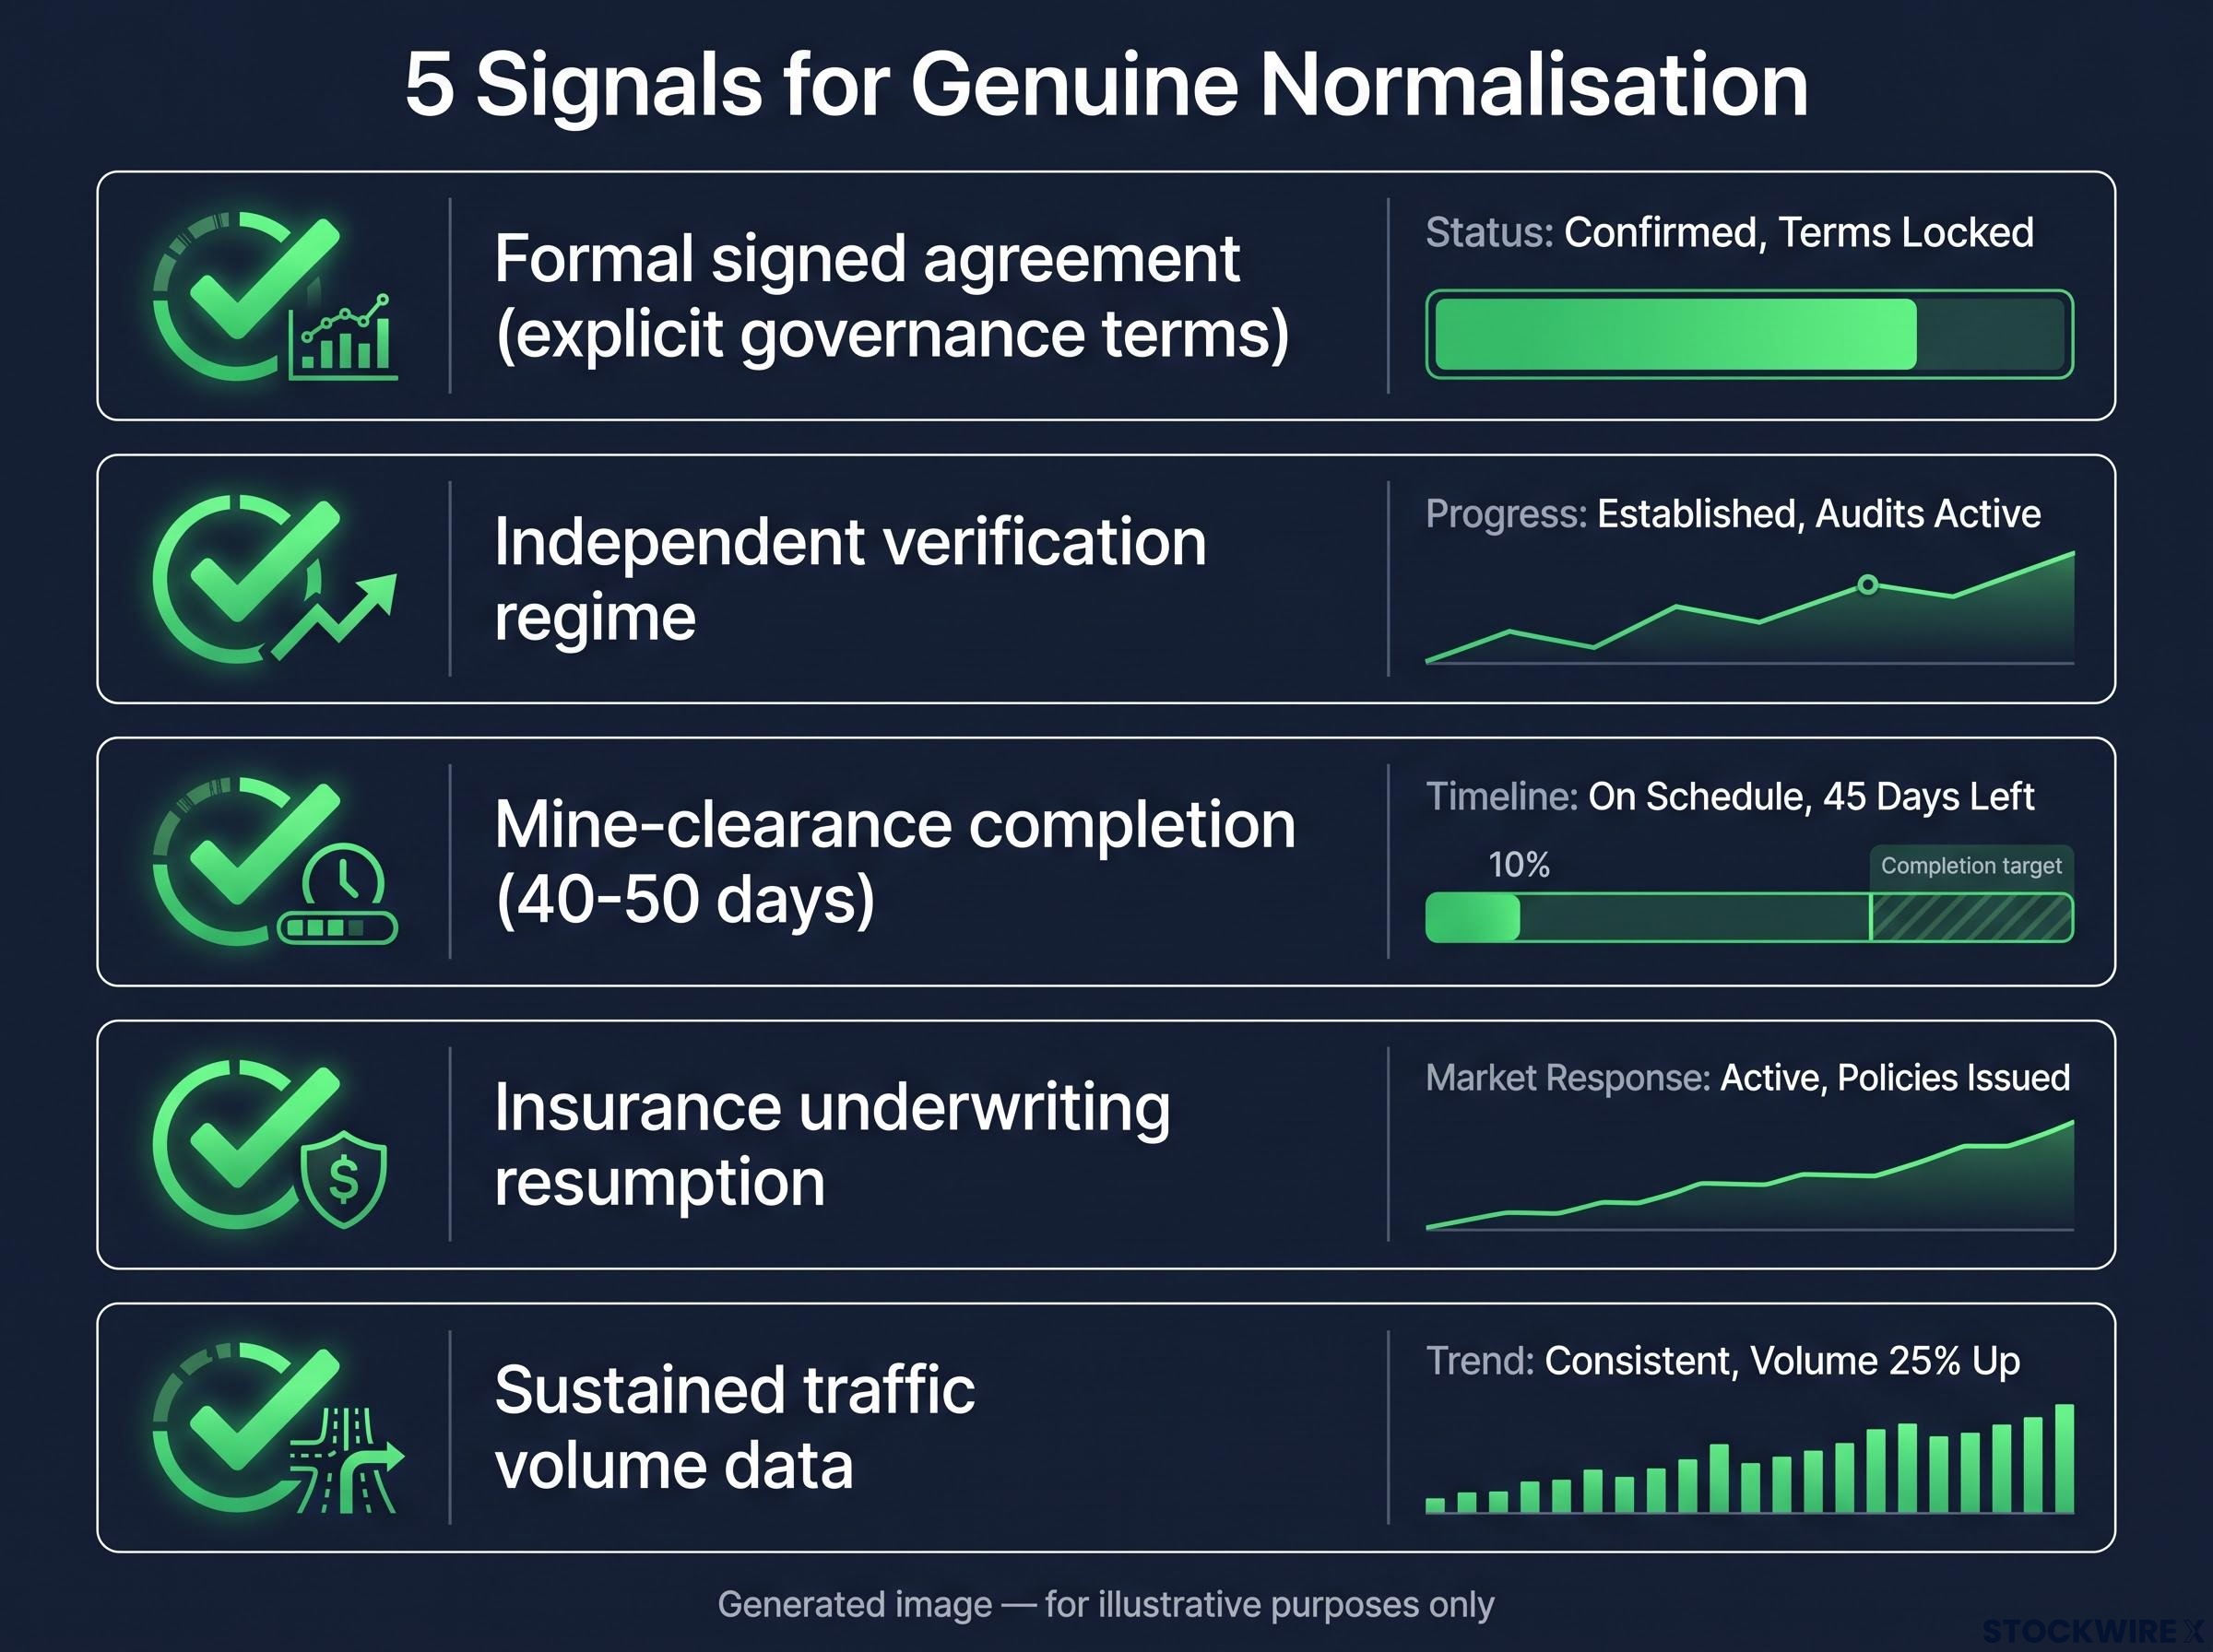
The distance between a presidential signal and normalised commercial shipping is measured in specific, observable steps. The June MoU demonstrated that a framework that looks stable can unwind within weeks. Five signals would indicate genuine normalisation:
- A formal signed agreement between the US, Iran, and allied parties with explicit governance terms for Strait transit
- An independent verification regime with a monitoring mechanism that does not rely solely on the parties’ self-reporting
- Mine-clearance completion, estimated at 40-50 days of sweeping operations before insurers and shipping companies would be comfortable returning to near-normal traffic
- Insurance underwriting resumption for Gulf shipping routes at non-crisis premium levels
- Traffic volume data showing sustained return toward pre-crisis norms, not a single-week spike
The Oman-brokered shared governance proposal, under which Iran collects voluntary fees but does not exercise sole administrative control, has no agreed enforcement mechanism. Until that question is resolved, any crude price move on diplomatic headlines alone is the market doing its own probability-weighting, not confirming an achieved outcome.
This article is for informational purposes only and should not be considered financial advice. Investors should conduct their own research and consult with financial professionals before making investment decisions. These forward-looking statements are speculative and subject to change based on market developments and diplomatic outcomes.
The deal is not done, but the signals to watch are now clear
Trump’s 1 August signal is diplomatically significant but operationally unverified. The June MoU precedent shows how quickly a framework can collapse. The risk premium embedded in current crude prices reflects precisely this uncertainty, and energy markets will continue repricing on each new development.
The variables are now named: governance terms, mine clearance, insurance normalisation, traffic data, and a formal signed agreement. The asset exposures are mapped. You are equipped to assess each new headline against the verification checklist rather than reacting to signals that may or may not translate into an operational reopening.