Gold is above $4,600 an ounce. The technicals are still pointing up. And Citi’s desk is telling clients the move is being held together by futures accounts, not the physical buyers who have historically defined where gold’s price floors actually sit.
That distinction matters more than the headline number. What separates a structural breakout from a speculative overshoot determines whether today is a buying opportunity or a trap, and the Federal Reserve’s Jackson Hole symposium, days away, represents an imminent test of the entire thesis.
Here is a framework for reading the current rally on your own terms: what the positioning data actually shows, where the structural floor sits based on physical demand signals, and how to think about the binary catalyst that lands on or around 28 August 2026 before it resolves.
Gold above $4,600 is a futures-led move, not a broad market conviction trade
The rally is real. But the buying is concentrated in a way that tells you something about its durability.
The bulk of gold’s price gains have been recorded during New York trading hours, with the metal largely going sideways or slipping back during Asian and European sessions. That pattern is characteristic of New York futures-led flows: commodity trading advisors (CTAs), hedge funds, and managed money accounts pushing prices higher during their active hours, with no follow-through from the rest of the world’s gold markets. When a move is this session-specific, it tells you the buyer base is narrow.
What positioning and technicals say about fragility
According to CFTC data, managed money net long positions stood at roughly 141,648 contracts in mid-to-late August 2026, sitting close to year-to-date peaks while remaining short of the record highs seen during the 2024-2025 cycle. Those are participants with short time horizons and a hair-trigger exit. When they crowd one side of the trade at these levels, the margin for error contracts sharply.
A speculative positioning unwind of that scale already happened in 2026: gold fell nearly 25% from its all-time high of $5,405 to a trough near $4,070, breaching the 200-day moving average for the first time in nearly three years and triggering systematic liquidations, even as military conflict, oil disruption, and elevated inflation data all ran simultaneously.
The CFTC Commitments of Traders reports classify market participants into categories including Managed Money, the speculative accounts whose net long positioning at roughly 141,648 contracts gives you a direct read on how much of the current gold rally is held by short-horizon futures traders rather than structural, long-horizon buyers.
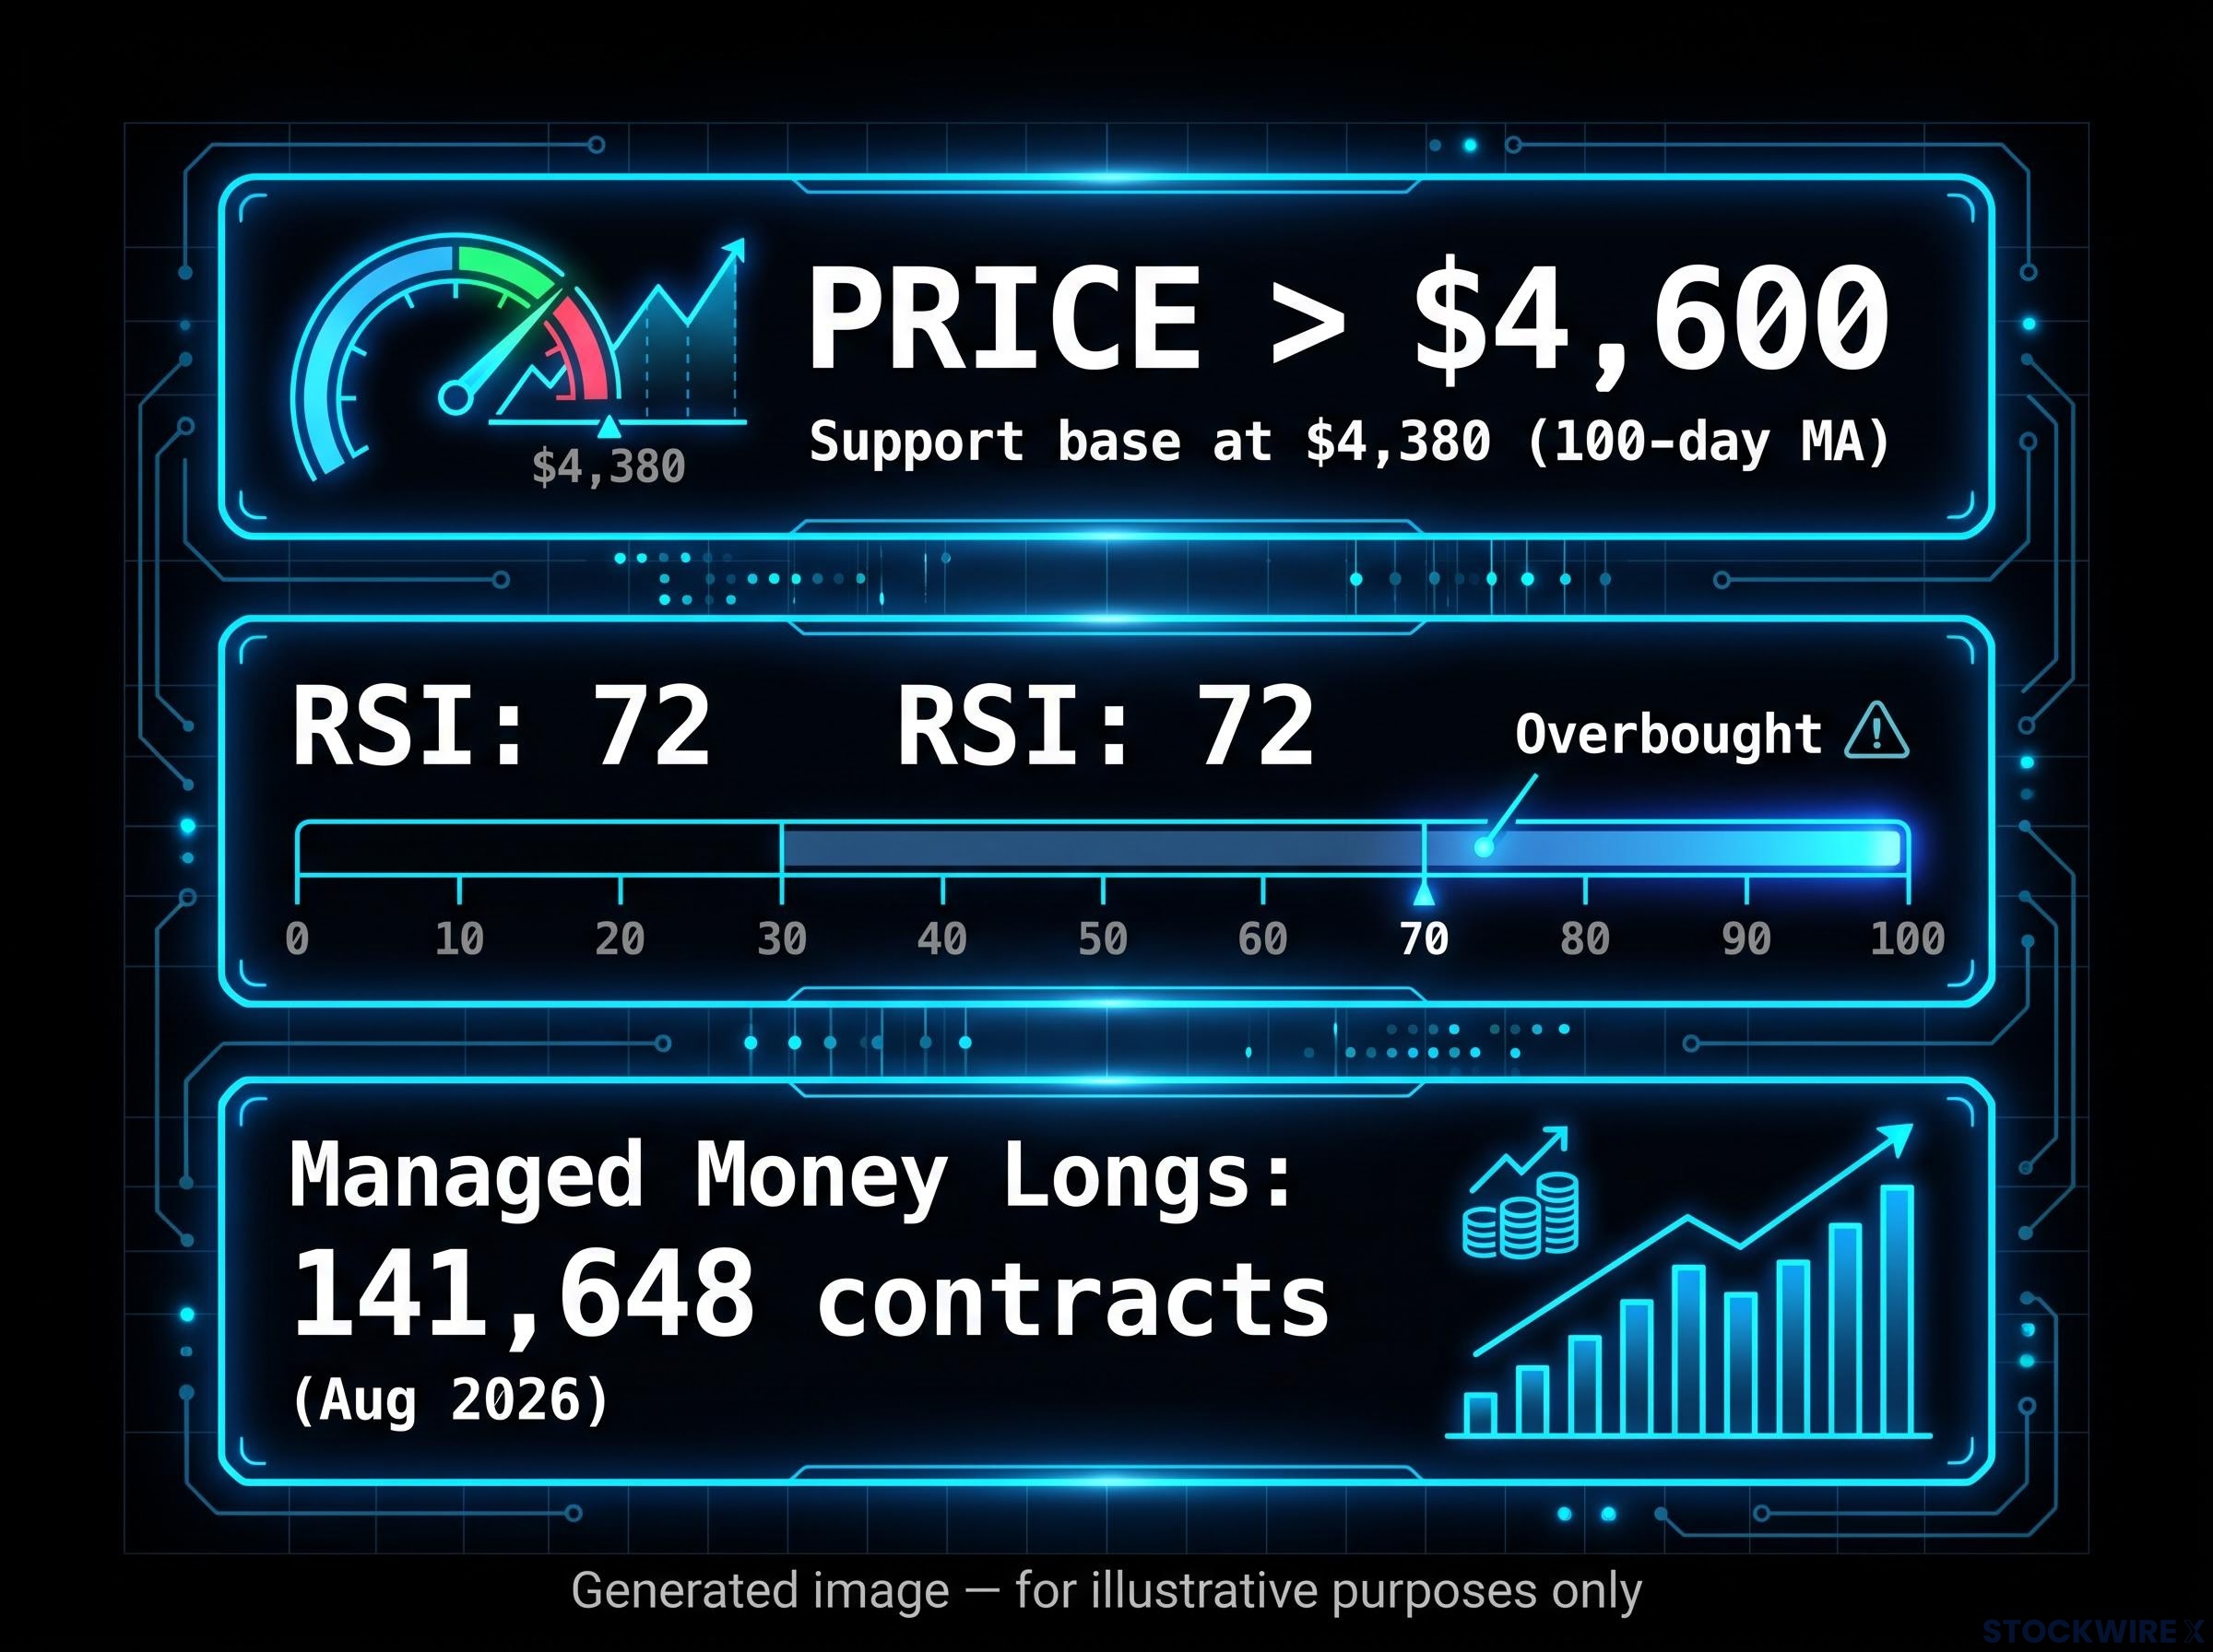
The technical picture reinforces the same reading:
- RSI near 72, registering above the 70 overbought mark but stopping well short of the kind of extreme readings associated with blow-off tops
- MACD and DMI readings are constructive, with both indicators continuing to support the prevailing uptrend
Managed money positioning at year-to-date peaks, though below prior cycle extremes
Recent session highs near $4,695-$4,700 sit well above gold’s prior consolidation base, which formed around a 100-day moving average in the vicinity of $4,380. The distance between those two levels is the gap that a positioning unwind would need to travel.
Citi characterises this as a “zone of fragility, not an inevitable topping zone.”
An RSI of 72 with managed money at year-to-date peak longs tells you the upward momentum has genuine energy behind it. But the buyers keeping it elevated are the same accounts that will sell first if Fed messaging shifts even modestly.
When big ASX news breaks, our subscribers know first
What is actually pushing gold higher, and how far does the macro case really take it?
Two forces are doing legitimate work beneath the rally, and understanding their mechanics helps you calibrate how much of the move is justified versus speculative.
The first is dollar weakness. A softer dollar makes gold cheaper in non-USD terms, which lifts demand from international buyers and tends to push dollar-priced commodities higher broadly. This is a mechanical relationship, not a speculative one: when the currency gold is priced in weakens, the commodity’s price in that currency rises, all else equal.
The second is the U.S. Treasury’s decision to increase buybacks of longer-duration debt. When the government buys back long-dated bonds, it pushes those bond prices up and their yields down. Lower nominal yields, combined with a softer dollar, reduce real interest rates, which is the opportunity cost of holding a non-yielding asset like gold. When real rates fall, gold becomes relatively more attractive because you are giving up less yield to hold it.
The real yield divergence visible across July 2026, where US real yields hit their highest level since the April tariff shock while gold simultaneously advanced and the dollar broke technical support, signals that the classic inverse correlation between real yields and gold has been structurally broken since roughly 2022-2023, a regime shift that changes how much weight investors should place on any single Fed communication.
Both drivers are documented in Citi’s note. Both are real. And neither, according to Citi, is sufficient on its own to justify a durable new price regime above $4,600 without physical demand confirming the breakout.
| Driver | Mechanism | Contribution to rally | Limitation |
|---|---|---|---|
| Dollar weakness | Gold becomes cheaper in non-USD terms, lifting international demand | Supports higher nominal gold prices broadly | Does not anchor a specific price floor; reversible if dollar strengthens |
| Treasury buybacks of longer-duration debt | Pushes long-bond prices up, nominal yields down, reduces real rates | Cuts gold’s opportunity cost, making non-yielding assets more attractive | Policy-dependent; does not reflect organic demand for gold itself |
The macro tailwinds explain the breakout. For you, as someone evaluating whether to buy at current levels, the point is that these drivers alone do not anchor gold above $4,600 if the physical markets continue to push back. And the physical markets are pushing back.
Why China and India are signalling that gold is too expensive right now
China and India together represent the world’s largest physical gold consumption base. Their behaviour at a given price level is a structural signal, not noise. When they buy aggressively, it validates a price range as sustainable. When they step back, it tells you the speculative price has outrun the level where the most price-sensitive real-world buyers see value.
Right now, both are stepping back.
Citi’s note characterises Chinese physical buying as subdued, with both retail and institutional participants content to trade within established ranges rather than build directional positions. Chinese buyers are not chasing prices at these levels, which implies they view gold as fully valued or rich at $4,600-plus.
India’s signal is even more direct. As of August 2026, local gold prices in India have slipped to a discount relative to global reference prices, reversing the premium that typically reflects robust domestic appetite.
Indian gold premiums turning negative is a meaningful reversal. India typically trades at a premium because domestic demand is strong. A discount means dealers cannot move inventory at global prices: a direct, observable sign of demand fatigue.
| Market | What it normally looks like | Current status (August 2026) |
|---|---|---|
| China | Directional buying, accumulation on dips | Weak; range-bound trading, no trend-following |
| India | Premium to international benchmarks (strong domestic demand) | Negative premium (discount to international prices) |
Citi’s view is that a meaningful pickup in physical buying would be required to keep the rally going beyond the flows currently provided by speculative accounts. When the two largest physical buyers in the world are either sitting on their hands or selling at a discount, the price level you are looking at has no structural floor beneath it from the demand side.
The gold demand composition in Q2 2026 reveals the specific vulnerability the current price level faces: investment demand excluding OTC transactions fell 46% year-on-year to 262 tonnes, while central bank purchases of 289 tonnes came in at a record quarterly high but were lumpy enough that any single weak quarter opens a structural demand gap that speculative flows cannot reliably bridge.
Jackson Hole is a binary event, and Citi’s framework for each outcome
Federal Reserve Chair Kevin Warsh is scheduled to deliver the Jackson Hole keynote on or around 28 August 2026. In Citi’s assessment, the speech represents a genuine fork in the road for gold, with the potential to either arrest the current advance or send prices materially higher. The positioning data makes the stakes concrete: 141,648 contracts of managed money longs are sitting in a market with an RSI of 72, waiting for a signal.
TD Securities’ analysis of Warsh’s Jackson Hole communication strategy concludes that the speech is deliberately constructed to avoid a September FOMC rate signal, meaning investors who arrive expecting a Powell-era rate preview carry the sharpest repricing risk regardless of whether the tone reads hawkish or dovish.
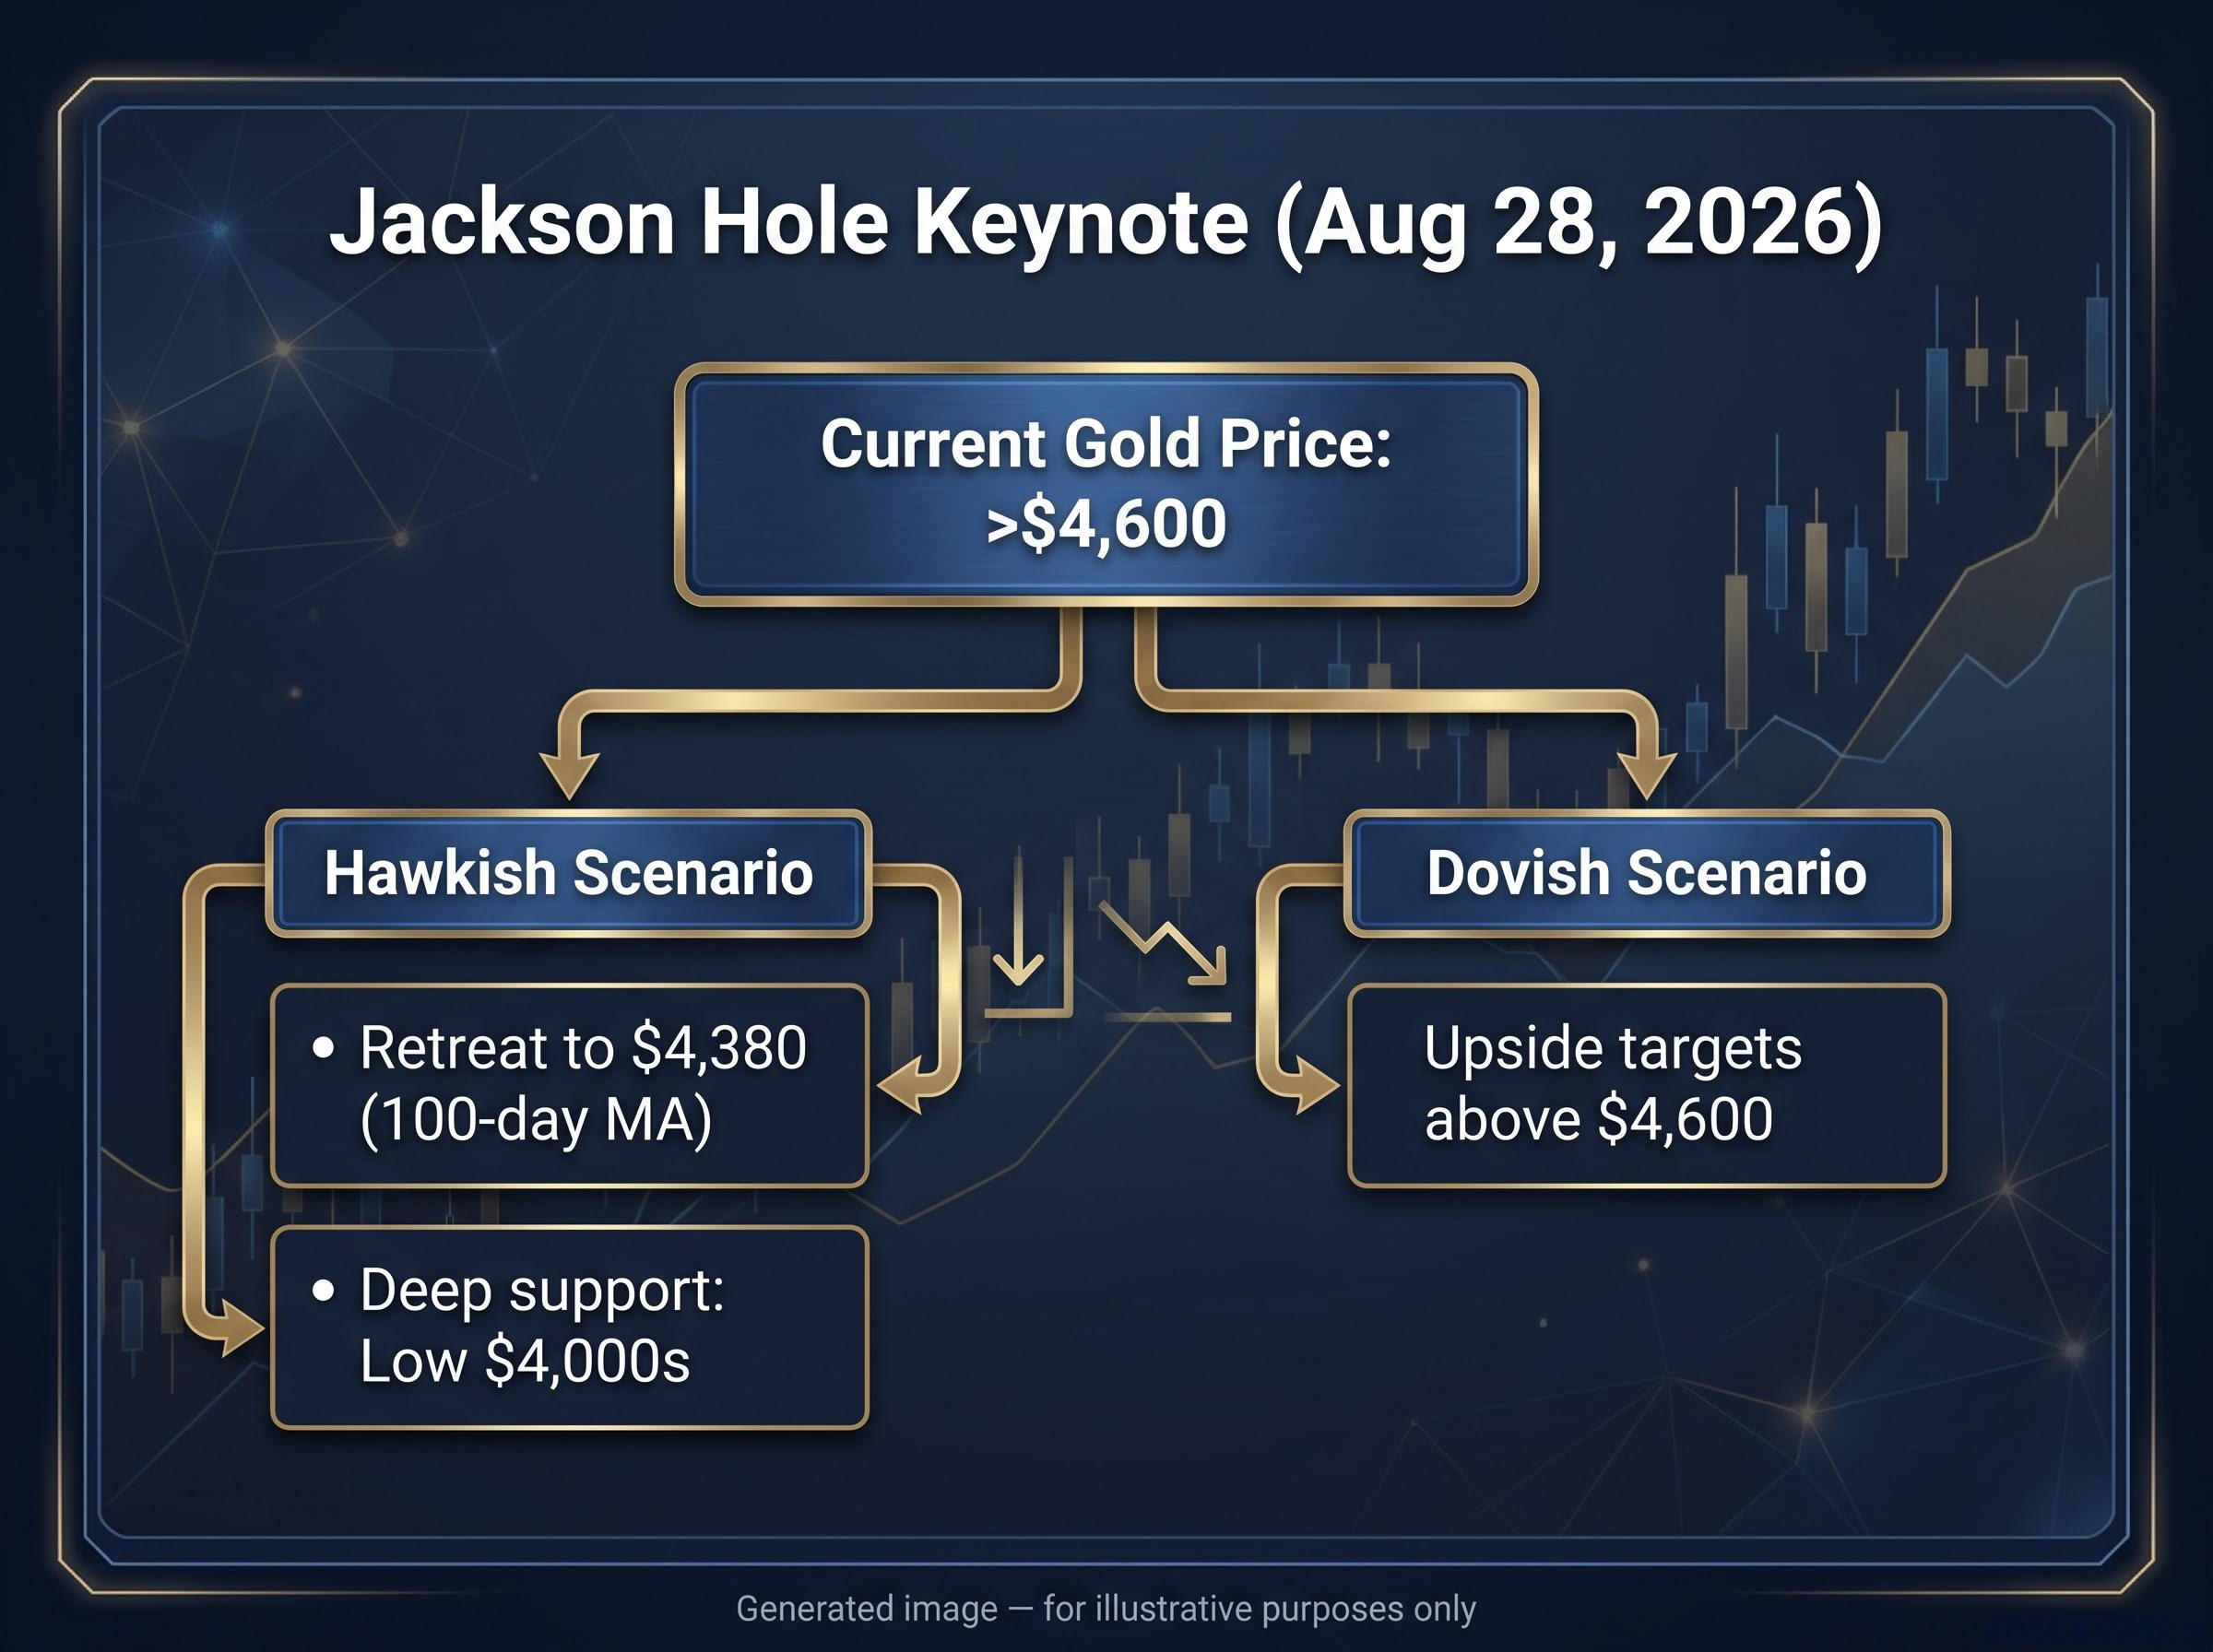
1. Hawkish scenario (rally breaker): If Warsh signals slower or fewer rate cuts, or a willingness to keep policy restrictive longer, expected real rates rise and the dollar strengthens. Managed money longs, already stretched, begin trimming. Citi sees an initial retreat toward the 100-day moving average in the $4,380 area as a plausible first stop, followed by a deeper slide into the low $4,000s should selling gather momentum.
Citi has indicated it would treat a decline into the low $4,000s as a compelling entry point for investors with a longer time horizon, pointing to the price support that held firm near $4,000 throughout late June and July 2026 as evidence of durable structural demand at that level.
2. Dovish scenario (rally extender): If Warsh hints at earlier or larger cuts, real yields fall, the dollar weakens, and the existing gold narrative is validated. Additional speculative inflows layer onto an already positive technical backdrop, and new upside technical targets above $4,600 come into play.
How to position before the keynote, by investor type
Current longs: You hold exposure to a binary policy event in a market dominated by speculative buyers. Position sizing and hedging should reflect the possibility of a drop back toward the low $4,000s on a hawkish surprise. Risk management, not conviction, is the priority into the keynote.
Prospective buyers: A hawkish Jackson Hole outcome that drags gold back toward the low $4,000s would likely create a materially better long-term entry point than current levels. The prior $4,000 floor, established between late June and July 2026, is evidence of structural demand at that level. Patience is a strategy here, not indecision.
Tactical shorts: There is genuine dovish upside risk. A friendly Jackson Hole message could propel gold further as additional speculators join the trend. Short positions require a clear plan for adverse policy surprises, given that technical momentum remains positive.
The Jackson Hole framing matters because it reframes the decision: the question is not whether to believe in gold long-term, but whether entering above $4,600 before a known binary event is an informed position or an undisciplined one.
Where gold goes from here, and what it would take to make $4,600 a floor instead of a ceiling
Citi’s thesis is straightforward: gold’s current price is ahead of its fundamentals, not divorced from them. The gap closes either by fundamentals rising to meet the price or by the price falling to meet fundamentals. Nothing in the note dismisses gold’s long-term role as a store of value. The argument is specifically about today’s entry point.
For $4,600-plus to become a structural floor rather than a speculative ceiling, three conditions would need to converge:
- Fed dovish confirmation: A clear pivot toward accommodation that validates lower real rates and a weaker dollar as the durable forward path
- Asian physical demand recovery: Chinese and Indian buyers re-engaging at scale, with Indian premiums turning positive again and Chinese flows shifting from range-bound to directional accumulation
- Speculative-to-structural buyer rotation: Managed money positioning normalising as broader, longer-horizon buyers enter, replacing hot money with durable capital
Until those conditions materialise, the technical picture (RSI near 72, positioning near year-to-date highs) describes a market that needs to normalise before a clean entry emerges. The price base that formed around $4,000 across June and July 2026 stands as the cycle’s clearest evidence of where patient, structurally-motivated capital has been willing to accumulate.
For you as a long-horizon investor, the synthesis is this: gold being the right long-term asset and gold being at the wrong entry point right now are not mutually exclusive. Understanding that distinction is what separates disciplined accumulation from performance-chasing. Citi’s framework gives you the conditions to monitor so that when new data arrives, whether from Jackson Hole or from the next CFTC positioning report, you have a repeatable lens for reading what it means.
This article is for informational purposes only and should not be considered financial advice. Investors should conduct their own research and consult with financial professionals before making investment decisions. These statements are speculative and subject to change based on market developments and company performance. Past performance does not guarantee future results.