Investment demand in gold nearly halved year-on-year in Q2 2026. At the same moment, central banks posted a record second-quarter purchase total. Those two facts arrived in the same World Gold Council (WGC) dataset, and they point in opposite directions.
The tension matters because gold prices remain elevated, yet the buyers holding them there have changed. The composition of demand, not its headline total, is where the real signal sits. A reader tracking the gold price sees a number. The structure underneath that number has shifted in ways that carry direct implications for how durable the current level actually is.
Here is the framework for reading the Q2 2026 data clearly: which demand channels are active, which have gone quiet, and what the distribution tells you about gold’s margin of safety at current prices.
The headline number that needs unpacking
The visible investment figure is stark. Excluding over-the-counter transactions, total investment demand came in at 262 tonnes for Q2 2026, roughly half the 487 tonnes recorded in the same quarter of 2025, a drop driven principally by ETF outflows. That looks like a retreat.
It is not the whole picture. The 46% drop conflates two components that moved in very different directions:
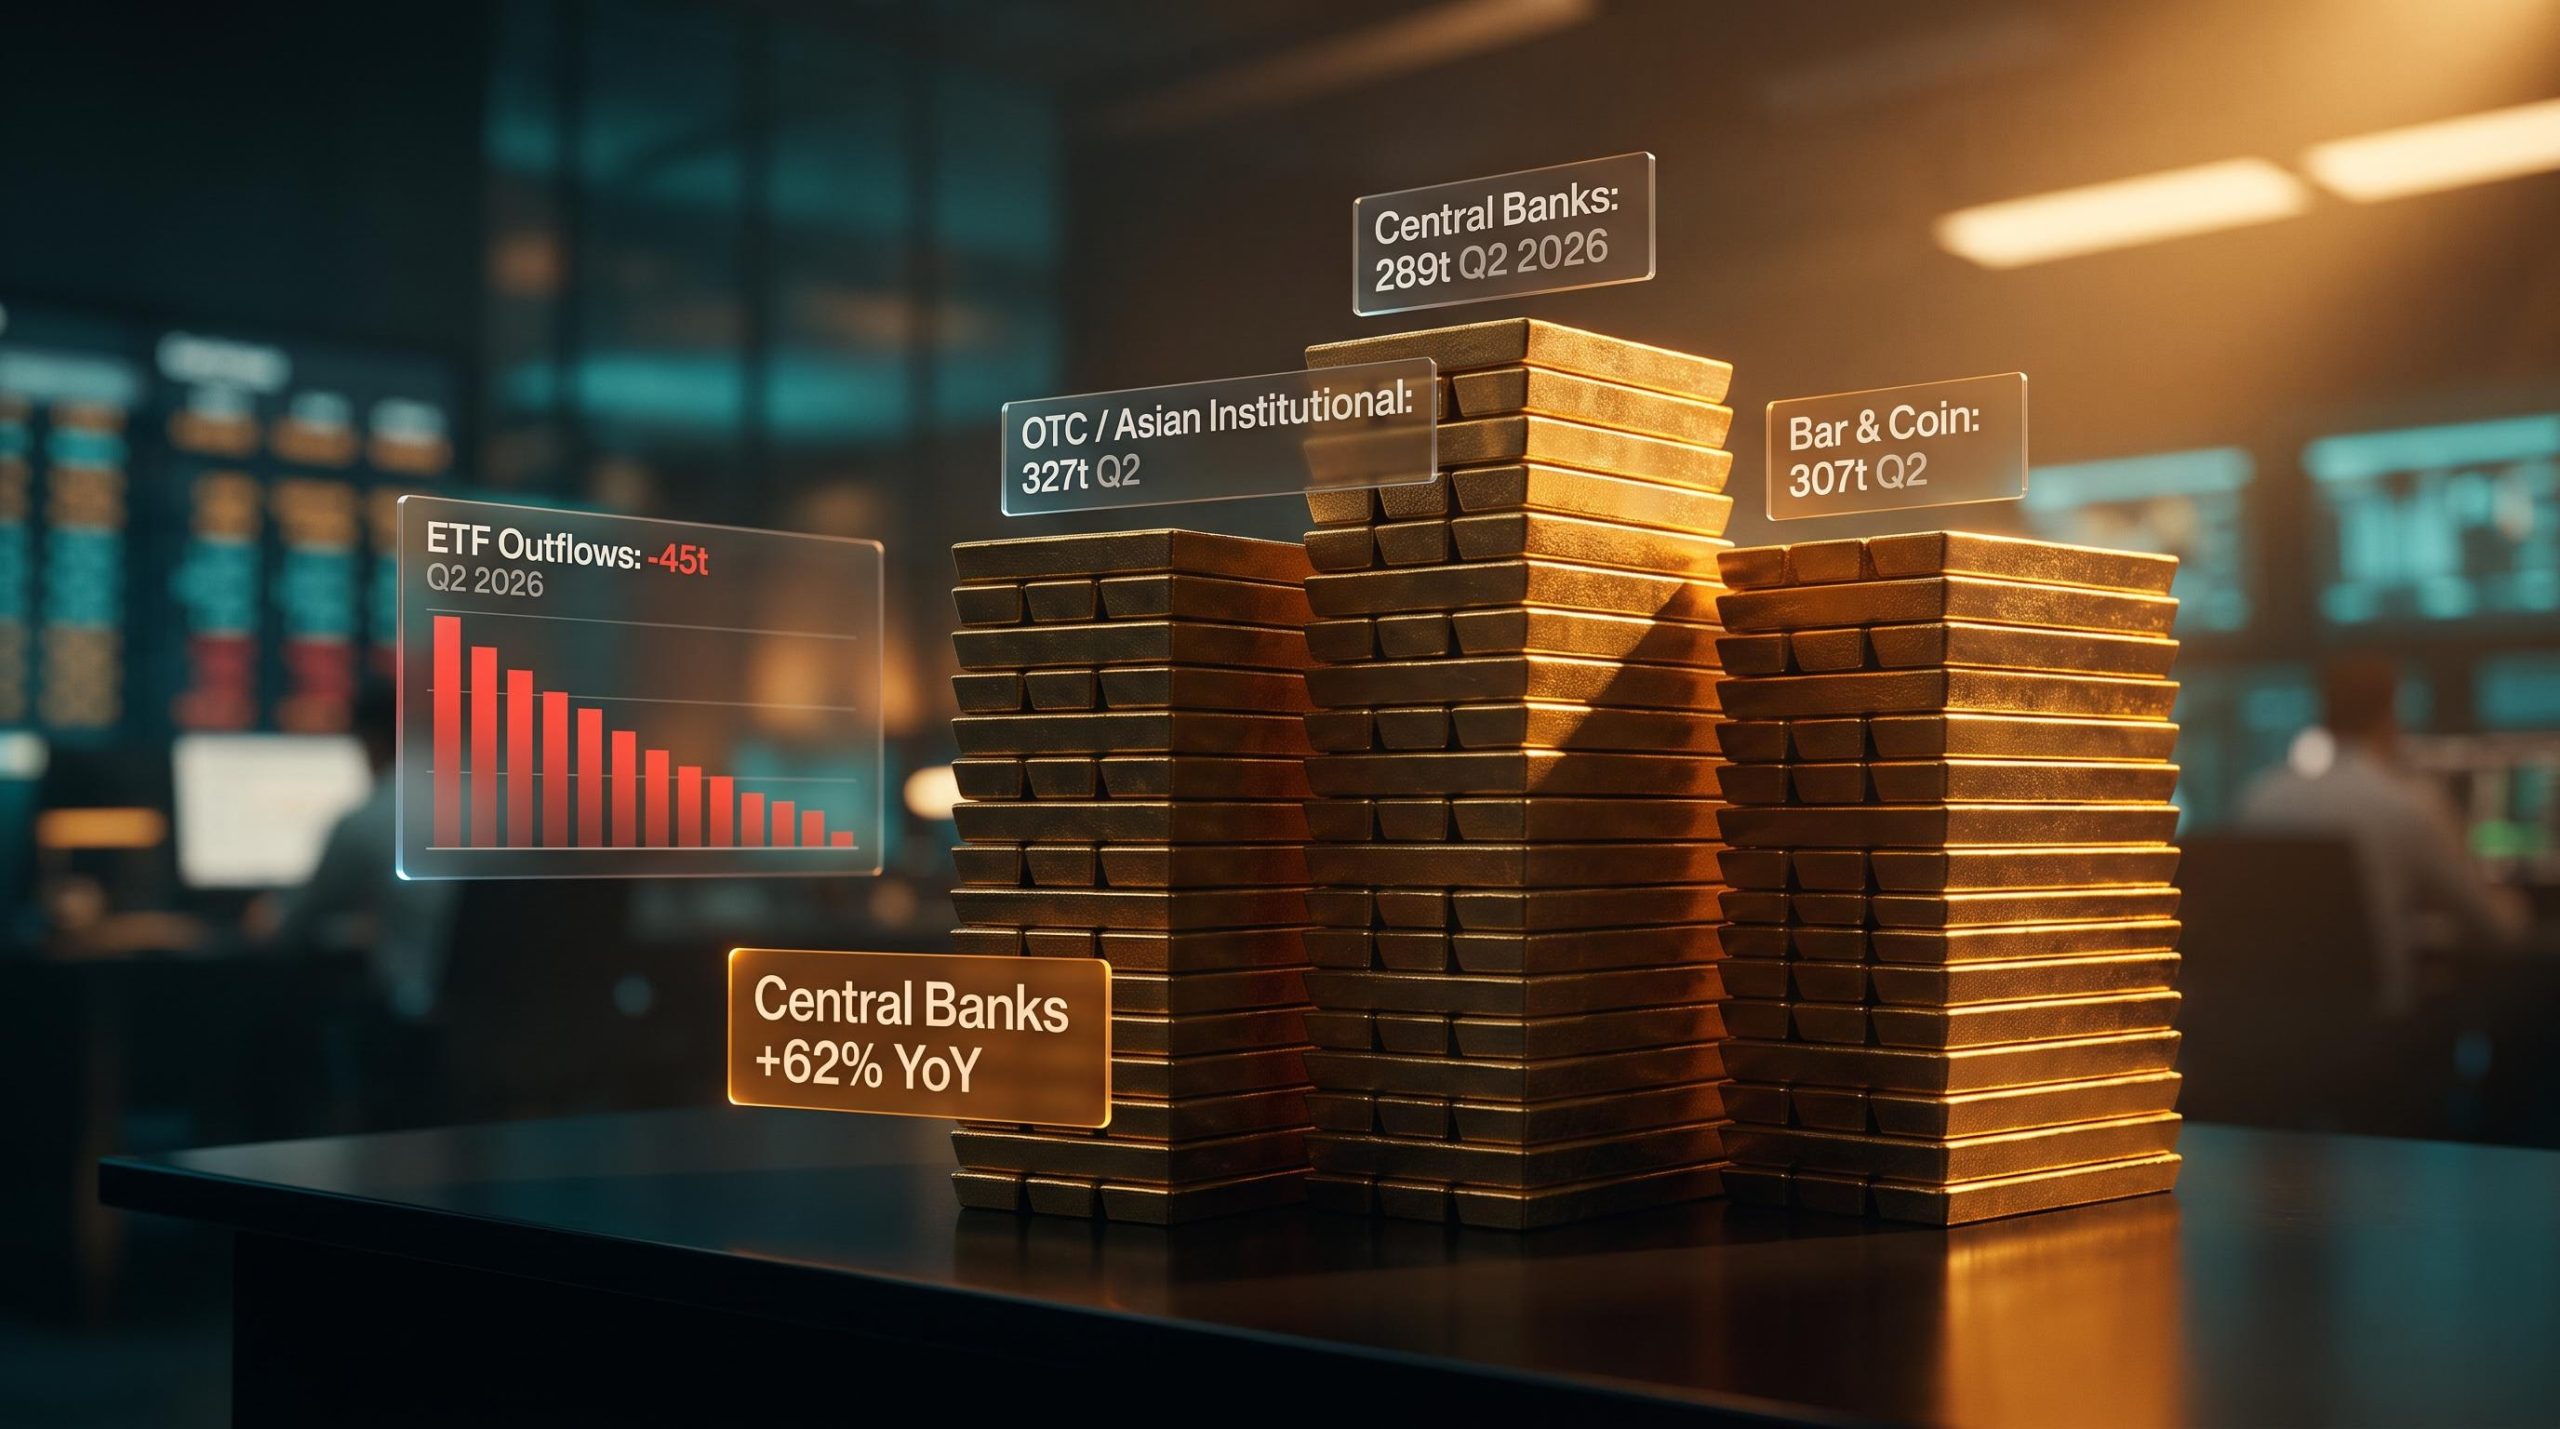
- Gold ETFs: Net outflows of negative 45 tonnes in Q2 2026, the primary driver of the headline weakness
- Bar and coin demand: 307 tonnes, a figure the WGC noted as a step back from prior exceptional quarters, down approximately 3% year-on-year
- OTC (over-the-counter) investment: 327 tonnes in Q2, a frequently omitted category that sits outside the “visible investment” framing entirely
WGC characterisation: Bar-and-coin demand “held steady y/y,” returning to more typical levels after exceptional prior strength.
For H1 2026 as a whole, ETF net demand remained slightly positive at 18 tonnes, and bar-and-coin demand ran 21% higher than H1 2025. The year-to-date position is not one of wholesale flight.
The distinction matters. This is a retreat by one specific type of investor: Western ETF holders responding to price momentum cooling. It is not a broad abandonment of gold by private buyers. That changes how you should read the risk.
When big ASX news breaks, our subscribers know first
What gold’s three active buying pillars actually look like
Strip away the ETF noise and the demand picture resolves into three distinct load-bearing columns. Each operated at scale in Q2 and H1 2026.
| Demand Pillar | Q2 2026 (tonnes) | H1 2026 (tonnes) | WGC Characterisation |
|---|---|---|---|
| Central banks | 289 | 345 | “Continued, but uneven” |
| OTC / Asian institutional-wholesale | 327 | 571 | “Key support” alongside central banks |
| Bar and coin (Asian retail-weighted) | 307 | 21% above H1 2025 | “Held steady y/y” after exceptional Q1 |
The OTC figure is the one most coverage misses. OTC investment refers to gold bought directly between institutional counterparties rather than through exchanges or retail channels. At 571 tonnes for H1 2026, it is not a marginal flow. The WGC explicitly attributes this demand to “Asian investment” and identifies it as a key support for overall demand alongside central bank purchases.
Asian gold ETF expansion accelerated sharply through 2025, with Asian-listed funds capturing roughly 30% of global gold ETF market capitalisation, a structural shift that helps explain why OTC and Asian institutional flows have absorbed the slack left by Western ETF outflows in H1 2026.
For a reader trying to assess whether gold’s price level has structural backing, the OTC pillar reveals that a substantial pool of institutional and Asian wholesale demand is active at current prices. That meaningfully changes the concentration risk picture. Gold is not resting on one column. It is resting on three.
Central bank buying: record quarter, or a moderating trend?
The quarterly record
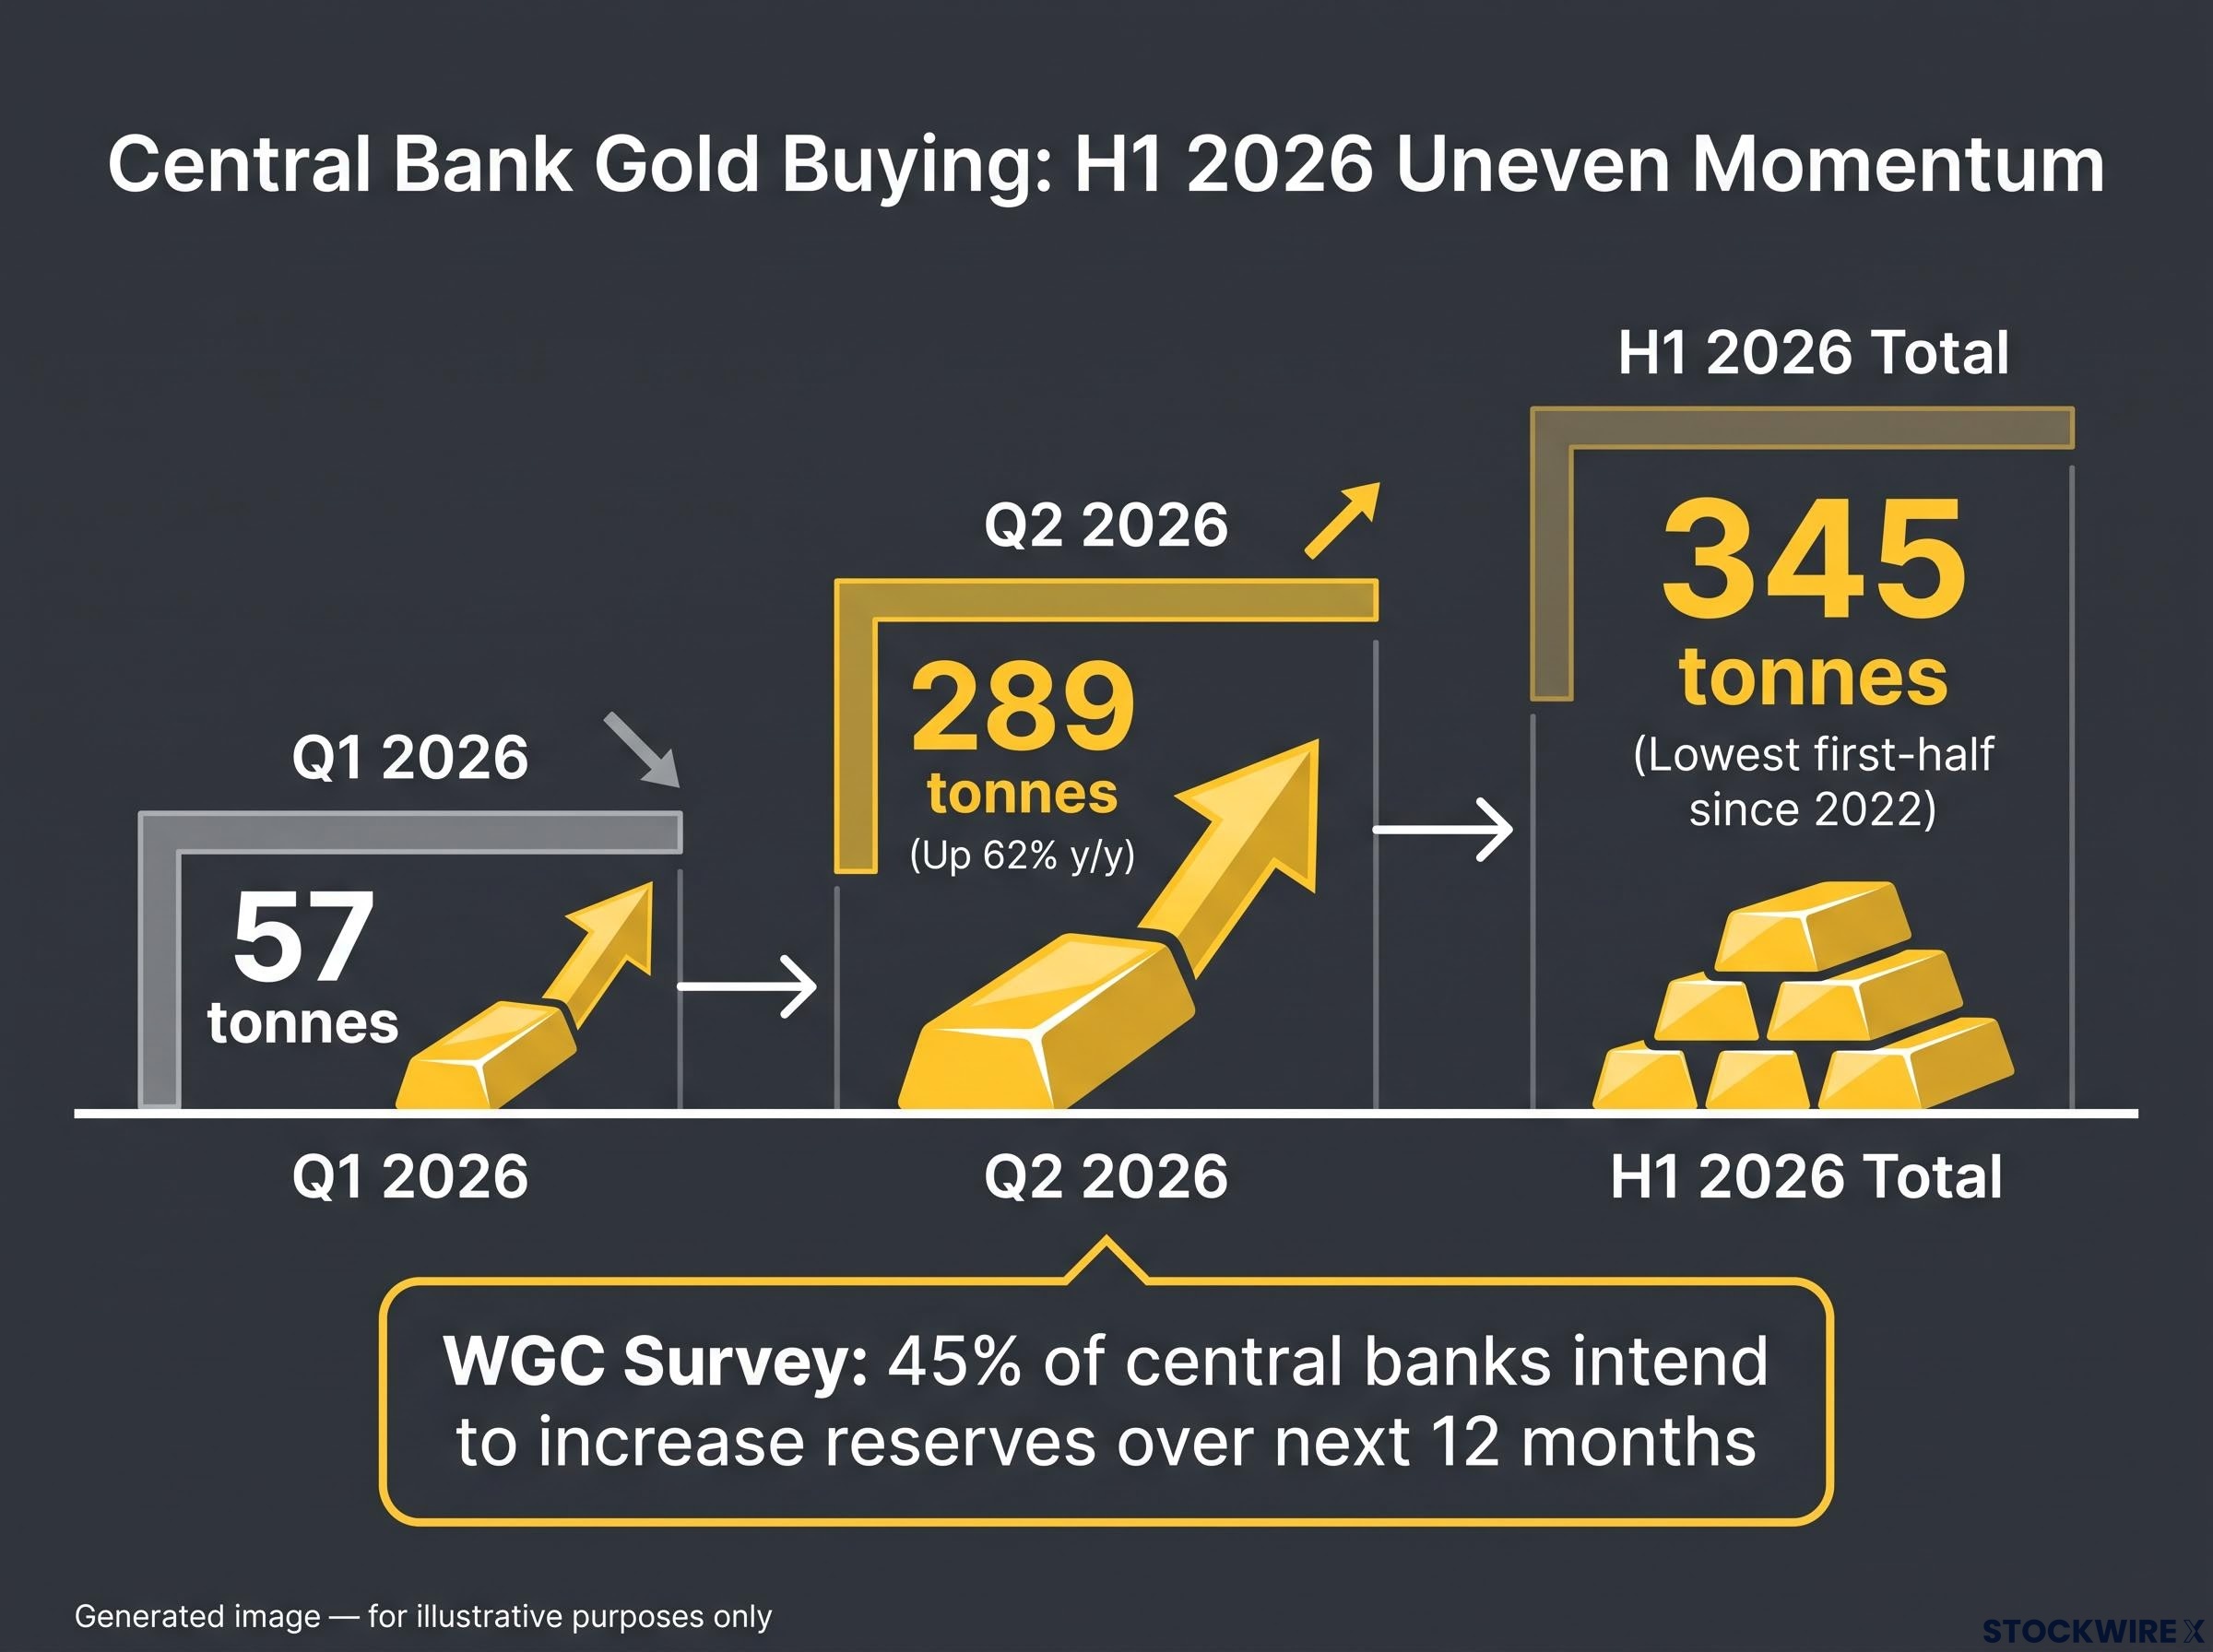
The Q2 2026 central bank figure deserves its headline. At 289 tonnes, it is the highest second-quarter purchase total on record, up 62% year-on-year and more than five times the revised Q1 2026 total of 57 tonnes. Official-sector appetite for gold at current prices is not in question.
The structural gold bid is largely price-insensitive precisely because de-dollarisation motives, reserve diversification mandates, and geopolitical hedging objectives operate on a different decision timeline than the momentum-driven flows that govern Western ETF positioning.
The H1 moderation context
Zoom out to the half-year and the momentum looks different. Central bank net purchases across H1 2026 reached 345 tonnes in aggregate, implying an annualised run-rate of around 700 tonnes if the pace were sustained through year-end. The WGC describes this as the lowest first-half total since 2022. It remains strong relative to pre-2022 norms, but it sits below the elevated levels of 2023-2025.
WGC framing: Central bank buying is “continued, but uneven.”
The forward signal supports continuation rather than acceleration. The WGC’s Central Bank Gold Reserves Survey found that 45% of respondent central banks intend to increase their gold reserves over the next 12 months. That is a floor indicator, not a ceiling one.
The gap between the record Q2 and the subdued H1 total tells you something specific: central bank demand is lumpy and uneven rather than steadily escalating. That matters when assessing how much structural floor official buying actually provides. A single large quarterly purchase by one or two central banks can mask a broader deceleration in the trend.
Why Western ETF flows and jewellery volumes went quiet
Two of gold’s historically reliable demand channels weakened in Q2, and the shared logic underneath both is price sensitivity, operating at different points on the demand curve.
Start with ETFs. The WGC framing is that the lower gold price in Q2 “tempered the strong momentum seen earlier in the year.” This is momentum cooling, not a structural exit. Western ETF investors tend to buy into rising prices and pull back when the rally pauses. That feedback loop, where price rises drive ETF inflows which drive further price rises, is currently inactive.
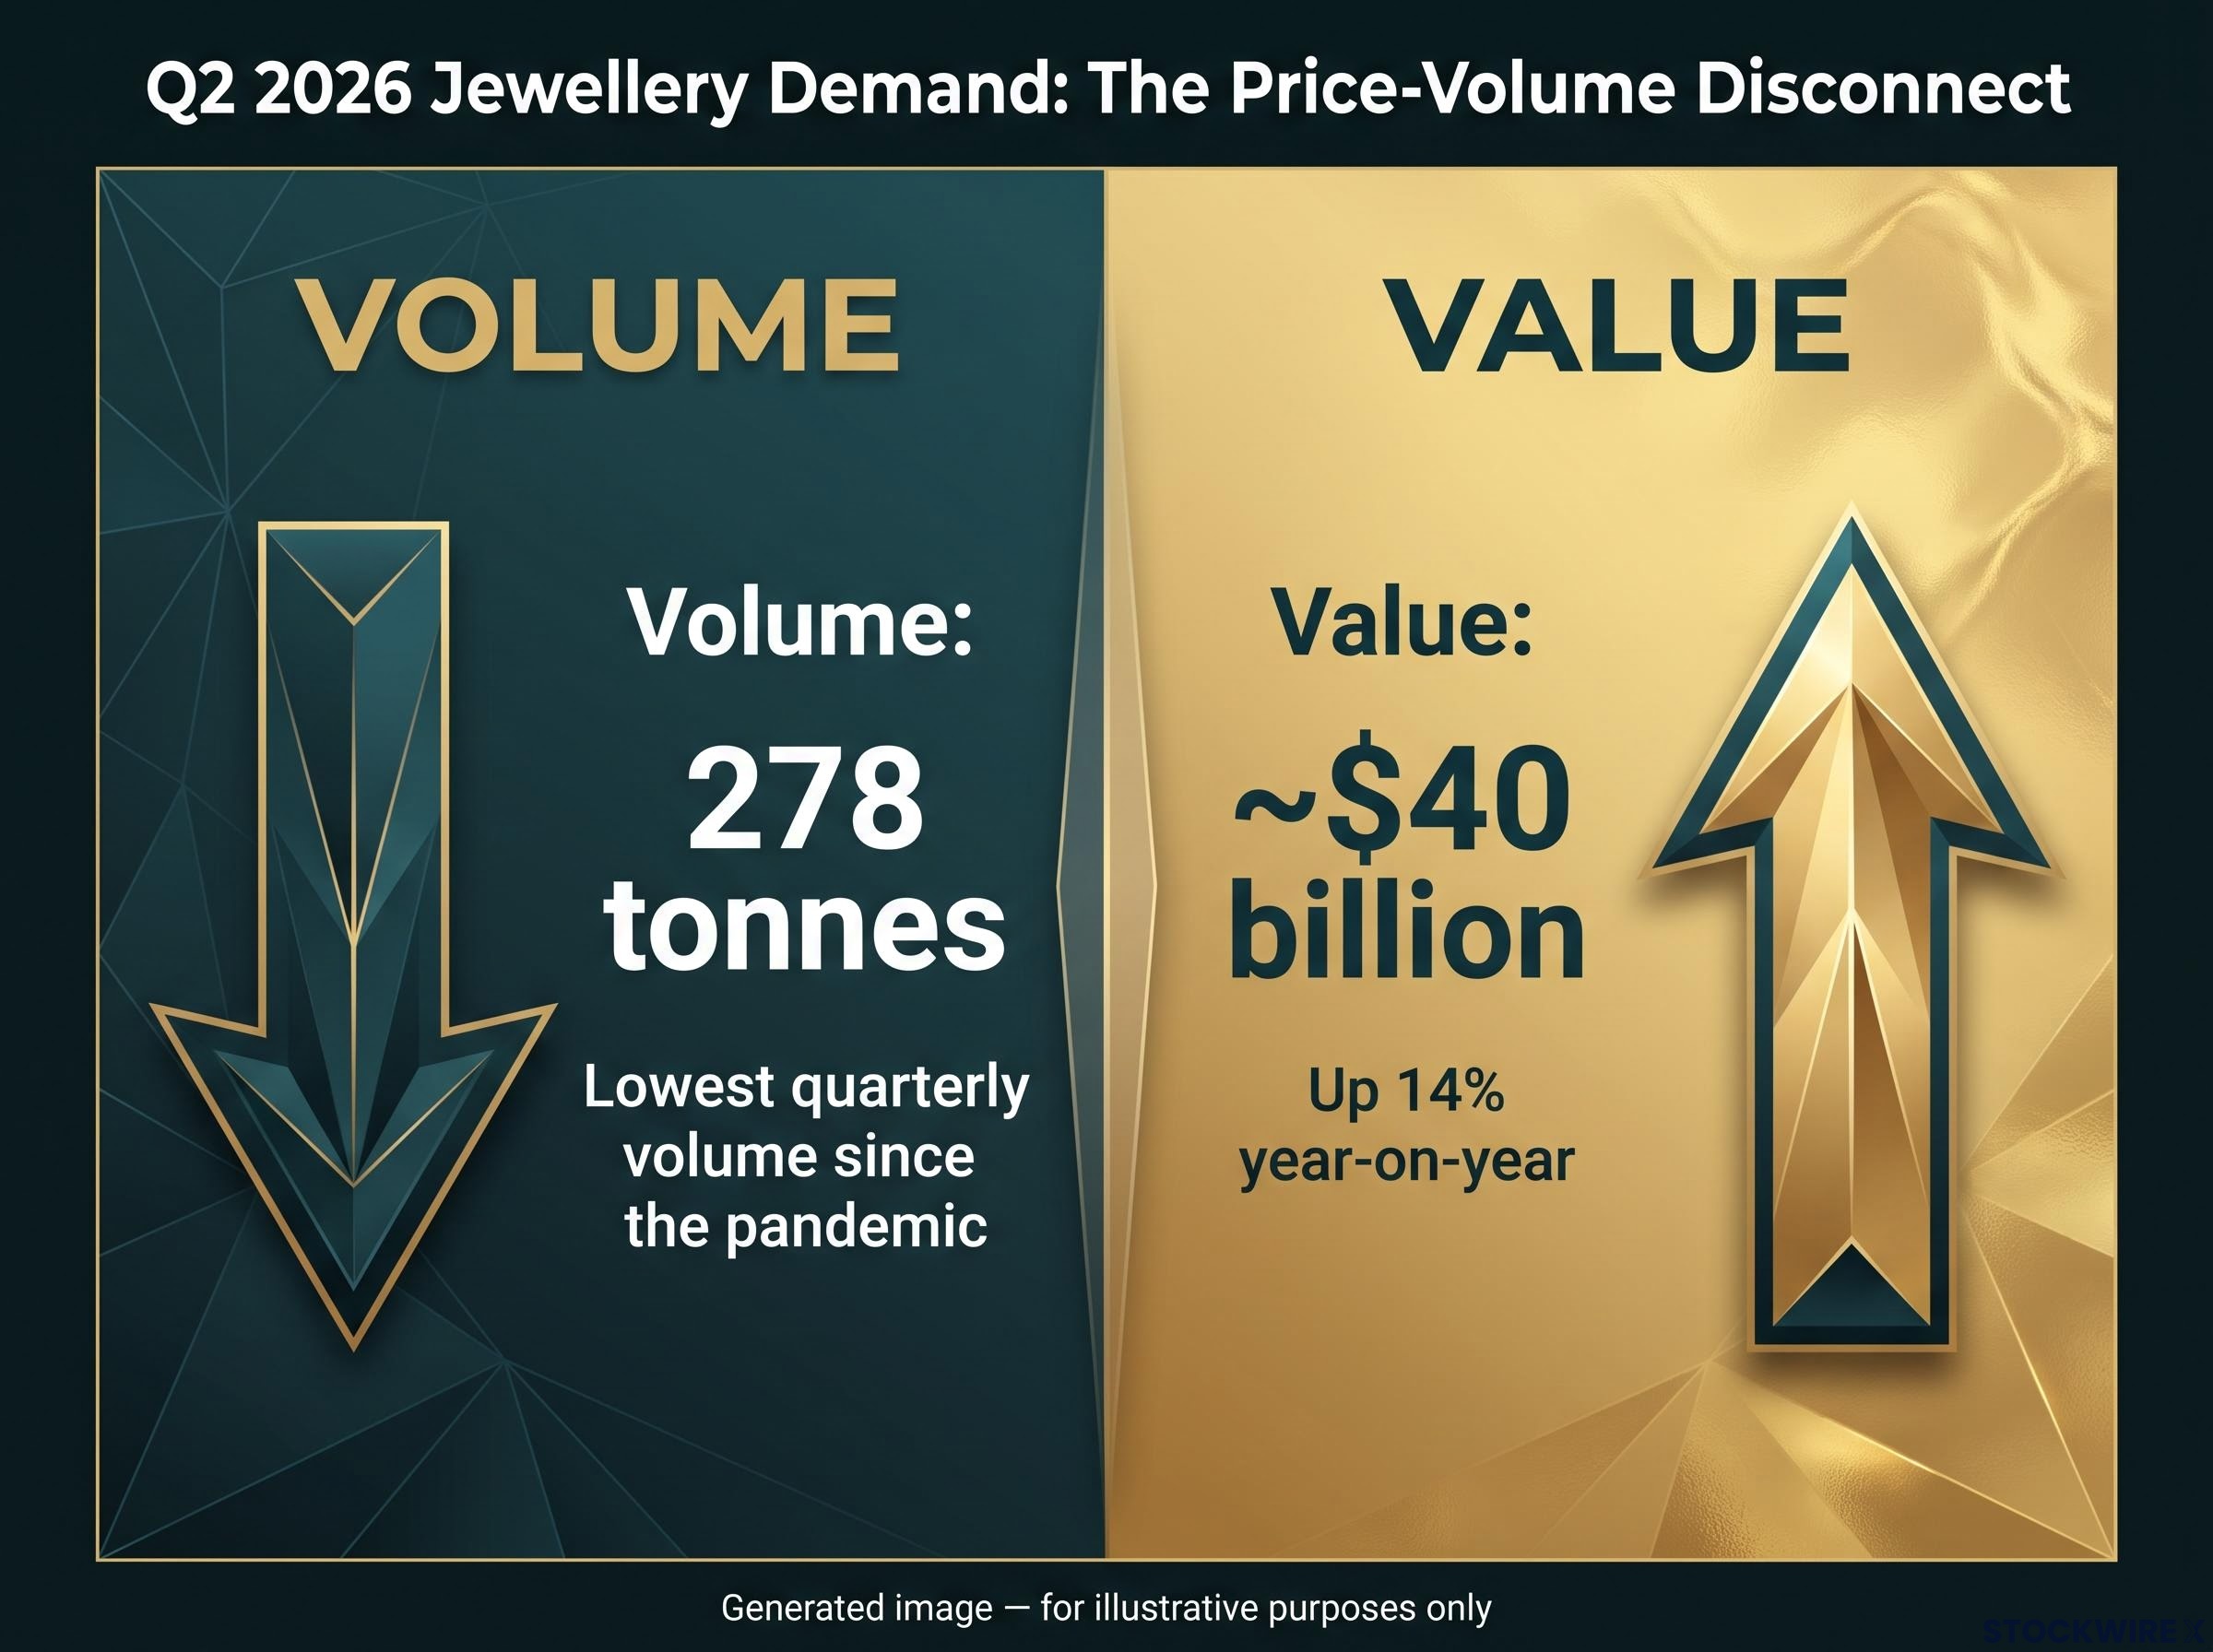
Now jewellery. Q2 2026 jewellery demand fell to 278 tonnes, the lowest quarterly volume since the pandemic. But jewellery spending in value terms rose 14% year-on-year to approximately $40 billion. The price-volume disconnect is worth pausing on:
- Volume: 278 tonnes, a pandemic-era low
- Value: Approximately $40 billion, up 14% year-on-year
Think about what this looks like at the consumer level. A buyer at a jewellery counter is spending more in dollar terms but walking away with less gold by weight. That is a structural constraint on volume recovery for as long as prices stay elevated. Consumers have not lost interest in gold; they simply cannot afford as much of it.
Both of these channels are price-sensitive in different ways, and both are likely to remain constrained at current price levels. The read you should take from this is that the weakness is a pricing signal, not a sentiment reversal.
Where the structural risk actually sits
The fragility argument goes like this: central bank buying could moderate or slow before Western ETF momentum and retail jewellery demand recover at current price levels, leaving a demand gap without an obvious bridge buyer. The argument is legitimate. It also needs testing against the full picture.
Sovereign debt and reserve diversification pressures have driven institutional demand for gold beyond the traditional inflation-hedge narrative, with BlackRock, JPMorgan, and ECB-linked research each linking deteriorating bond diversification value to durable increases in official and institutional gold allocations.
UBS modelling (analyst view, not WGC data): UBS analysis concludes that sustaining gold prices above $4,000 requires official-sector purchases to remain in the region of 300 tonnes per quarter, alongside a recovery in investment inflows. Q2 2026’s 289 tonnes approaches but does not reach that level.
Three risk scenarios sit at varying distances from the current position:
- Near-term: Central bank quarterly purchases dip below 250 tonnes while Western ETF outflows persist, creating a demand gap at the margin
- Medium-term: OTC and Asian retail demand normalise from their elevated H1 levels, reducing the shock-absorber capacity of the private demand base
- Conditional: A sustained gold price correction triggers a negative feedback loop in ETF and bar-and-coin demand simultaneously, compressing multiple pillars at once
Now test these against the counterweight. OTC investment delivered 571 tonnes in H1 2026. Bar-and-coin demand ran 21% above H1 2025. The WGC identifies investment demand, specifically OTC and Asian buying, as the principal source of demand growth for the remainder of 2026, not Western ETF flows.
The honest read is that gold’s current demand structure is more concentrated than the pre-2022 norm but less brittle than a “central banks alone” framing suggests. The specific vulnerability is in the sequencing: what happens if official buying eases before private Western demand reactivates. That is the gap to monitor, not the headline investment decline.
What the demand fracture tells you about gold’s next test
The WGC outlook names the swing variable directly: OTC and Asian institutional demand is expected to drive demand growth through the remainder of 2026. Not Western ETFs. Not jewellery volume. The composition shift is not a temporary quirk; it is the baseline scenario the WGC itself is working from.
The gold price outlook for H2 2026 is shaped heavily by whether the Federal Reserve delivers one rate adjustment or multiple, a variable that the WGC’s own demand projections treat as the key swing factor between a recovery in Western ETF inflows and a continued speculative washout.
On the supply side, Q2 mine output reached 966 tonnes, edging up from 948 tonnes in the same quarter a year prior, while recycled supply contracted to 326 tonnes from 374 tonnes in Q1 2026. The WGC expects only a “measured response” from supply at current price levels, so no supply shock is anticipated in either direction.
The annual demand total for 2026 is projected to finish below 2025’s figure. Q2’s rebound in central bank and OTC demand did not fully offset revised Q1 weakness.
Three specific indicators are worth tracking from here:
- OTC volume: Whether the 571-tonne H1 pace holds, accelerates, or fades in H2 2026
- Central bank survey follow-through: Whether the 45% of central banks signalling reserve increases translate into purchases near the 289-tonne quarterly pace
- Western ETF flow reversal: Any sustained return to net inflows would signal the momentum feedback loop is reactivating, a meaningful shift in the demand mix
The question the Q2 data leaves open is whether this composition shift, from Western momentum-driven flows toward official-sector and Asian demand, represents a durable structural rebalancing or a transitional state that will eventually require Western ETF buyers to return before price levels can be sustained. That is gold’s next test, and the OTC flow data is where you will see the answer first.
This article is for informational purposes only and should not be considered financial advice. Investors should conduct their own research and consult with financial professionals before making investment decisions. Past performance does not guarantee future results. Forward-looking statements, including the UBS modelling and WGC survey projections referenced above, are subject to change based on market developments and macroeconomic conditions.