
Gold near record highs while the dollar weakens and Treasury yields climb. That three-way signal looks like a flashing warning about American fiscal health, and a growing number of investors are reading it exactly that way. On the surface, the logic is hard to argue with: if the world’s reserve currency is losing value while the cost of borrowing rises, something structural must be breaking.
Except the historical record tells a different story. MUFG analysts Derek Halpenny and Abdul-Ahad Lockhart have studied prior episodes where this exact combination appeared, and their findings cut directly against the dominant narrative. Gold recently pulled back from near $4,700, and the dollar has recovered from a three-month low, which means the question of whether this signal is reliable is not academic. It is shaping portfolio decisions right now.
Here is what the evidence actually shows, and the one variable that changes everything. After this, you will know which market signal matters most, what it has historically predicted, and what specific conditions would need to shift before a genuine debasement thesis earns serious weight.
The debasement narrative and why it keeps gaining traction
The currency debasement argument makes a specific claim: when gold strengthens, the dollar weakens, and Treasury yields rise simultaneously, the combination signals fiscal distress severe enough to erode the dollar’s reserve status over time. It is not a fringe position. It has a real intellectual constituency, and the surface logic is sound.
The three components of the signal, and what each is said to imply:
- Gold strength: Investors are seeking stores of value outside the dollar system, suggesting declining confidence in fiat currency
- Dollar weakness: The currency itself is losing purchasing power, confirming that the market is pricing in structural deterioration
- Rising Treasury yields: Bond investors are demanding higher compensation for holding US debt, implying that fiscal risk is no longer theoretical
That framework is intuitively compelling right now. US debt levels remain elevated, deficit concerns persist, and gold’s recent surge toward record territory has given the narrative fresh ammunition. The dollar’s slide to a three-month low earlier this year made it feel like confirmation rather than coincidence.
This is precisely why the historical evidence matters so much. The debasement thesis becomes dangerous not because it is obviously wrong, but because its surface logic is so sound that it discourages the kind of scrutiny the data actually warrants. Retail investors who accept it uncritically are exposed to a thesis that may reverse sharply, and understanding why the narrative is seductive is the first step toward evaluating it honestly.
The short-term dollar drivers that dominate exchange-rate movements over weeks and months, including Fed policy repricing, yield differentials, and narrative shifts, are structurally distinct from the debt and inflation fundamentals that most debasement arguments cite, a distinction that helps explain why the MUFG historical pattern of dollar stabilisation repeats even when fiscal headlines appear alarming.
When big ASX news breaks, our subscribers know first
What MUFG’s historical analysis actually found
MUFG’s Derek Halpenny and Abdul-Ahad Lockhart examined prior instances where these three signals fired simultaneously, looking at what happened next rather than what the narrative predicted would happen next. The pattern they found was consistent, and it ran in the opposite direction from what the debasement thesis implies.
When the combined signal reached extreme readings in previous cycles, the dollar did not go on to weaken persistently. The DXY index, the benchmark measure of dollar strength against a basket of major currencies, tended to recover or hold its ground rather than extend losses. Over the following one to three months, gold prices typically pulled back rather than sustained their advance.
MUFG’s core finding: Prior episodes of concurrent gold strength, dollar weakness, and rising Treasury yields were followed by dollar stabilisation and gold consolidation, not by lasting currency deterioration or sustained gold advances.
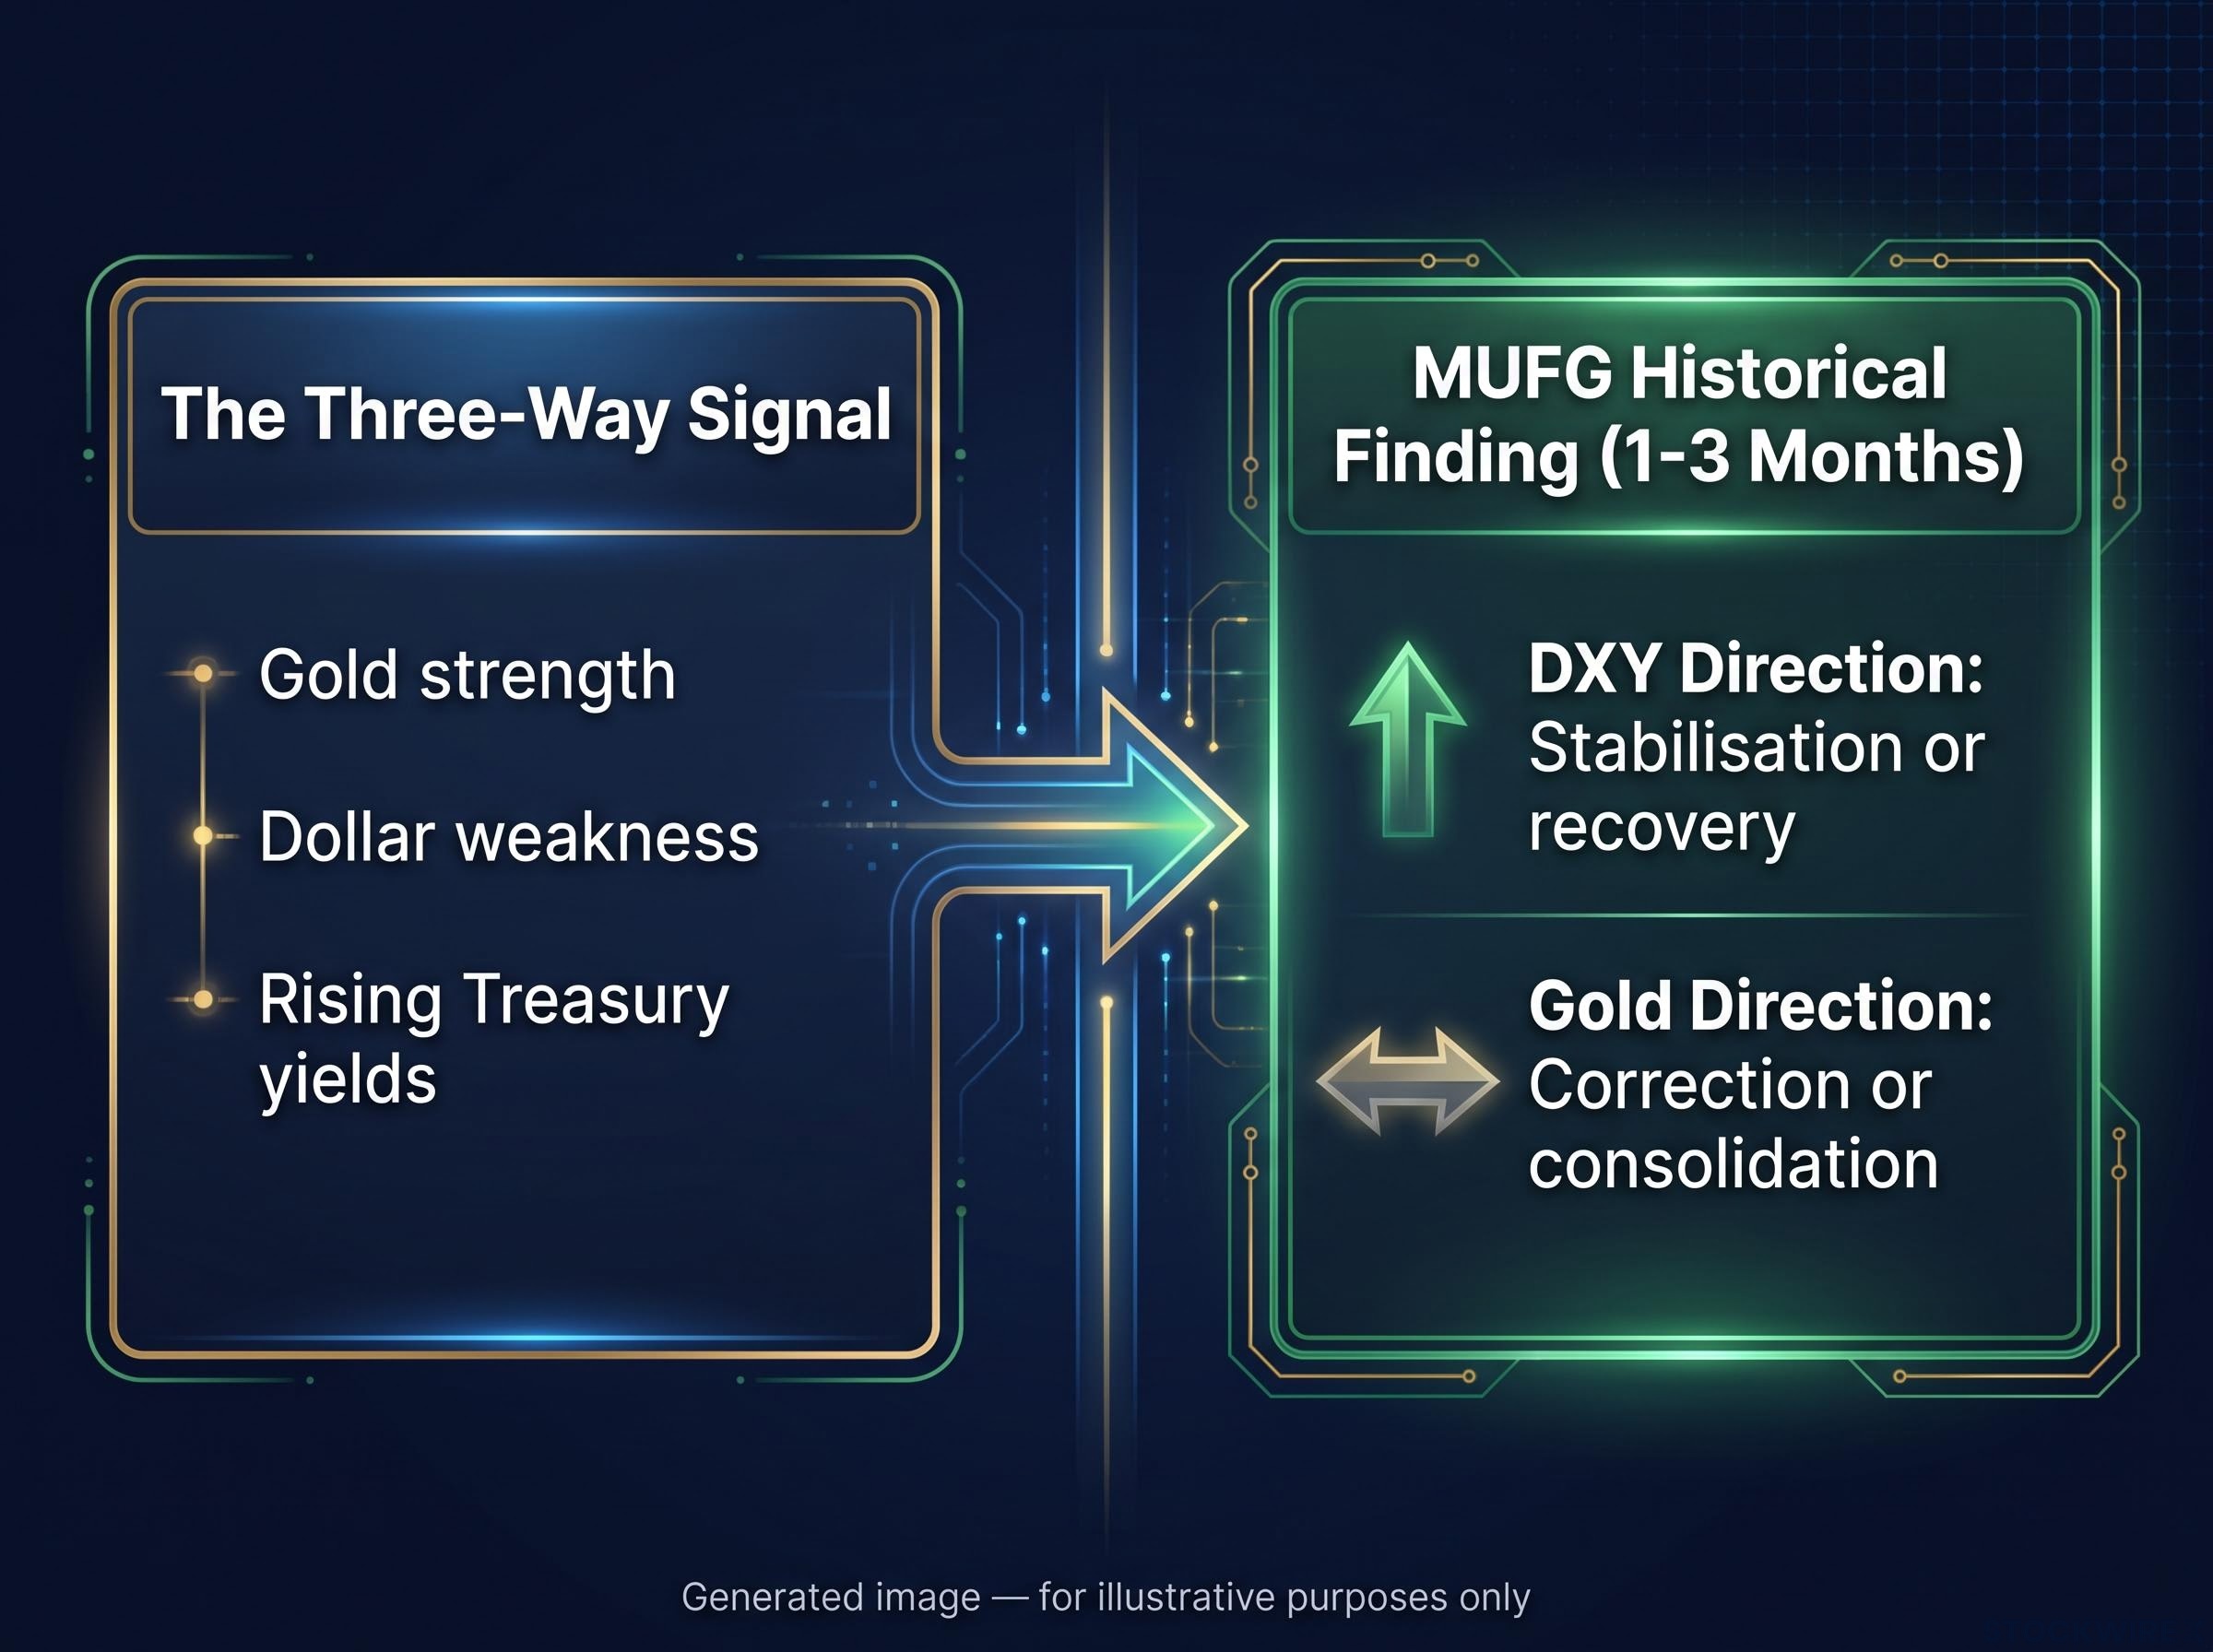
| Signal condition | DXY direction (1-3 months) | Gold direction (1-3 months) |
|---|---|---|
| Rising yields + gold strength + USD weakness | Stabilisation or recovery | Correction or consolidation |
The pattern is not random. There is a mechanical reason it keeps repeating.
Why the yield mechanism matters more than the gold price level
Gold earns no yield. It pays no coupon, no dividend, no interest. That simple fact is the engine behind the historical pattern MUFG identified. When Treasury yields rise, particularly real yields (the return on government bonds after adjusting for inflation), the opportunity cost of holding gold increases.
Consider a concrete comparison. If a 10-year Treasury pays a real return above inflation and gold pays nothing, the rational calculus shifts toward bonds. Every basis point of real yield that rises is an incremental reason to hold dollar assets instead of gold. That same yield advantage attracts foreign capital to the dollar, supporting the currency rather than weakening it.
The real yield hurdle rate that every alternative asset including gold must now clear has risen materially under the Warsh Fed, with the 10-year TIPS yield reaching a 12-month high and the median 2026 policy rate projection sitting near 3.8%, a backdrop that reinforces rather than contradicts the opportunity-cost headwind at the centre of MUFG’s historical analysis.
This tells you something important about the current signal. When gold is rising alongside Treasury yields rather than against them, the rally is more likely driven by sentiment, fiscal anxiety, or geopolitical stress than by the monetary loosening that has historically underpinned durable gold bull markets. The yield mechanism is working against the gold price even as the narrative works in its favour.
What a genuine regime shift would actually look like
The MUFG evidence does not mean the debasement thesis can never be correct. It means the conditions required to make it correct have not arrived. Here is what those conditions look like, framed not as a prediction but as the specific evidence you would need to see before changing your position.
Gold’s most powerful and durable bull markets, the post-2008 run, the 2010-11 surge, and the 2020 rally, all coincided with the same macro backdrop: real yields collapsing toward zero or deeply negative territory as the Federal Reserve eased aggressively. In those episodes, the real return on dollar cash and bonds deteriorated, the opportunity cost of holding gold fell structurally, and demand for non-yielding stores of value increased on a sustained basis.
Central bank gold accumulation running at approximately 1,000 tonnes per year, double the pace of the prior decade, introduces a structural demand component that operates largely independent of the real-yield mechanism, which is one reason the gold and dollar relationship has become harder to read through the traditional opportunity-cost lens alone.
Three conditions would need to be met for the debasement thesis to gain genuine traction:
- A decisive, sustained decline in US real yields, driven by an easing cycle rather than fiscal distress, removing the opportunity cost headwind for gold
- A shift from the current fiscal and term-premium narrative to an easing-driven regime, where lower rates and balance-sheet expansion replace deficit concerns as the dominant macro story
- Broad-based, structural dollar weakness that persists beyond short-term positioning moves, sustained by the removal of the dollar’s carry advantage rather than by sentiment alone

The MUFG framing: When yields shift decisively from rising to falling, that turn serves as a key signal that market dynamics are rotating away from a fiscal and term-premium framework and into territory where monetary easing can drive durable dollar weakness, the backdrop under which gold’s most sustained debasement-era rallies have taken root.
For you as an investor, the question is not whether gold can go higher. It is whether the macro environment that would make a sustained rally structurally supported has actually arrived. Right now, with yields elevated rather than falling, the evidence says it has not.
How to read Treasury yields as a practical signal, not just a macro concept
The MUFG framework converts neatly into something you can use. The key insight is that yield direction, not yield level, is the operative variable. What matters for gold and the dollar is whether yields are rising or falling, not whether they are nominally high or low.
Rising or elevated real yield regime:
- Gold faces an opportunity cost headwind; rallies are more likely sentiment-driven and shorter-lived
- The dollar retains carry support; weakness tends to be positioning noise rather than structural
- Gold corrections in the one-to-three month window are historically frequent
Clearly falling real yield regime (especially after a tightening cycle):
- Gold gains a structural tailwind as the opportunity cost of holding it drops
- The dollar loses its carry advantage; weakness becomes more durable
- Debasement-style narratives gain genuine macro support
The distinction gives you a rule of thumb: if yields are not falling, dollar weakness is more likely a positioning move than a trend. Treating every bout of dollar softness as confirmation of the debasement thesis conflates short-term positioning noise with structural macro change, and that conflation is where the real risk lives.
Using the 1-3 month correction window as a position-sizing input
MUFG’s historical data shows that gold corrections after the three-way signal have tended to play out over one to three months. That timeframe is a practical input for risk management, not a forecast or a trading signal.
If you hold gold positions and the three-way signal is flashing, the one-to-three month window tells you something about the horizon over which corrections have historically materialised. It informs entry timing and position size, not directional conviction. A smaller initial position with room to add if the thesis strengthens is more consistent with the probabilistic evidence than an all-in allocation based on price momentum alone.
This is a base rate, not a guarantee. History informs probabilities. It does not eliminate uncertainty.
This article is for informational purposes only and should not be considered financial advice. Investors should conduct their own research and consult with financial professionals before making investment decisions.
Waiting for the yield turn: what changes the calculus
The weight of historical evidence, reinforced by MUFG’s analysis, points toward dollar stabilisation and gold consolidation as the more probable near-term outcome while yields remain elevated. That is not a verdict on gold’s long-term prospects. It is a conditional statement: under current conditions, the macro backdrop does not support the debasement thesis.
MUFG’s closing assessment: Rising Treasury yields suggest gold’s recent surge is more likely a stressed, narrative-heavy phase than confirmed dollar debasement. With yields still elevated rather than in clear decline, the near-term balance of probabilities favours currency steadiness and a period of gold price consolidation rather than a sustained advance.
What would change the calculus is specific and measurable: a clear, durable turn lower in US real yields. Not a single weak jobs print. Not a one-week dollar dip. A sustained shift from a fiscal and term-premium environment to an easing-driven regime that strips the dollar of its yield advantage and removes the opportunity cost headwind that has historically capped gold rallies.
The gold and real yields divergence that emerged in mid-2026, with US real yields hitting multi-year highs while gold advanced rather than corrected, has raised serious questions about whether the classic inverse correlation is structurally broken and whether the current episode represents a regime shift rather than a temporary deviation from the historical pattern MUFG identified.
The framework gives you a concrete watching brief rather than a prediction. Track the direction of real yields, and let that variable, rather than short-term price action or macro commentary, determine when the regime has actually shifted. Investors who understand this framework are better positioned to respond to changing conditions than those who rely on price narrative alone.
FRED’s 10-year TIPS yield series is the authoritative real yield benchmark for tracking this variable, giving investors a direct, continuously updated data source to monitor the yield direction that the MUFG framework identifies as the operative signal for regime change.
Past performance does not guarantee future results. Financial projections are subject to market conditions and various risk factors.