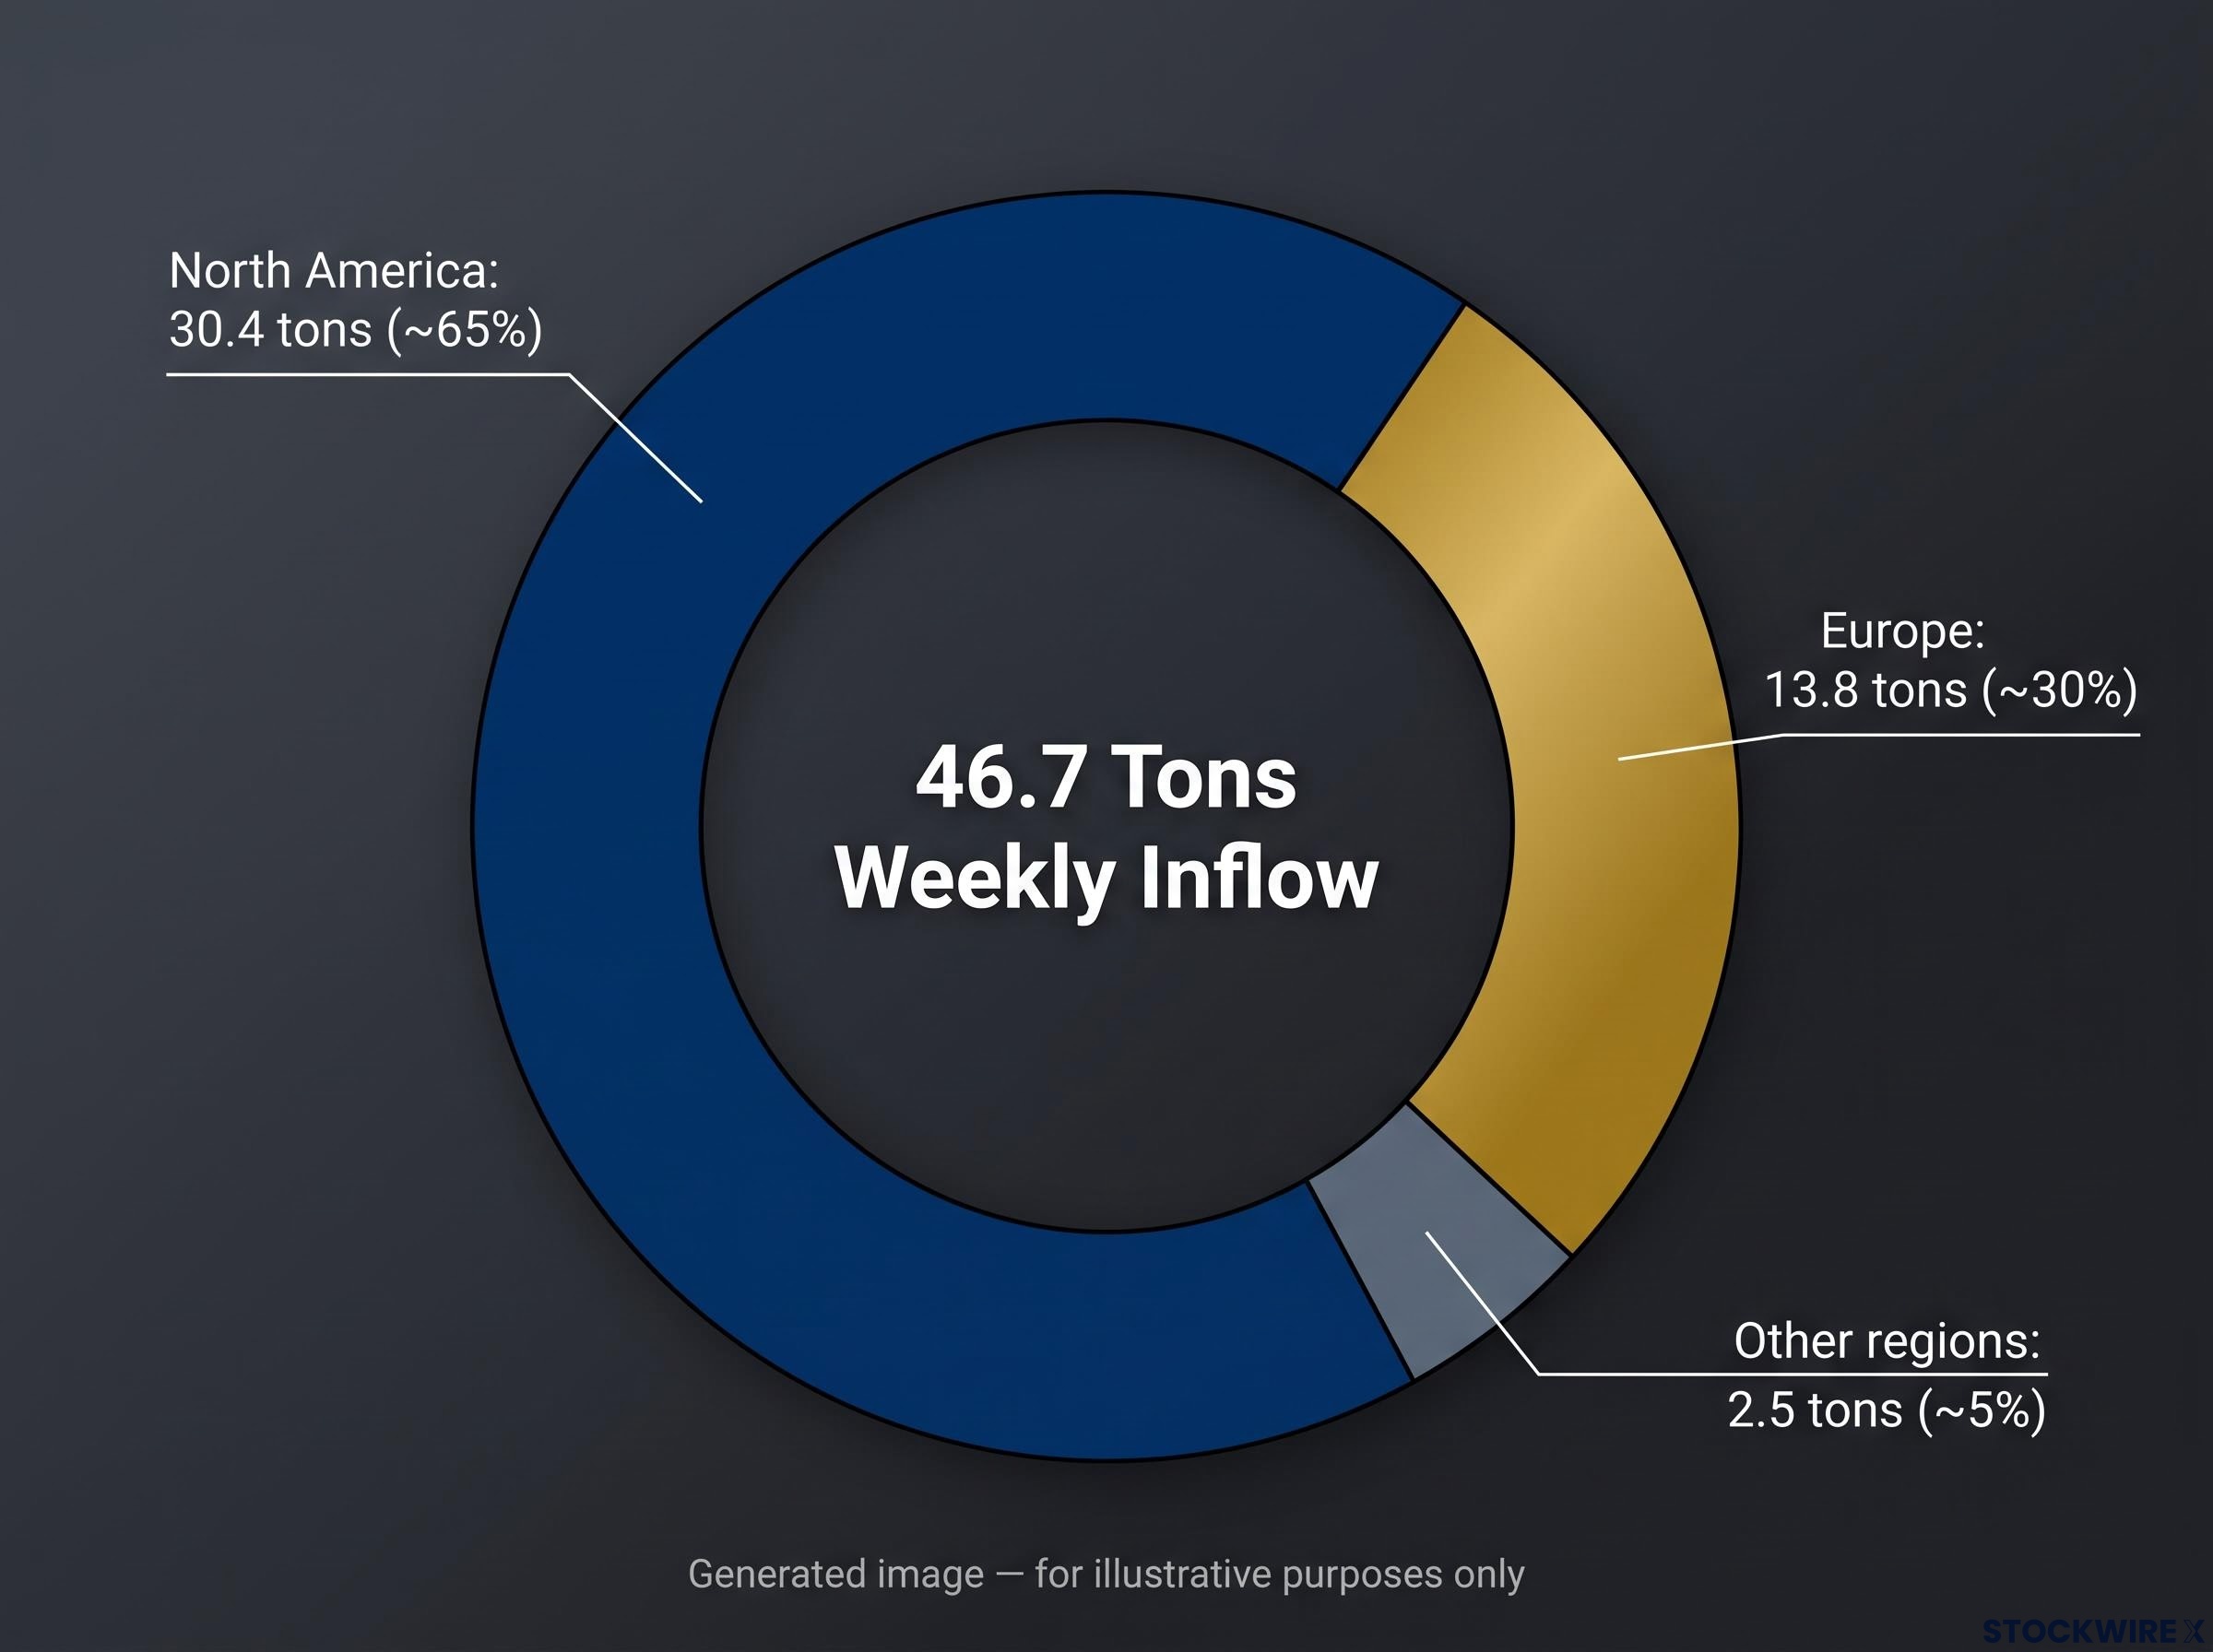
Gold ETF investors added 46.7 tons in a single week earlier this year, with North American funds accounting for nearly two-thirds of that total. That is not routine portfolio rebalancing. It is the kind of concentrated, conviction-driven positioning that tends to precede sustained price moves rather than follow them.
As US-Canada tariff friction intensified and concerns over US fiscal sustainability deepened, gold pushed to a three-month high around $4,700 per troy ounce, with the ETF surge arriving in lockstep with that macro backdrop. What followed validated the signal: gold subsequently pushed above $5,100, then above $5,500. The episode offers a case study in how macro stress translates into measurable ETF positioning, and the pattern it revealed has remained relevant through every subsequent leg higher.
Here is how to read ETF flow data as a leading indicator of gold’s directional momentum, not just as a lagging confirmation of prices already visible on a chart. The framework applies to every future World Gold Council (WGC) data release, not only the one that triggered this analysis.
What 46.7 tons in one week actually signals about investor conviction
Start with the number itself. World Gold Council data shows that global physically backed gold ETFs took in 46.7 tons across a single week, a figure that stood as the largest weekly haul recorded over the prior 10 months. In the context of recent history, where monthly inflow episodes during active periods have ranged across 20-45 tons, a single week matching or exceeding an entire month’s typical accumulation is structurally significant.
That scale matters for a specific reason: net new inflows at this magnitude shift total global ETF holdings meaningfully in compressed time. This is not tactical rotation between asset classes. It is conviction-driven positioning, capital deliberately moving into gold as a strategic allocation rather than a short-term trade.
46.7 tons in one week: the strongest weekly total in 10 months, per the World Gold Council.
The July 2026 reference point puts this in perspective. Global inflows that month reached approximately 23 tons (around $3 billion), a healthy figure that reversed prior outflows. The original episode delivered twice that volume in five trading days.
Physical ETF accumulation versus futures positioning: why the distinction matters
Not all gold demand carries the same signal quality. The ETFs tracked by the WGC hold physical bullion in custody, meaning large inflows require actual spot-market metal purchases. Three characteristics distinguish this type of accumulation from futures-driven positioning:
- Custody of metal: Physical ETFs hold allocated gold bars in vaults. Inflows create real demand for physical supply, not just paper exposure.
- Multi-month decision horizon: Institutions and sophisticated investors adding to physically backed ETFs are typically making allocation decisions measured in quarters, not days.
- Institutional user base: Large US-listed gold ETFs such as GLD and IAU serve as strategic tools for hedge funds, pension allocators, and wealth managers, not primarily as retail speculation vehicles.
Futures positioning can reverse rapidly when sentiment shifts. A leveraged speculator can exit a gold futures position in minutes. Physical ETF holdings, by contrast, tend to persist across multiple months. That persistence is what makes the signal valuable: sustained inflows are validation of a shift in sentiment, not a reflection of it after the fact.
When big ASX news breaks, our subscribers know first
North America’s outsized share and what it tells you about the catalyst
The global total is informative. The regional breakdown is diagnostic.
Within the 46.7-ton weekly total, North American funds were responsible for 30.4 tons, a share of approximately 65% of the global figure, while European ETFs added 13.8 tons, accounting for roughly 30%. The remaining regions accounted for the balance.
| Region | Tons | Share of Total | Primary Catalyst Driver |
|---|---|---|---|
| North America | 30.4 | ~65% | US-Canada tariffs, fiscal anxiety, dollar-credibility concerns |
| Europe | 13.8 | ~30% | Broader safe-haven demand, secondary spillover |
| Other regions | 2.5 | ~5% | Mixed regional drivers |
When North American funds dominate global inflows at a ratio this lopsided, the catalyst is US-centric by definition. The fingerprint points to tariff policy, fiscal anxiety, and dollar-credibility concerns rather than European political risk or global growth fears.
The US-Canada tariff escalation provides the specific context. Starting in early 2025, the US imposed 25% tariffs on most Canadian goods and 10% on energy, later escalating to 35% and 50% on select categories through 2026. These are not routine trade adjustments between distant partners. They represent economic confrontation between close allies, the kind of policy shock that makes investors question whether the rules-based framework underpinning dollar-asset confidence still holds.
The US-Canada tariff escalation that catalysed the 46.7-ton ETF inflow episode extended materially through mid-2026: the US imposed 50% tariffs on roughly $20 billion in Canadian imports across consumer goods, dairy, cement, and apparel while bypassing USMCA protections entirely, a policy step that removed the treaty-status backstop investors had previously relied on.
Commerzbank analyst Carsten Fritsch assessed the macro backdrop as one likely to keep gold moving higher, with the bank taking the view that ongoing developments provided a solid foundation for ETF buying to continue alongside further price gains.
The 65% North American share is not a regional footnote. It is the fingerprint of a US-specific risk premium being priced into gold. Future WGC regional breakdowns offer a direct way to test whether that premium is expanding or contracting: when North America leads by a wide margin, the driver is a US-centred macro concern, and the trade is likely to have more room before it exhausts the available buyer pool.
How trade disputes and fiscal anxiety convert into safe-haven capital flows
The connection between a tariff headline and a gold ETF inflow is not automatic. There is a transmission mechanism, and understanding it separates investors who can anticipate gold moves from those who merely react to them.
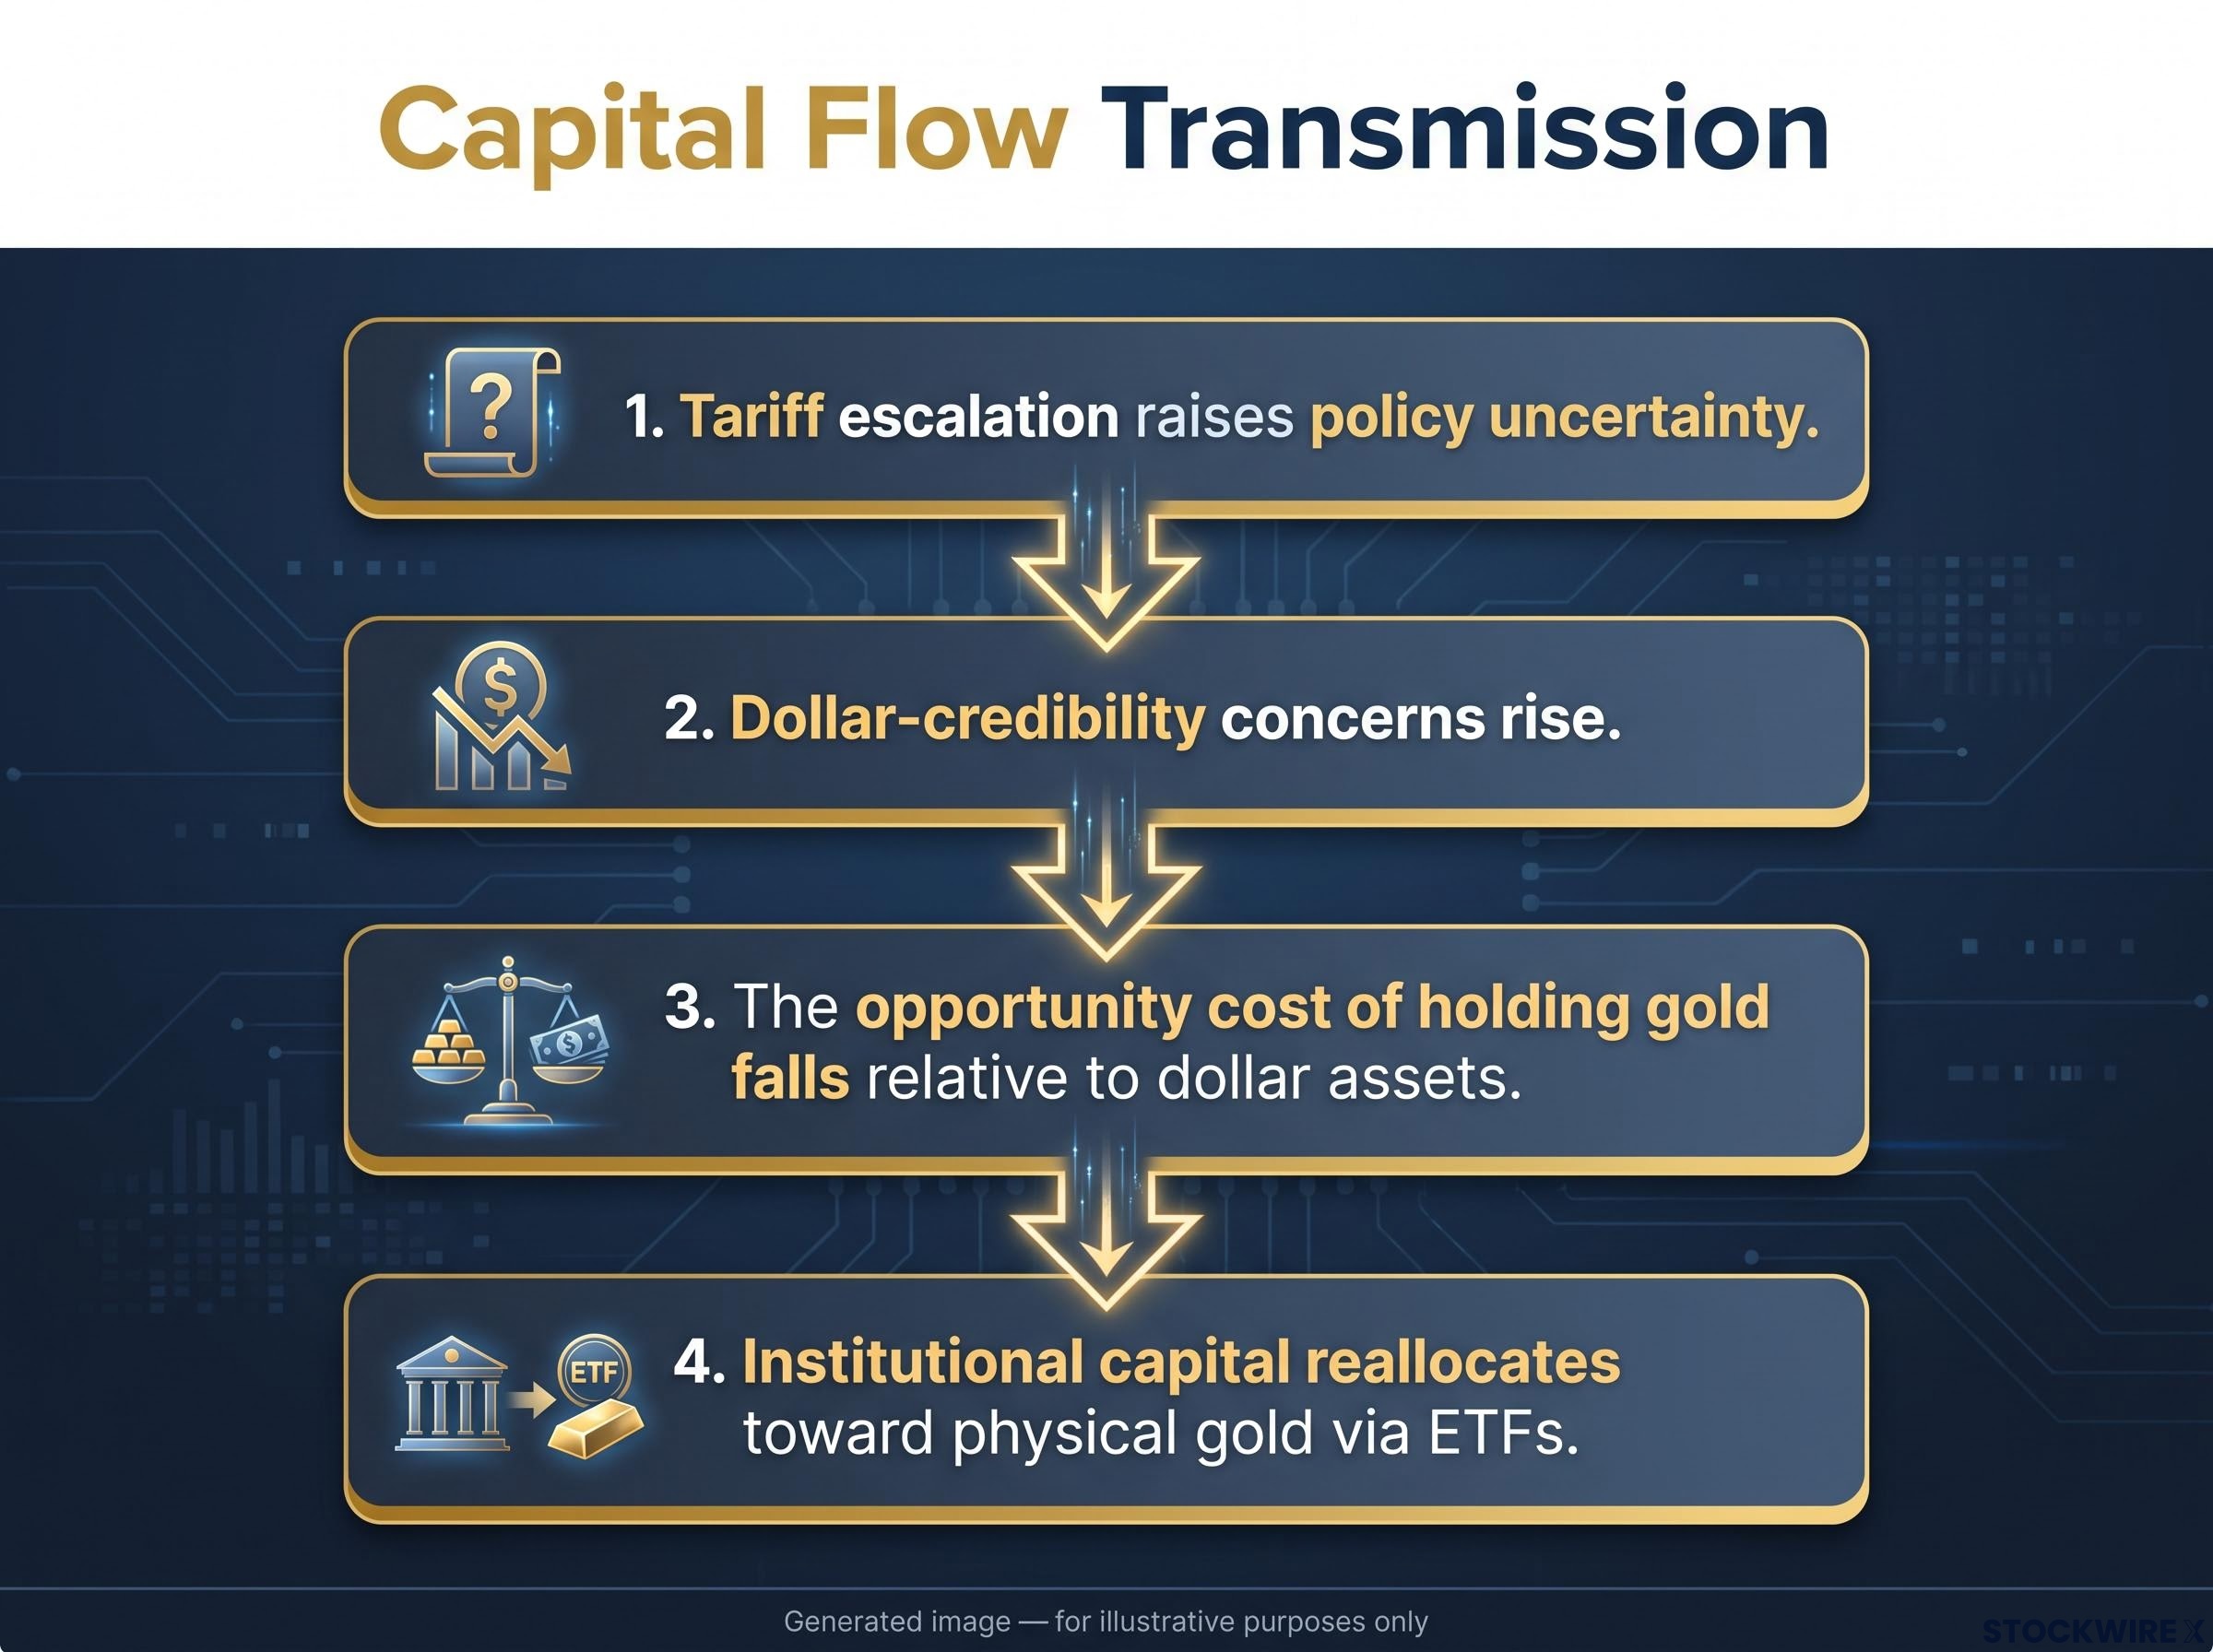
The chain operates in four steps:
- Tariff escalation raises policy uncertainty. Trade disputes involving close allies undermine the perception of US policy as predictable and rules-based, something global capital has priced in for decades.
- Dollar-credibility concerns rise. When the US weaponises economic linkages against allies, reserve managers and private investors begin to question the reliability of dollar-denominated assets as a default store of value.
- The opportunity cost of holding gold falls relative to dollar assets. Even with positive yields on Treasuries, the perceived risk of holding dollar assets rises, which narrows gold’s traditional yield disadvantage.
- Institutional capital reallocates toward physical gold via ETFs. The allocation shift materialises in the WGC flow data, often before the price move fully plays out.
The week running into the $4,700 peak saw gold advance by more than 5%, a move that proved to be an early waypoint rather than a ceiling. Gold subsequently climbed above $5,100 and then past $5,500 in the months that followed, confirming the episode as an early signal within a larger trend rather than a standalone event.
Why fiscal stress amplifies the tariff signal rather than acting independently
Tariff shocks and fiscal anxiety reinforce each other. Tariffs raise inflation risk while fiscal deterioration raises currency-debasement risk. Both benefit gold, but operating simultaneously they improve the opportunity-cost calculation on two dimensions at once, making the allocation case stronger than either driver alone would justify.
Markets have repeatedly reacted to US shutdown risks, debt-ceiling brinkmanship, and questions about long-term debt sustainability. When investors question whether US Treasuries retain their unquestioned risk-free status, the structural advantage gold offers as a non-sovereign store of value becomes more compelling, not less.
Long-term debt sustainability concerns have moved from theoretical to operationally priced: Moody’s stripped the US of its last triple-A credit rating in May 2025, and BlackRock, JPMorgan, Goldman Sachs, and Bridgewater have independently rotated away from long-duration nominal Treasuries toward real assets, a convergent institutional positioning shift that runs in parallel with the ETF gold inflows documented here.
Silver and platinum also posted gains during this period, confirming a broad hard-asset bid rather than a gold-specific technical event. That corroboration matters: a macro-driven precious metals rally has a different durability profile than a move concentrated in one metal.
The dual-engine dynamic tells you something specific about risk assessment. A gold rally with both tariff friction and fiscal stress present is more durable than one driven by a single headline, because both engines would need to reverse simultaneously for the safe-haven premium to fully unwind.
ETF flows as a forward indicator: reading the cycle before prices confirm it
The most useful feature of the $4,700 episode is not what it told investors at the time. It is the framework it confirmed for reading what comes next.
Sustained, North America-led ETF inflows characterise the early-to-middle phase of a safe-haven cycle, not a terminal blow-off. The subsequent price trajectory validated this reading: gold moved from $4,700 through $5,100 and above $5,500 in the months that followed. The original flow data was not describing a crowded trade nearing exhaustion. It was describing institutional capital still building exposure.
Flows lead prices in safe-haven cycles, not the reverse. The investor who monitors WGC flow direction has a timing advantage over the one who waits for price confirmation.
The July 2026 inflows of approximately 23 tons offer a useful post-peak normalisation reference. Flows moderated but did not reverse sharply into outflows, suggesting the cycle had room remaining rather than having already matured. The WGC’s mid-year 2026 outlook supports this reading, highlighting structural factors underpinning continued institutional gold demand.
OTC investment flows complicate the WGC headline figures: the category delivered 327 tonnes in Q2 2026 alone, a volume that most coverage omits entirely, meaning the reported 46% drop in investment demand was a composition shift rather than evidence of weakening conviction among large institutional participants.
The World Gold Council ETF flow data for July 2026 shows global inflows reaching approximately 23 tons, a figure that illustrates how post-peak normalisation looks in practice: positive but roughly half the pace of the record weekly episode that preceded it.
A two-sided monitoring framework applies going forward:
- Signs the cycle is continuing: Sustained positive weekly or monthly inflows, North American ETFs leading the regional breakdown, price consolidations that hold above prior support levels, and continued presence of tariff or fiscal headlines.
- Early warning signs of cycle maturation: A sharp, multi-week reversal into net outflows (especially North America-led), a meaningful and sustained rise in real yields, rapid US-Canada trade de-escalation, or a decisive reduction in fiscal uncertainty.
This gives you a prospective tool rather than a retrospective one. Track North American ETF flow direction from the WGC as a primary signal, use price action as confirmation, and treat a sustained reversal in North American flows as the first warning to reassess positioning.
What the $4,700 episode still tells investors positioning today
The $4,700 episode was significant not because of the price level. It was significant because the ETF flow data confirmed that institutional capital was leading the move rather than following it. The 46.7-ton weekly inflow, with 65% from North America, preceded the larger price moves that followed. The flow data was telling investors something about future positioning before the price arrived.
The structural case for elevated gold allocations persists as long as three underlying drivers remain active:
- Trade friction: US-Canada tariff escalation and broader trade-war rhetoric continue to undermine dollar-asset confidence.
- Fiscal stress: Shutdown risks, debt-ceiling brinkmanship, and long-term debt sustainability concerns remain unresolved.
- Dollar-credibility concerns: Recurring policy unpredictability erodes the default premium investors have historically assigned to dollar-denominated assets.
The thesis would weaken under two conditions:
- Rapid US-Canada de-escalation combined with a broader normalisation of trade relationships.
- A meaningful and sustained rise in real yields, which would restore gold’s opportunity-cost disadvantage.
Gold’s trajectory from $4,700 through $5,100 and above $5,500 in 2026 has empirically validated the early-cycle reading. That does not guarantee the next leg follows the same path. But the framework for monitoring it remains the same: watch North American ETF flow direction from WGC data as the primary leading indicator, use price action as the lagging confirmation, and treat a sustained reversal as the signal to reassess.
A testable framework for monitoring gold’s safe-haven cycle is more useful than a price target. Price targets give you a single binary call. The flow framework gives you ongoing judgment.
For investors wanting to map the current ETF flow framework against specific price scenarios and catalyst timelines, our dedicated guide to gold’s H2 2026 outlook examines how the Federal Reserve’s October rate decision interacts with institutional positioning data to define the most probable recovery range from the mid-2026 correction.
This article is for informational purposes only and should not be considered financial advice. Investors should conduct their own research and consult with financial professionals before making investment decisions. Past performance does not guarantee future results. Financial projections are subject to market conditions and various risk factors.