In a single quarter, one of the world’s most disciplined value investors, one of its most aggressive macro traders, and one of its sharpest event-driven operators all did the same thing: they loaded up on Amazon. That does not happen by accident.
SEC 13F filings for Q2 2026, released in mid-August, reveal an unusual cluster of institutional conviction around the stock. Stanley Druckenmiller rebuilt a position he had nearly eliminated. Seth Klarman, who has built his career on buying out-of-favour assets with a margin of safety, made Amazon his single largest holding. David Tepper followed suit. Viking Global more than tripled its stake. These are not managers who coordinate their moves or share a playbook.
Their convergence in the same quarter around the same stock is the kind of signal that serious investors pay attention to. This piece works through exactly who bought, how much they committed, what their track records suggest about their reasoning, and why concurrent insider selling at Amazon complicates the picture. The goal is to give you a clear-eyed view of what sophisticated capital is saying about the stock right now, and what that does and does not tell you about its prospects.
Five very different investors, one very large bet
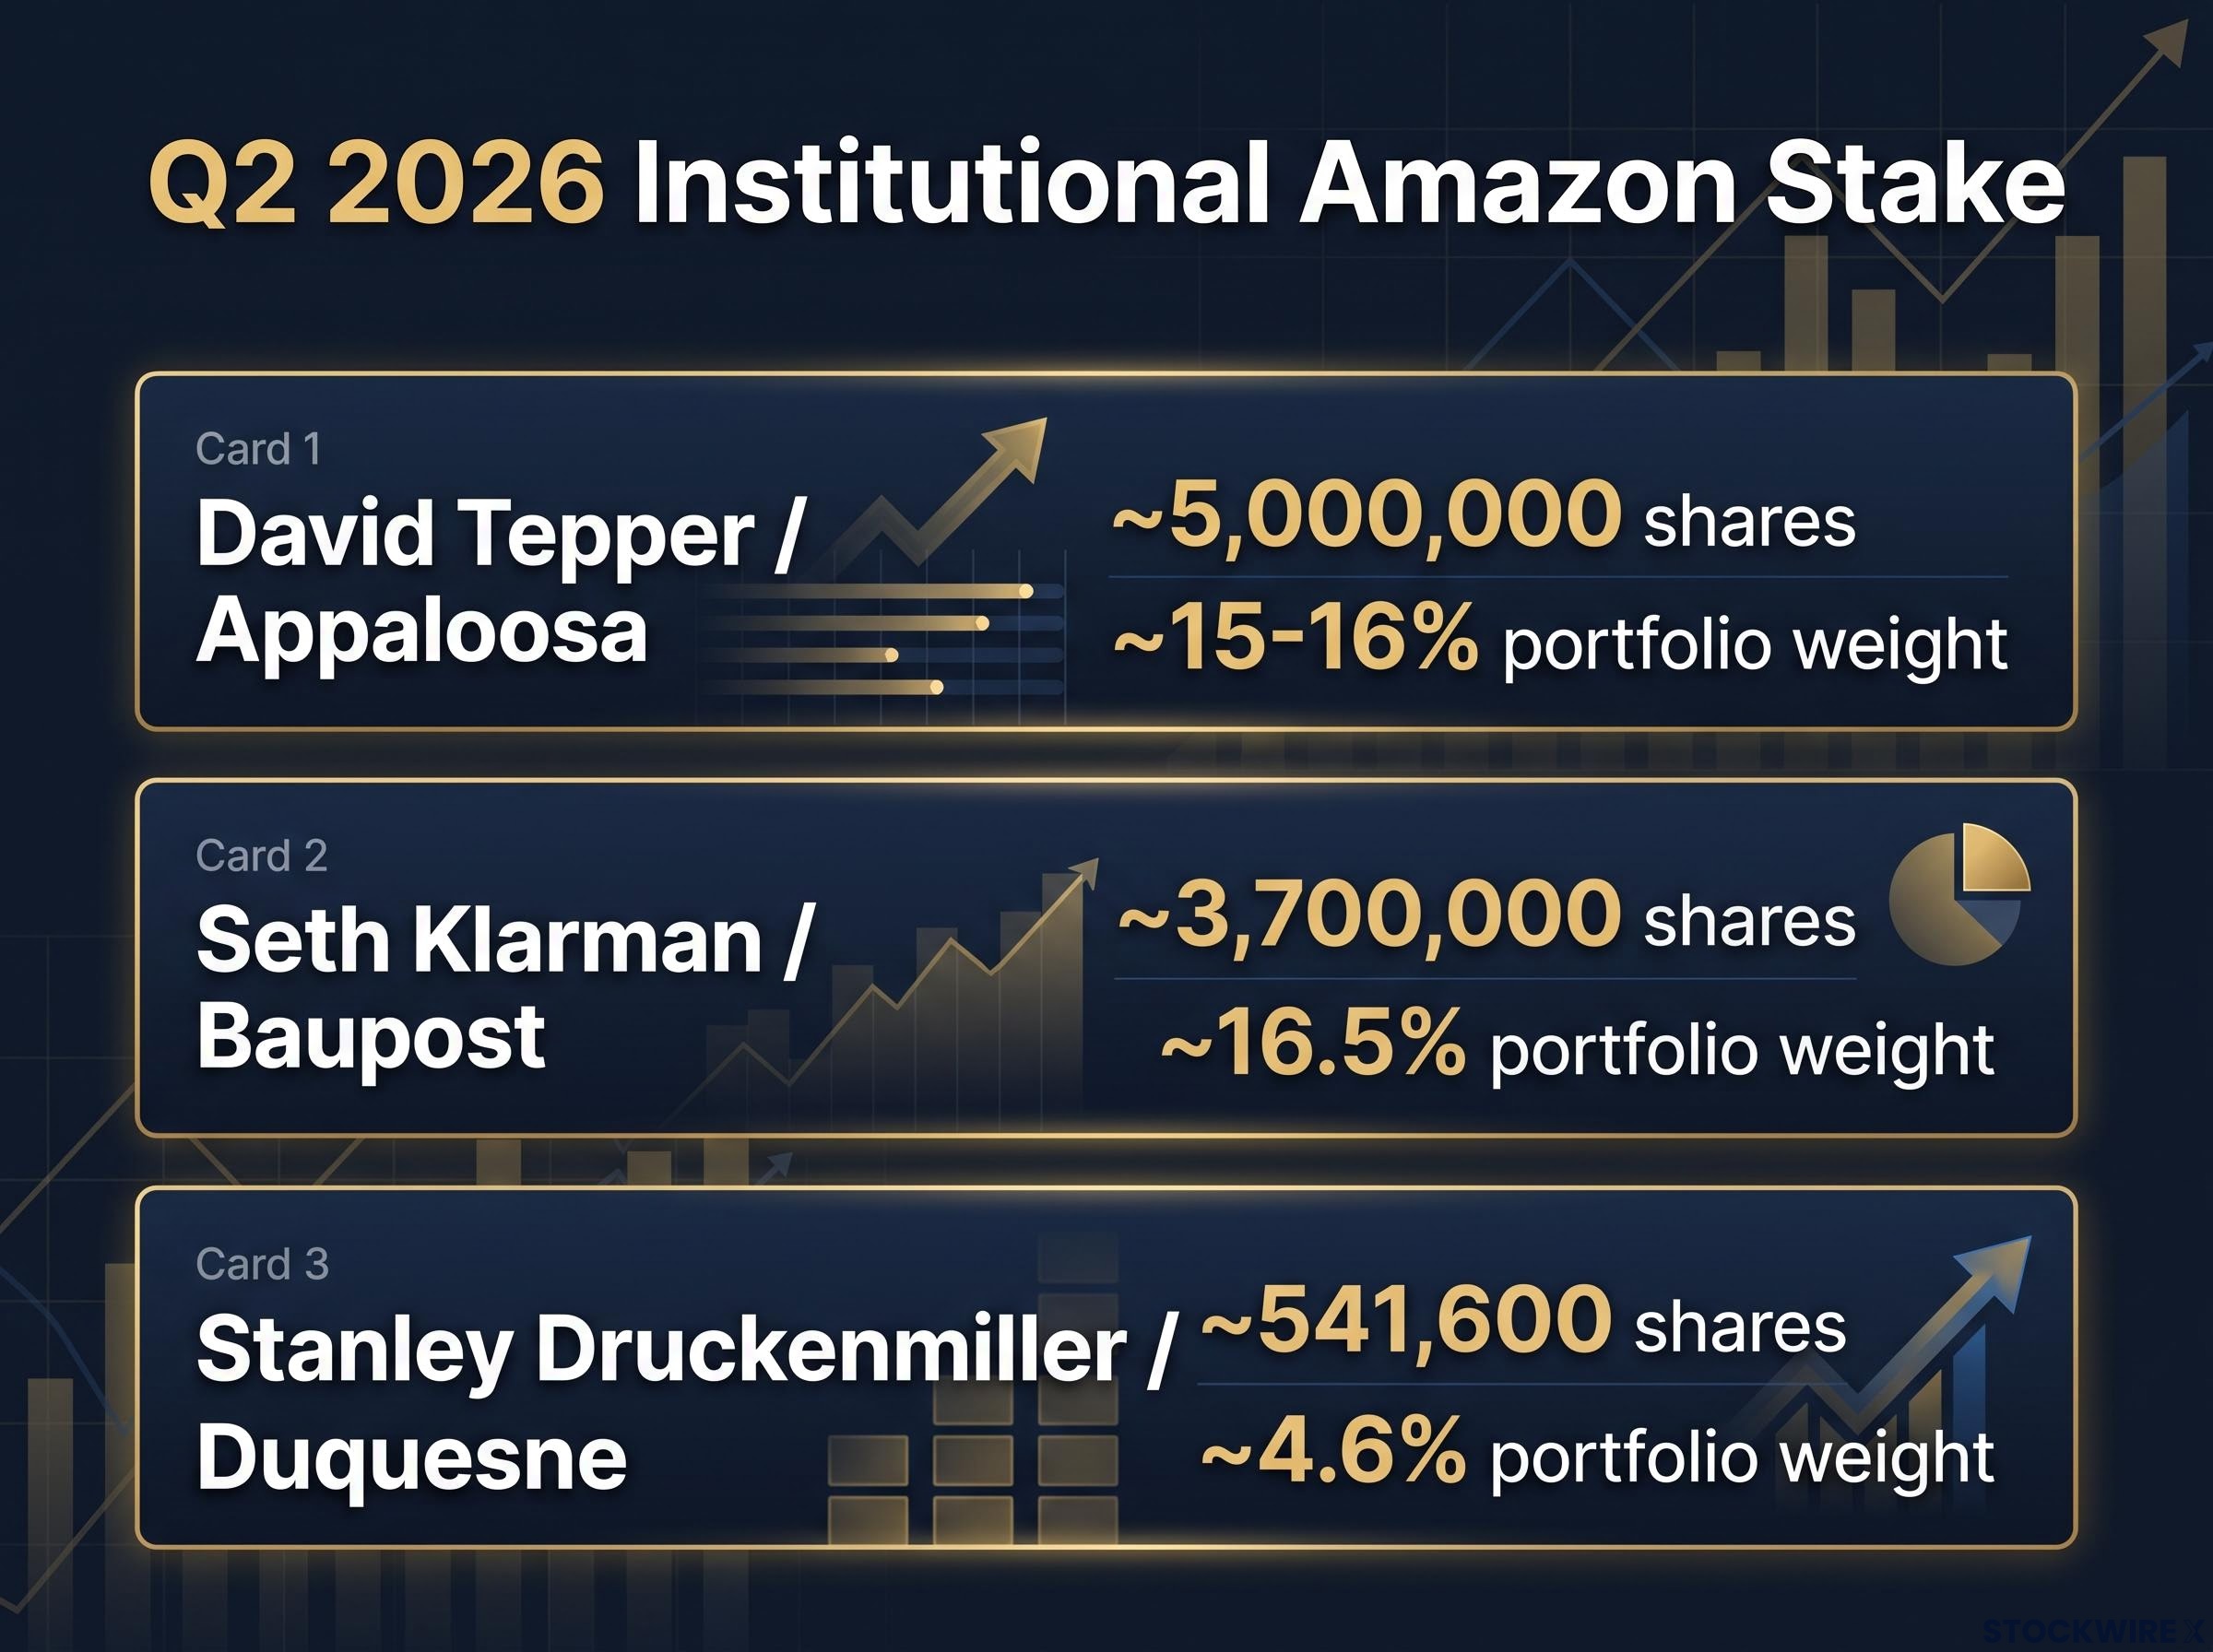
Start with the most dramatic move. Druckenmiller’s Duquesne Family Office cut its Amazon position by approximately 94% in Q1 2026, effectively exiting the stock. One quarter later, the firm reversed course entirely, raising the stake by more than 1,000% to approximately 541,600 shares, roughly 4.6% of its $5.2 billion portfolio. A macro trader does not execute that kind of whipsaw casually.
David Tepper’s Appaloosa Management lifted its stake by approximately 680,000 shares to roughly 5 million shares total. At approximately $1.19-$1.2 billion, Amazon became Appaloosa’s largest publicly disclosed holding, comprising roughly 15-16% of the portfolio.
Then there is Seth Klarman. Baupost Group added approximately 625,000 shares, bringing its total to roughly 3.7 million shares. Amazon now represents approximately 16.5% of Baupost’s roughly $5.42 billion 13F portfolio.
The Klarman signal: A deep value manager whose entire identity is built around margin of safety committed nearly $900 million, approximately 16.5% of his portfolio, to a single stock trading near record highs. That is not a casual allocation.
Viking Global, a fundamentally driven long/short equity fund, raised its holding from approximately 1.2 million shares to approximately 3.7 million shares, representing a stake that expanded by more than 210% across the quarter.
Bill Ackman’s Pershing Square maintained Amazon as a multi-billion-dollar core holding throughout the quarter. Q2 activity represented a portfolio-size adjustment rather than a thesis change; Amazon remains one of the fund’s largest positions.
| Manager / Fund | Q2 2026 Activity | Approx. Shares Held | Approx. Position Value | Portfolio Weight |
|---|---|---|---|---|
| Druckenmiller / Duquesne | >1,000% increase | ~541,600 | ~$129-$238M | ~4.6% |
| Tepper / Appaloosa | Added ~680,000 shares | ~5,000,000 | ~$1.19-$1.2B | ~15-16% |
| Klarman / Baupost | Added ~625,000 shares | ~3,700,000 | ~$900M | ~16.5% |
| Viking Global | More than tripled stake | ~3,700,000 | Not disclosed | Not disclosed |
| Ackman / Pershing Square | Adjusted; remains core holding* | Multi-billion-dollar stake | ~$2.4-$3.0B (Q1 ref.) | Major holding |
\Pershing Square’s precise Q2 share count requires direct SEC filing verification. Amazon remains one of the fund’s largest positions.*
A macro trader, a deep value manager, an event-driven specialist, and a fundamentals-driven long/short fund all arriving at the same stock in the same quarter is a meaningfully different signal from a single famous investor making a big bet. Multiple independent analytical frameworks are pointing at the same conclusion. That convergence is what makes the Q2 filings worth taking seriously.
Institutional overlap signals carry more analytical weight when structurally different investor types converge independently: Goldman Sachs cross-references nearly 1,500 funds managing $10 trillion in equity assets to isolate names where hedge funds and mutual funds reach the same conclusion simultaneously, a methodology that has produced approximately 3 percentage points of annualised outperformance over the S&P 500 since 2013.
When big ASX news breaks, our subscribers know first
What 13F filings actually tell you (and what they hide)
Before drawing too many conclusions from these numbers, it is worth understanding exactly what you are looking at and where the blind spots are.
A 13F filing is a quarterly disclosure required of any investment manager with at least $100 million in assets under management. It reports long positions in U.S.-listed equities, and it is due within 45 days of the quarter’s end. The Q2 2026 filings reflect positions as of 30 June 2026 and were released in mid-August.
What 13Fs disclose:
- Long positions in U.S.-listed equities (common stock)
- Share counts and approximate market values at quarter-end
- Partial options data (some call and put positions)
What 13Fs do not disclose:
- Short positions
- Most derivatives and swaps
- Non-U.S.-listed securities
- Full options exposure and hedging strategies
- Any changes made after the quarter-end snapshot date
Several of the managers cited in this analysis hold options alongside common stock, which means the economic picture is structurally incomplete. The dollar figures and share counts, particularly those inferred from reported dollar values and prevailing prices, are approximations and should be treated as such.
What the filings cannot tell you
The most important limitation is interpretive, not mechanical. A 13F tells you what a manager did. It does not tell you why. Every thesis attribution in this analysis, and in any 13F coverage you read, is inference based on publicly available commentary, not a confirmed statement from the manager. That distinction matters.
The timing lag matters too. These positions were established as of 30 June 2026 and became public in mid-August. For a macro trader like Druckenmiller, a lot can change in six weeks. The data you are reading now is a snapshot from nearly two months ago, not a live portfolio feed.
Understanding these limits does not undermine the signal. It refines it. You are better positioned to use this data if you account for the lag, the incompleteness, and the inference problem than if you treat a 13F as a current recommendation.
The insider selling problem: executives cashing out while funds load in
While institutional managers were building positions in Q2, Amazon executives were selling. The specific transactions tell an interesting story:
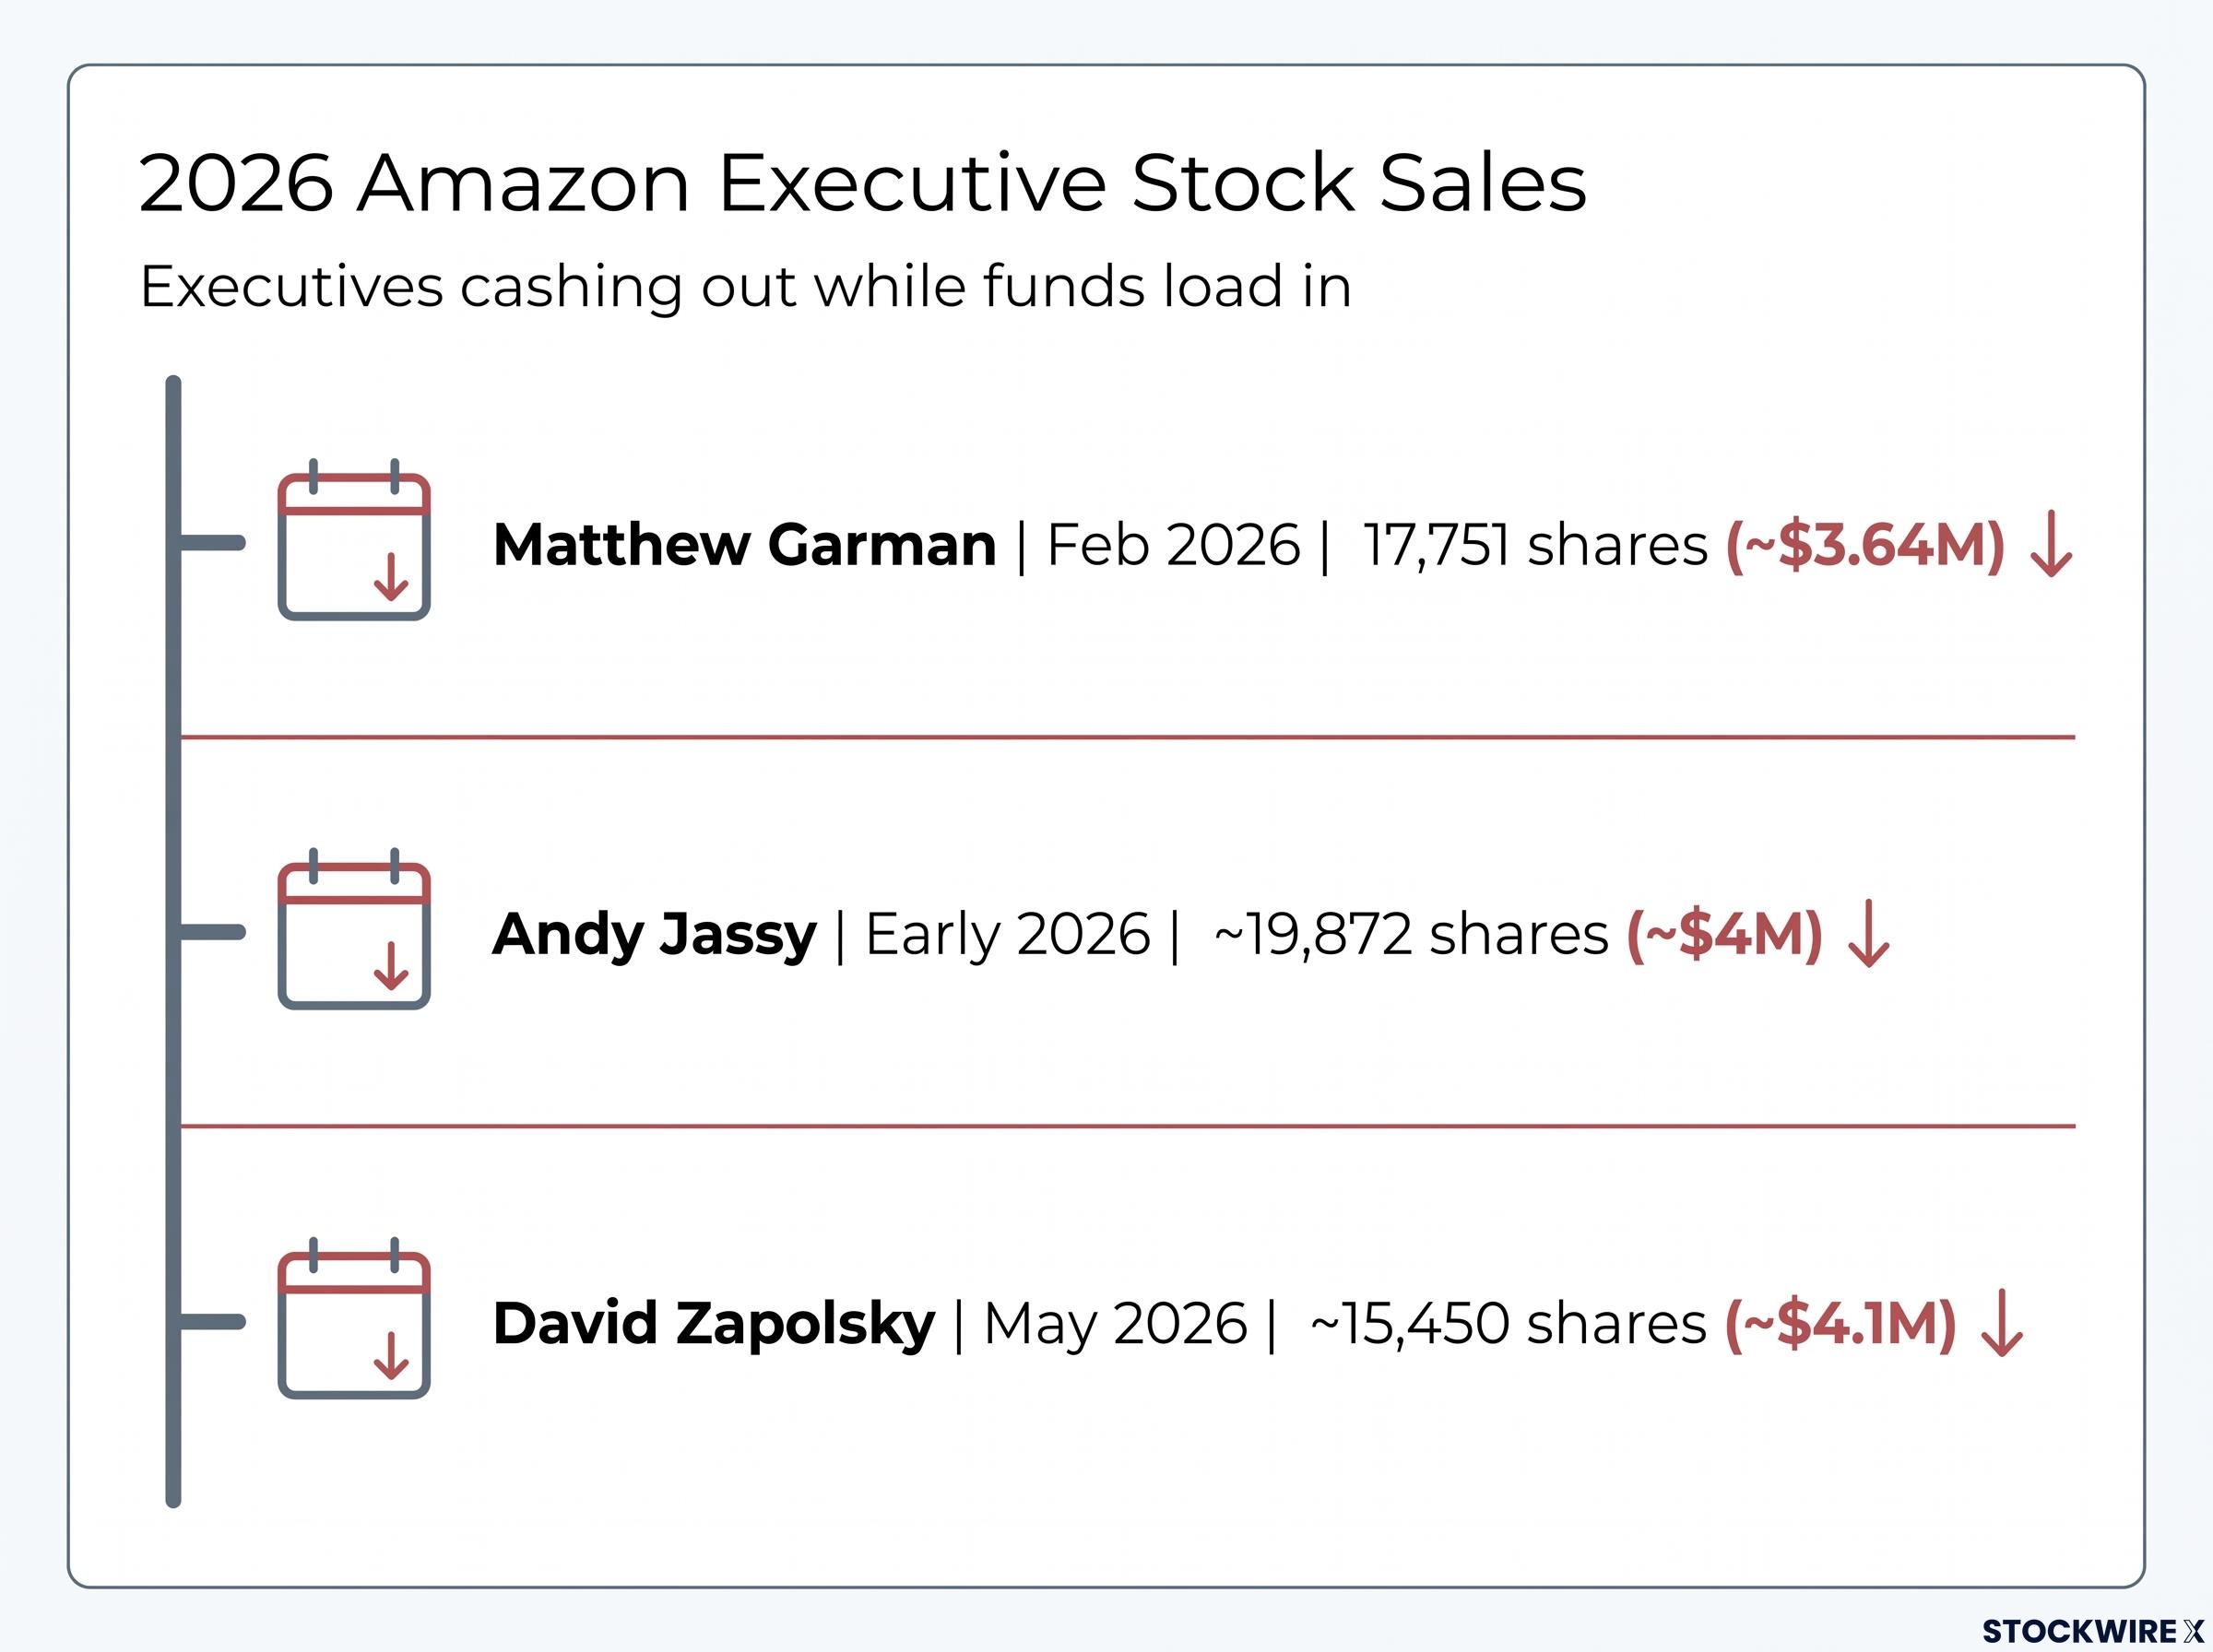
- Matthew Garman, AWS CEO, sold 17,751 shares in February 2026 for approximately $3.64 million, with additional sales in May 2026.
- Andy Jassy, CEO, sold approximately 19,872 shares in early 2026, raising approximately $4 million.
- David Zapolsky, SVP, sold approximately 15,450 shares in May 2026 for approximately $4.1 million, with the stock trading near its 52-week high.
- Douglas Herrington, Worldwide Stores CEO, sold smaller blocks in May, June, July, and August 2026 under pre-arranged trading plans.
On the surface, executives selling while sophisticated funds are buying looks like a contradiction. The mechanism behind the selling changes its informational value.
The 10b5-1 distinction: A Rule 10b5-1 plan is a pre-scheduled trading programme, established by an insider months in advance, specifying dates and conditions for selling shares. Multiple Amazon Form 4 filings explicitly cite these plans. A pre-scheduled sale set in motion months earlier tells you something very different from an executive who picked up the phone and called their broker last week.
This does not mean you should ignore the selling entirely. Executives choosing to diversify at elevated prices is a data point. But interpreting pre-arranged 10b5-1 sales as a bearish signal about the company’s near-term prospects would be a misread of what these transactions represent.
The divergence is analytically interesting precisely because both sides can be correct simultaneously for different reasons. Institutional managers may see a multi-year compounding story. Executives may simply be managing personal wealth concentration in a stock that comprises the vast majority of their net worth. Neither reading cancels the other.
The investment themes most likely driving institutional conviction
So what are these managers seeing? No manager cited here has publicly confirmed their specific thesis. But the investment themes most commonly cited in current institutional analysis of Amazon point to where independent conviction is most plausibly converging.
- AWS margin expansion: The cloud division’s profitability trajectory has been improving, and the operating leverage as revenue scales is a core earnings quality theme.
The AWS margin trajectory is central to understanding why managers with different mandates are arriving at the same conclusion: AWS grew 37% year over year in Q2 2026 at a 39.4% operating margin, yet trailing-twelve-month free cash flow swung negative $7.6 billion as capital expenditures surged 68%, creating the tension between earnings quality and capital intensity that value and growth investors are weighing differently.
- Advertising revenue growth: Amazon’s advertising business is an increasingly significant high-margin revenue stream layered on top of the retail and cloud businesses, and it is growing faster than most investors appreciate.
- AI infrastructure positioning: Amazon’s capital deployment into AI compute infrastructure creates optionality on the AI buildout, an area where the company’s scale advantages are difficult to replicate.
AI infrastructure returns became a concrete data point rather than a thesis in Q2 2026, with AWS posting 37% growth and Microsoft shares rising 15.51% in a single session after results confirmed that the capital deployed into AI compute was generating commercial revenue at scale, the exact validation event that institutional managers building positions earlier in the year were underwriting.
- Long-term free cash flow compounding: The reinvestment capacity of the business, and the compounding effect of deploying those cash flows into high-return projects, is the through-line connecting value investors to growth-oriented funds.
- Retail segment operating margin inflection: The e-commerce division is undergoing a structural shift, with its earnings contribution strengthening as the segment transitions toward a more profitable operating model.
Why different philosophies are pointing at the same stock
A deep value manager like Klarman likely weights free cash flow compounding and margin of safety at current valuations most heavily. A macro trader like Druckenmiller may be placing a larger bet on the AI infrastructure cycle and its macro implications. A fundamentally driven long/short fund like Viking Global is probably focused on the earnings quality trajectory across all three business segments.
The fact that these different analytical starting points produce the same equity conclusion is less likely to reflect narrative crowding or shared information than it would be if three growth-oriented momentum funds had done the same thing. When managers with genuinely different mandates converge independently, the signal carries more analytical weight than any single position, no matter how large.
That divergence in reasoning is as important as the convergence in action. It suggests the bull case has multiple independent pillars rather than a single thesis that everyone is borrowing from the same source.
What to do with a smart-money signal at record prices
The institutional accumulation described here occurred while Amazon was trading at or near record highs during Q2 2026. This is not bargain-hunting. It is conviction at elevated prices, which tells you something about how long these managers’ time horizons likely extend.
AI crowding risk is the structural counterargument to the convergence signal described here: the June 2026 BofA Global Fund Manager Survey recorded 80% of institutional managers naming long global semiconductors as the most crowded trade in the survey’s history, a data point that complicates the interpretation of any concurrent institutional accumulation in AI-adjacent positions.
The Tepper and Klarman position sizes offer a useful reference point. Committing 15-16% and 16.5% of a portfolio to a single stock is what high conviction looks like at the institutional level. Most individual investors would not, and should not, mirror that concentration without the hedging infrastructure and risk management systems these funds operate.
Before deciding what weight to give this signal, there are questions worth sitting with:
- Is your time horizon long enough to match what these managers appear to be underwriting: a multi-year compounding story, not a short-term trade?
- Are you using this data as one input within a broader analytical process, or as the primary driver of a decision?
- Have you independently evaluated the bull case themes, particularly AWS margins, advertising growth, and AI capital deployment returns, on their own merits?
- Does your current portfolio already have meaningful technology or mega-cap exposure that would make adding Amazon a concentration risk rather than a diversification?
The most useful thing this convergence tells you is not whether to buy Amazon. It tells you what some of the most sophisticated investors in the world think the next few years of the business look like.
What to watch: The variables that will either validate or complicate the bull thesis in coming quarters are the AWS revenue and margin trajectory, the pace of advertising revenue growth, and whether Amazon’s substantial AI capital deployment begins generating visible returns. Those are the signposts that will tell you whether the institutional conviction was well-placed.
Whether that thesis matches your own view, given your own risk tolerance and time horizon, is the actual question worth sitting with. Following sophisticated capital without understanding the underlying reasoning is a different activity from using institutional positioning as one data point, and generally a riskier one.
This article is for informational purposes only and should not be considered financial advice. Investors should conduct their own research and consult with financial professionals before making investment decisions. Past performance does not guarantee future results. The positions described reflect 13F filings as of 30 June 2026 and may have changed since that date.