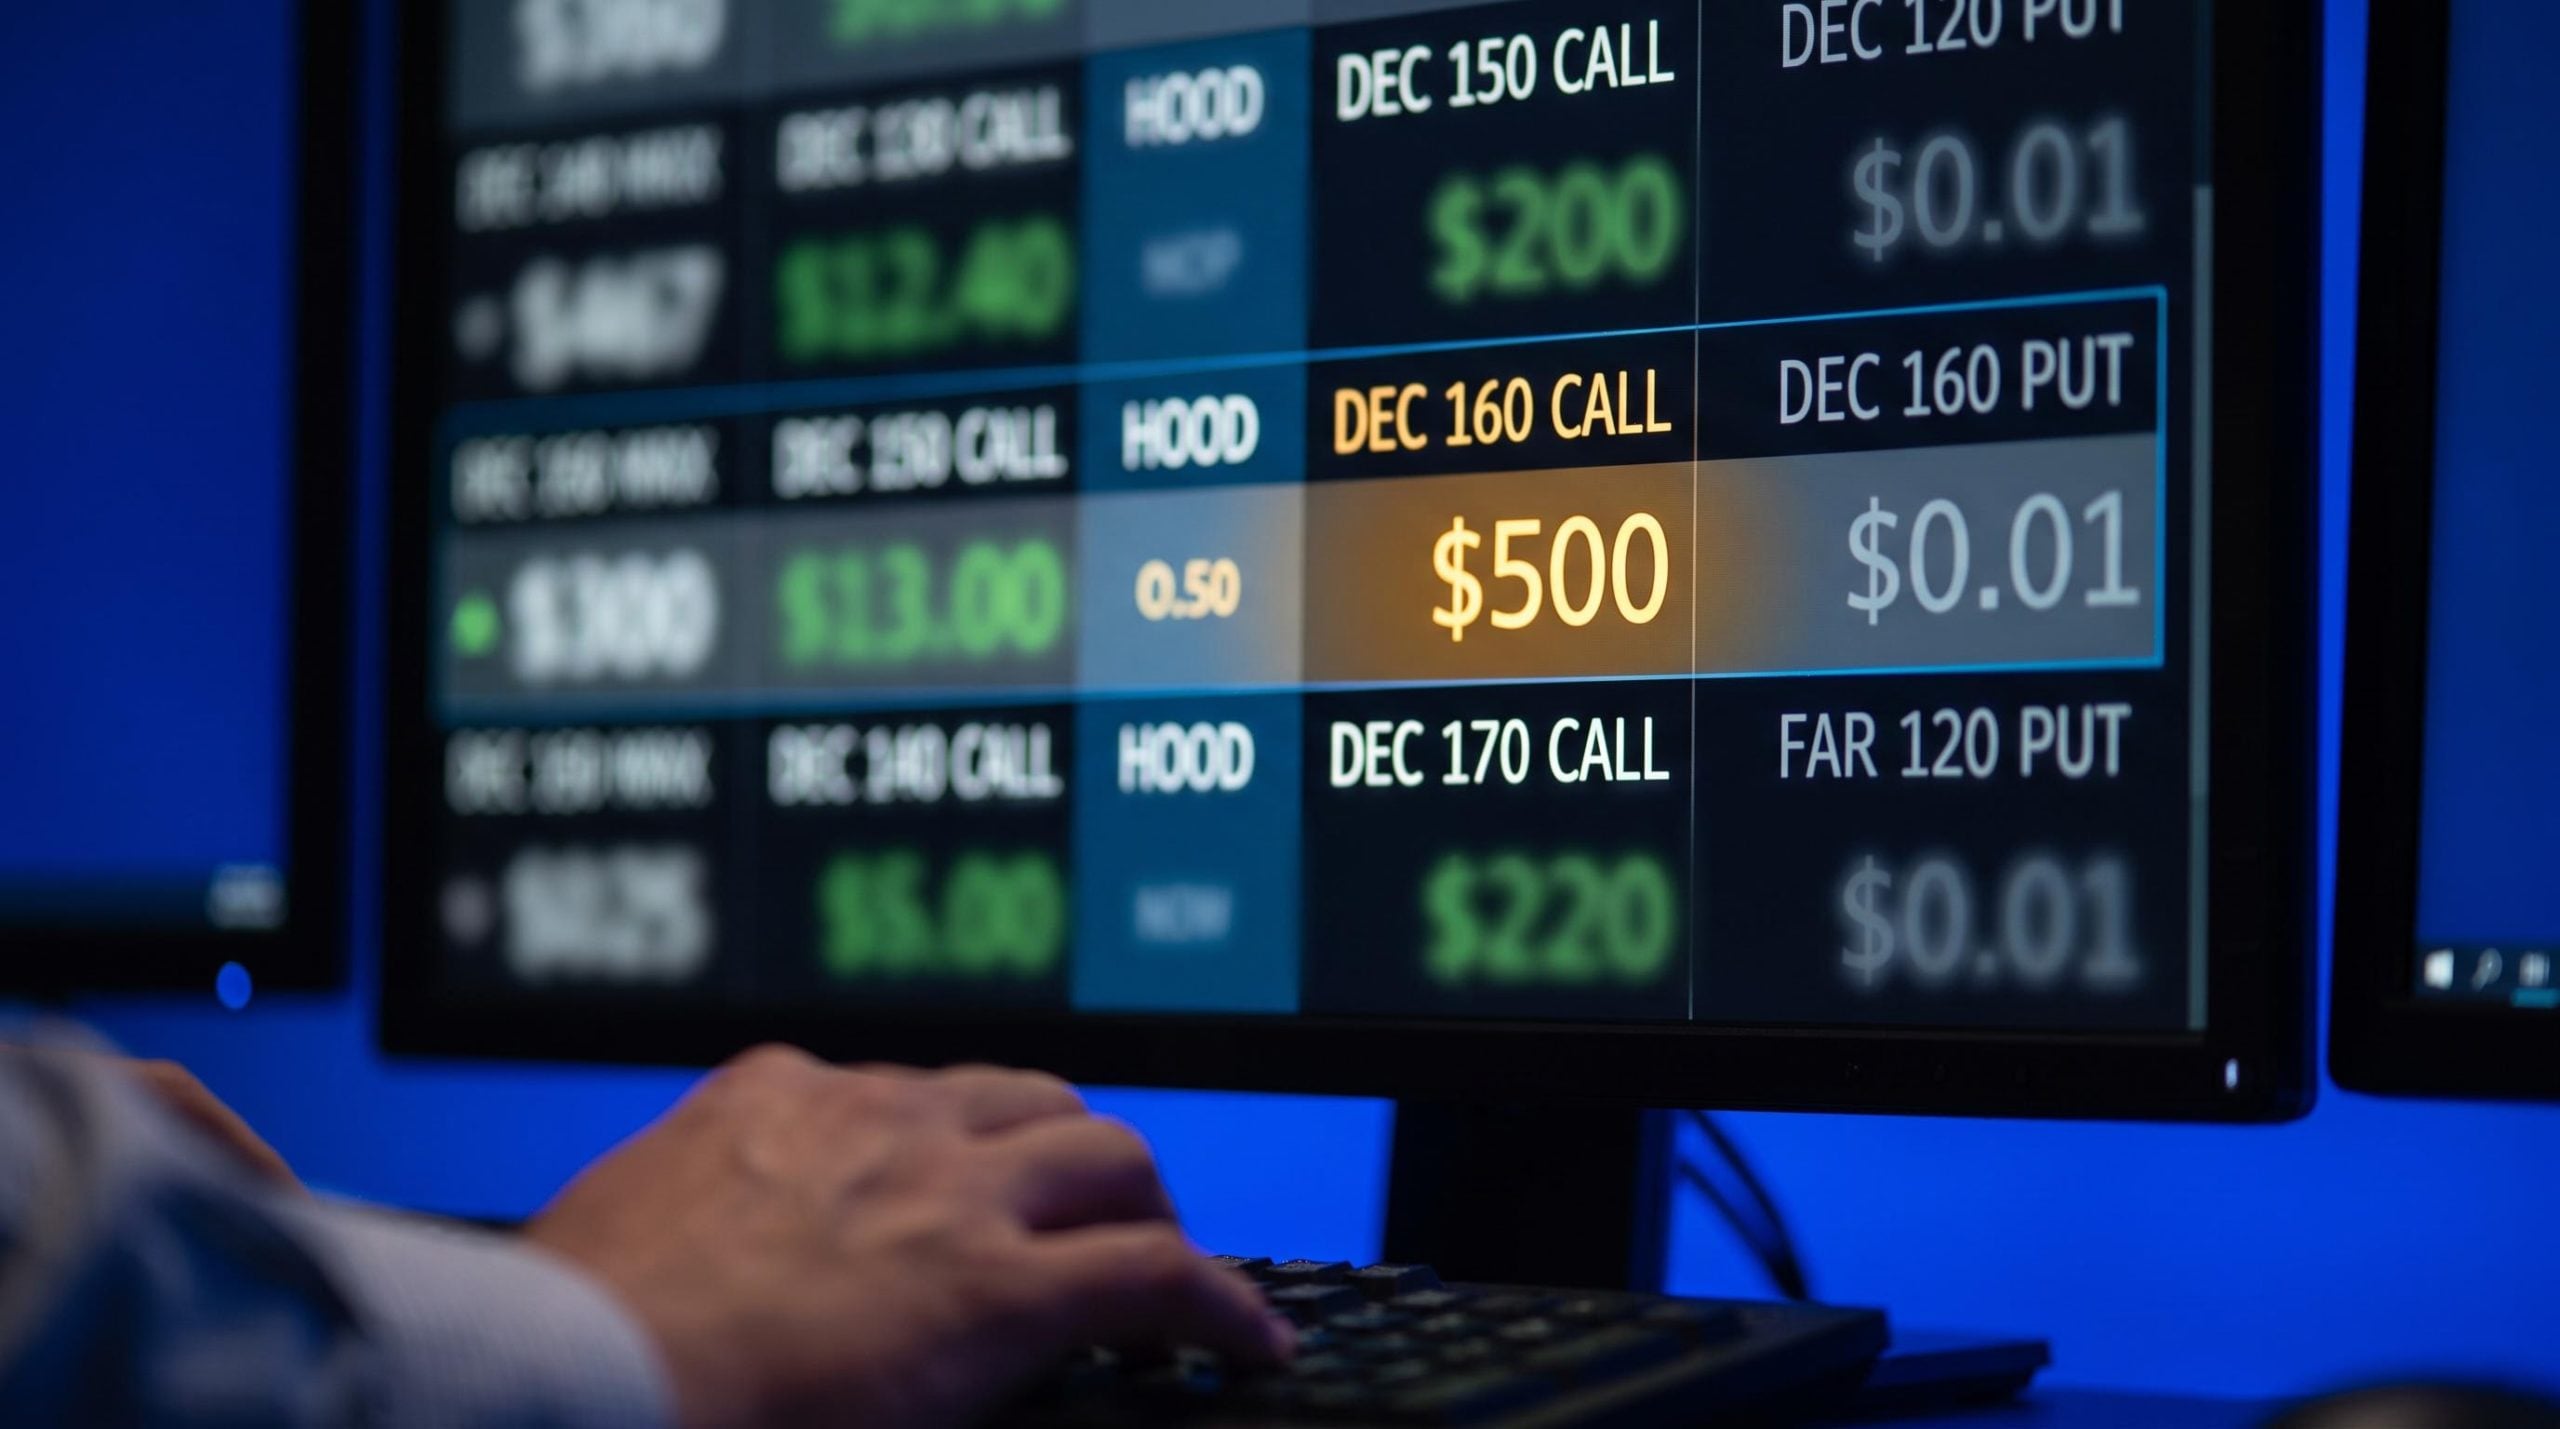
You see a call option on Robinhood Markets (HOOD) priced at roughly $500. It is $55 out of the money. You do not know whether that is expensive, cheap, or irrelevant. And the honest answer is that none of those labels mean anything until you know what the rest of the options chain is telling you about where the crowd thinks this stock is heading.
That is the difference between looking at an option price and reading options market sentiment. The price is a number. The sentiment is the story the entire chain is encoding about direction, magnitude, and uncertainty. The snapshot used throughout this piece was taken on the Tasty trading platform with HOOD trading near $107, and it serves as a live specimen for how professional traders extract a view before placing a trade.
Here is how to read what the HOOD chain is actually telling you, and how to apply the same lens to any stock you are following.
Why options prices are a sentiment tool, not just a cost
Your first instinct is probably to treat an option’s price the way you would treat any other asset: it costs what it costs because of supply and demand. That is not wrong, but it skips the more useful layer.
Options are priced using a model that solves for something called implied volatility (IV). IV is the volatility number that makes today’s option price mathematically fair within that model. In practical terms, it is the market’s collective estimate of how much a stock’s price will move going forward, expressed as an annualised percentage.
Options are priced using a model that solves for something called implied volatility (IV), extracted by reverse-engineering the Black-Scholes pricing model from live market prices rather than from historical data, making it a real-time measure of what the collective market expects about future price movement magnitude.
Three properties make IV useful as a sentiment reading tool:
- It is forward-looking: it reflects what the market expects to happen, not what has already occurred
- It is priced into the model: every option on the chain has IV embedded in its premium, which means you can extract the market’s uncertainty estimate from any strike and expiration
- It is directionally consequential: high IV produces wider expected price ranges and more expensive options, while low IV produces narrower ranges and cheaper options
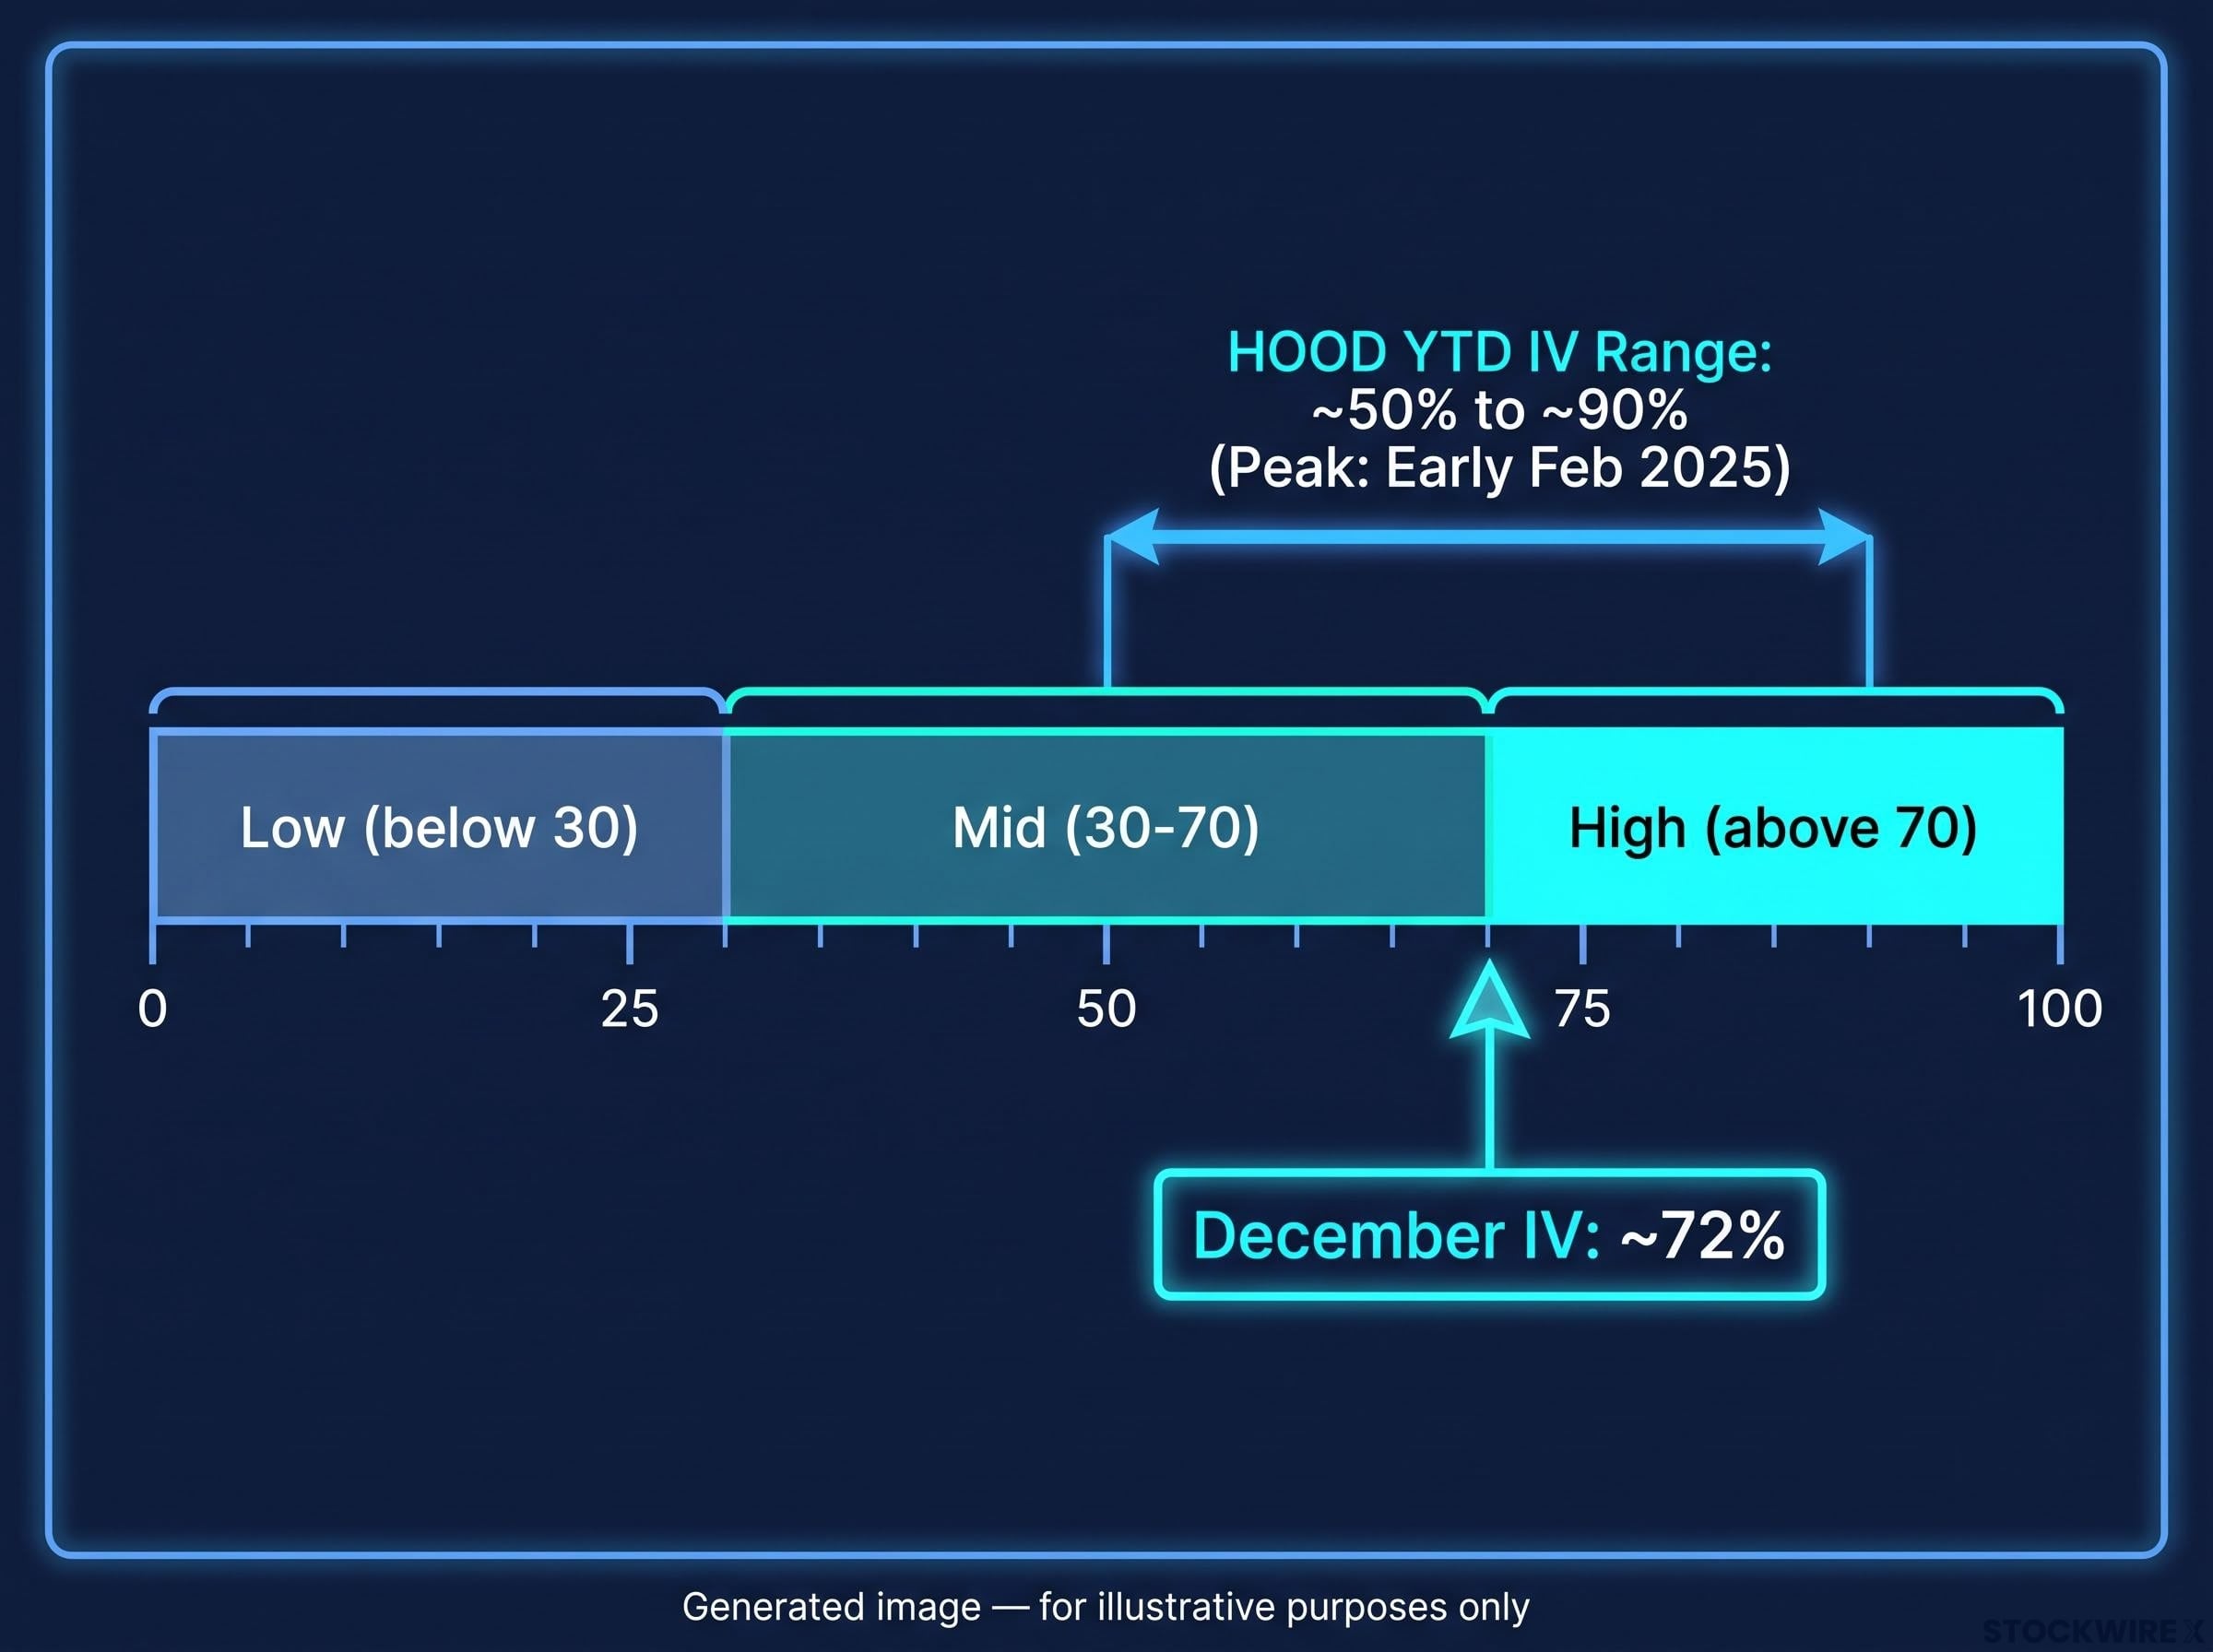
The December cycle for HOOD showed an IV reading of approximately 72%. To put that in context, the stock’s IV over the year-to-date period spanned a low of around 50% and a high of around 90%, with that 90% extreme reached in early February 2025 as the broader market sold off sharply. At 72%, HOOD sits close to the centre of that annual range.
That midpoint positioning matters. HOOD options are neither a bargain nor at panic-level pricing, which means the directional signals elsewhere in the chain carry more analytical weight than the volatility level alone. The IV number tells you the market expects meaningful movement. The question is which direction, and by how much.
When big ASX news breaks, our subscribers know first
What IV rank tells you that raw IV cannot
A 72% implied volatility sounds high. But high compared to what? If HOOD routinely trades at 80-90% IV, then 72% is actually subdued for this stock. If it normally sits at 40%, it is elevated. The raw number, on its own, cannot answer the question.
IV rank resolves this. It is a 0-100 scale that positions today’s IV against the stock’s own historical range over the past year. An IV rank of 90 means today’s IV is near the top of where it has been. An IV rank of 10 means it is near the bottom. HOOD’s IV rank at the time of the snapshot sat near the midpoint of its year-to-date range, confirming options were neither unusually cheap nor unusually expensive by the stock’s own standards.
| IV Rank Zone | Interpretation | Strategy Implication |
|---|---|---|
| High (above 70) | Options are expensive relative to this stock’s own history | Favours selling premium (credit spreads, short strangles) |
| Mid (30-70) | No clear volatility edge for buyers or sellers | Directional signals (skew, expected move) carry more weight |
| Low (below 30) | Options are cheap relative to this stock’s own history | Favours buying premium (long calls, long puts, debit spreads) |
Applying IV rank to HOOD’s current setup
For you, if you are holding or considering a HOOD position, the mid-range IV rank means the options market is not sending a clear “buy premium” or “sell premium” signal. Neither side has a pure volatility edge. That shifts the strategic weight toward the directional signals embedded in skew and expected-move data, which is where the chain starts speaking more clearly.
Call skew and what a 2:1 premium ratio reveals about directional bets
In a perfectly neutral market, a call and a put positioned the same distance from the stock price should cost roughly the same amount. The market is not assigning greater probability to a move in either direction, so the premiums balance.
HOOD’s chain does not look anything like that.
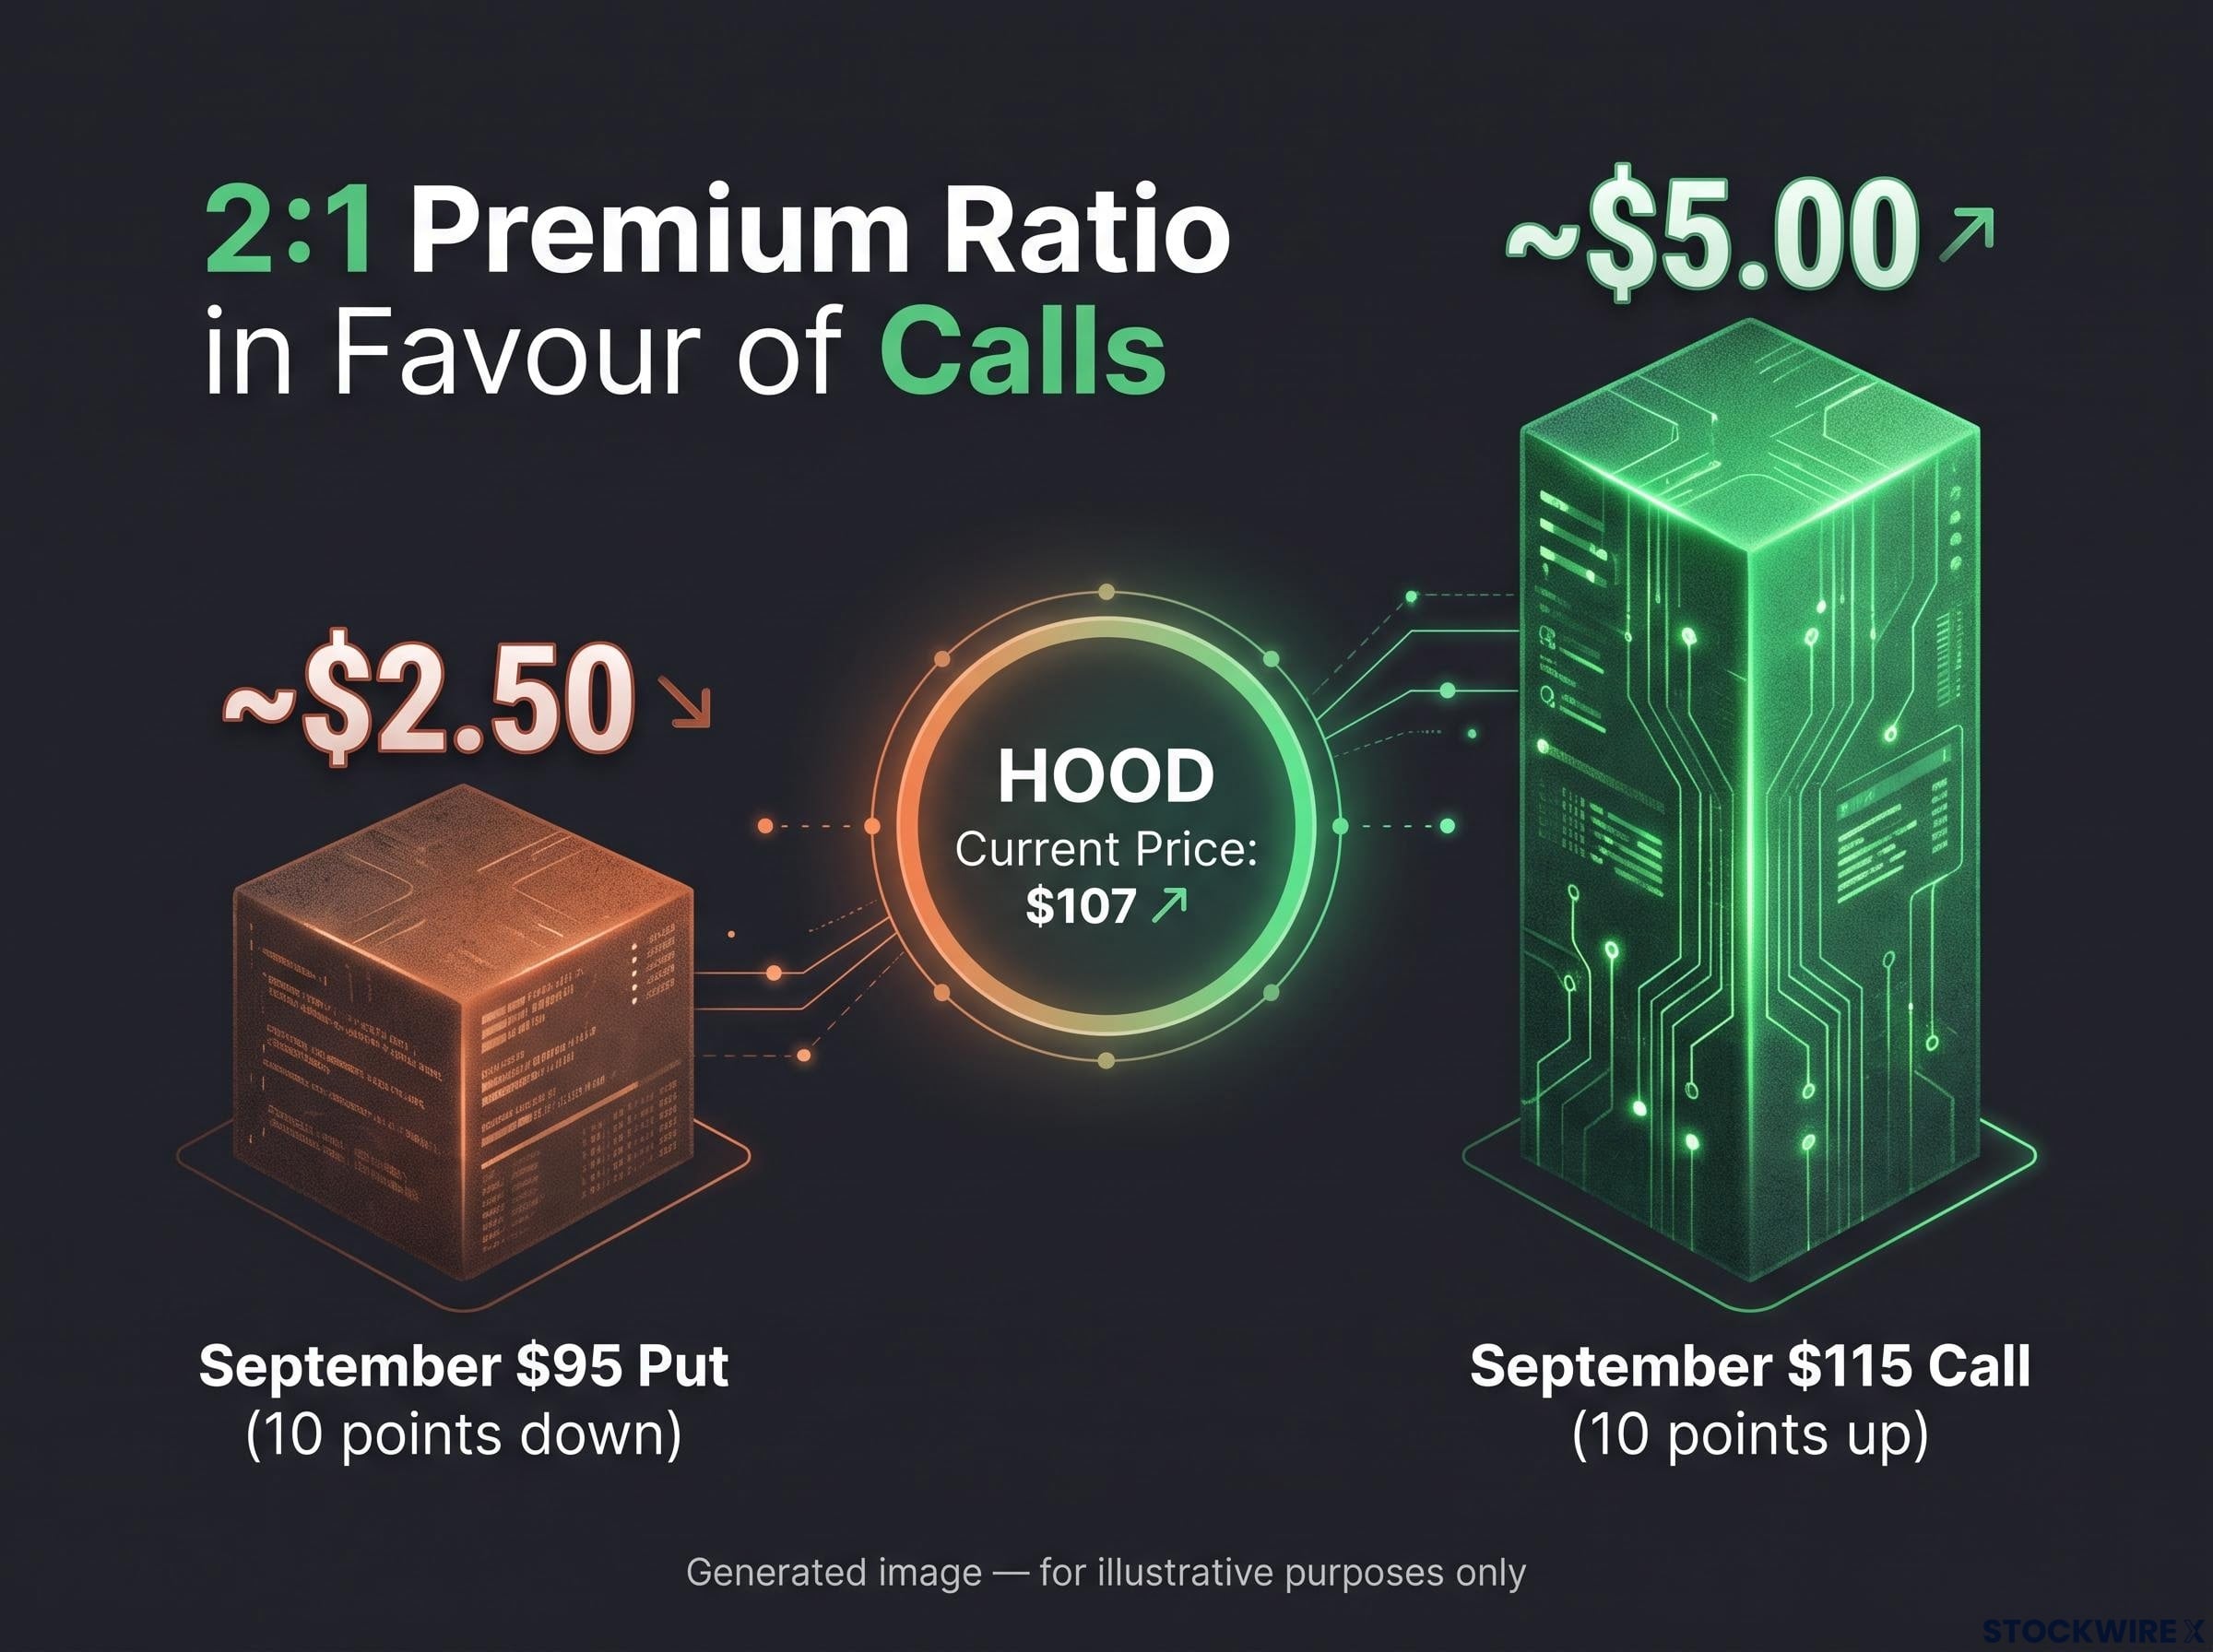
Looking at the September cycle with HOOD at $107, the $115 call sitting 10 points above the current price carried a premium of around $5.00, while the $95 put sitting an equal 10 points below was priced at roughly $2.50. The result is a 2:1 premium ratio in favour of calls.
When calls cost twice as much as puts
The 2:1 ratio tells you the options market is pricing upside “risk” as approximately twice as relevant as downside risk. That is a strong directional lean, not a subtle one.
Two skew regimes help you categorise what you are seeing in any options chain:
Options skew as a sentiment signal extends well beyond individual equities: broad index chains such as the S&P 500 show the opposite configuration to HOOD, with puts consistently richer than calls because institutional hedgers pay above the norm for downside protection, a structural premium that has widened materially heading into the September-November window.
- Put-skew (puts richer than calls): the most common configuration for broad indices like the S&P 500, driven by institutional demand for downside protection
- Call-skew (calls richer than puts): the HOOD configuration, driven by demand for upside exposure and the crowd’s willingness to pay for rally participation
The December chain amplified the signal further. At the $160 strike, approximately $55 out of the money, contracts were changing hands at close to $500 apiece, while puts positioned an equivalent distance below the stock price carried almost no value.
What this means for you: any trade you place that aligns with the bullish sentiment has the market’s implied wind at its back. Any trade positioned against it is fighting the prevailing directional lean. Neither is inherently right or wrong, but you should know which one you are choosing before you enter.
Mapping where the stock is expected to land: the one-standard-deviation range
The options chain answers one of the most practical questions you can ask before placing a trade: how far could this stock realistically move before my position expires?
The answer lives in the 16-delta options. Delta serves as an approximation of probability rather than a precise statistical measure, but the roughly 16-delta call and put at a given expiry bracket what is known as the one-standard-deviation expected move, the range within which the stock has approximately a 68% probability of finishing by expiration.
Using delta as a probability proxy is a practical shortcut rather than a precise statistical claim: the 16-delta options that bracket the one-standard-deviation range carry roughly a 16% probability of expiring in the money, which is why locating them gives you a rapid read on where the market expects the stock to land.
| Cycle | Lower Bound | Upper Bound | Implied Move Magnitude |
|---|---|---|---|
| September (~30 days) | ~$90 | ~$125 | ~±17% in one month |
| December (~year-end) | Not specified | ~$160 | ~50%+ rally implied as non-trivial |
A plus or minus 17% monthly range is significantly wider than what you would see on a blue-chip name. HOOD is priced as a high-variance, event-sensitive stock, and the options market is making that assessment loudly.
The December upper boundary is where the signal gets most interesting. A $160 upper bound means the market is assigning real probability to a 50%-plus rally from $107. That $500 December $160 call is not priced as a lottery ticket; it is priced as a speculative position with genuine demand behind it. If you are short calls or short gamma in that cycle, the width of this range is directly relevant to your risk.
To find these boundaries yourself in any options chain, two steps:
- Locate the approximately 16-delta call and put in the cycle you are evaluating
- Read those strike prices as the one-standard-deviation boundary; together they bracket the range the market expects the stock to stay within roughly 68% of the time
A reusable five-step framework for reading any options chain
The HOOD chain has been the specimen. Now you get the dissection kit.
Every concept from the preceding sections feeds into a sequential checklist you can run on any ticker before placing an options trade. Each step builds on the last, and the full picture only emerges when all five are read together.
- Assess IV and IV rank: Check the current implied volatility, then compare it to the stock’s one-year high and low using IV rank. High rank favours selling premium; low rank favours buying it.
- Scan skew: Compare the premiums of equidistant calls and puts. Quantify the gap. A 2:1 ratio is a strong directional signal; a balanced ratio is neutral.
- Map the one-standard-deviation range: Use approximately 16-delta options or your platform’s expected-move display. Ask yourself whether you can tolerate the stock moving that much by expiration.
- Compare near-term versus long-dated IV: If near-term IV exceeds long-dated IV, the market is focused on a specific catalyst. If both are elevated, the market expects persistent uncertainty, not just a one-off event.
- Check far-out-of-the-money options for speculative crowding: Expensive far-out-of-the-money calls or puts indicate where speculative money is concentrated. The asymmetry between the two sides is a directional sentiment signal.
No single signal from this checklist should be read in isolation. The value is in the composite picture.
What the HOOD chain says when all signals are read together
| Signal | HOOD Reading | What It Means |
|---|---|---|
| Long-dated IV | December ~72% | Uncertainty expected to persist, not fade quickly |
| IV rank | Near midpoint of YTD range | Neither cheap nor expensive by HOOD’s own standards |
| Call vs. put premium ratio | 2:1 in favour of calls | Options market leaning bullish |
| September expected range | $90-$125 (~±17%) | High-variance name; wide moves expected near-term |
| December upside boundary | ~$160 | Market sees 50%+ rally as non-trivial probability |
| Far-OTM call vs. put premium | ~$500 call vs. near-zero put | Extreme upside skew; speculative demand concentrated topside |
A reader who runs this checklist on a stock before placing an options trade is working with the same informational inputs professionals use to calibrate directional and volatility risk. That changes the quality of the decision even before the strategy is chosen.
What the HOOD options market is pricing in, and what that demands of the next trade
Three signals dominate the HOOD chain: sustained elevated IV indicating persistent uncertainty, strong call skew indicating a bullish directional lean, and an expected-move range wide enough to challenge underprepared position sizing. Together, they tell a coherent story.
The HOOD options chain is pricing sustained uncertainty with a strong bullish tilt. Speculative demand is concentrated at the upside, with the December $160 call carrying roughly $500 in premium against a comparable far-out-of-the-money downside put that is priced at virtually nothing.
That asymmetry between $500 in upside speculative premium and near-zero downside premium is not background noise. It is the market’s clearest statement about where the crowd has placed its bets. Any trader ignoring it is entering the position blind to the prevailing sentiment.
Two broad strategy categories follow naturally from this combination:
Defined-risk bullish structures such as debit call spreads align with HOOD’s call skew by capping the premium you pay relative to an outright long call, while their mirror image, bull put credit spreads, use time decay as a structural ally by collecting premium and profiting from three separate market outcomes rather than one.
- Defined-risk bullish structures (such as debit call spreads): align with the directional lean revealed by call skew and upside expected-move concentration
- Neutral short-volatility structures (such as iron condors or short strangles): align with mid-to-high IV rank, profiting if IV compresses regardless of direction
Before any trade, the options chain has already answered several of your most important questions about probability, direction, and magnitude. You now have the tools to listen to those answers. The next step is making sure the trade you choose reflects what the chain is telling you, not just what you hope the stock will do.
This article is for informational purposes only and should not be considered financial advice. Investors should conduct their own research and consult with financial professionals before making investment decisions. Past performance does not guarantee future results. Options trading involves risk, and the data presented reflects a specific market snapshot that may no longer reflect current conditions.