Four winning trades in a row feels like proof. You bought the breakout, it worked, and it worked again. The natural conclusion is that you have found something real.
Jeff Holden, who now oversees a desk of about 100 traders, reached that conclusion early in his career. He bought stocks breaking their pre-market highs at the open and won four or five times. He decided he was a scalper, grew overconfident and then lost heavily, because there was no plan behind the streak.
Most traders can quote their win rate. Far fewer can tell you whether they hold a genuine trading edge, and that gap is expensive. The Australian Securities and Investments Commission (ASIC) found that 68% of Australian retail clients trading contracts for difference (CFDs) lost money in FY2023-24. A CFD is a leveraged contract that pays the difference in an asset’s price without you owning the asset, so that figure is specific to one product in one country.
Here is how to define edge precisely, separate skill from luck in your own results, and test a strategy before you trust it with more money.
What does trading edge actually mean?
The intuitive answer is that edge means winning often. It does not. A strategy can win most of the time and still drain your account.
Edge is positive expected value. The number that captures it is expectancy, which is the average profit or loss you can expect per trade. The formula is simple: multiply your win rate by your average win, then subtract your loss rate multiplied by your average loss.
Many traders express results in R, meaning the amount you initially risked on a trade. Both CME Group and the Van Tharp Institute describe expectancy as the average result per trade across many comparable trades.
Now compare two hypothetical strategies.
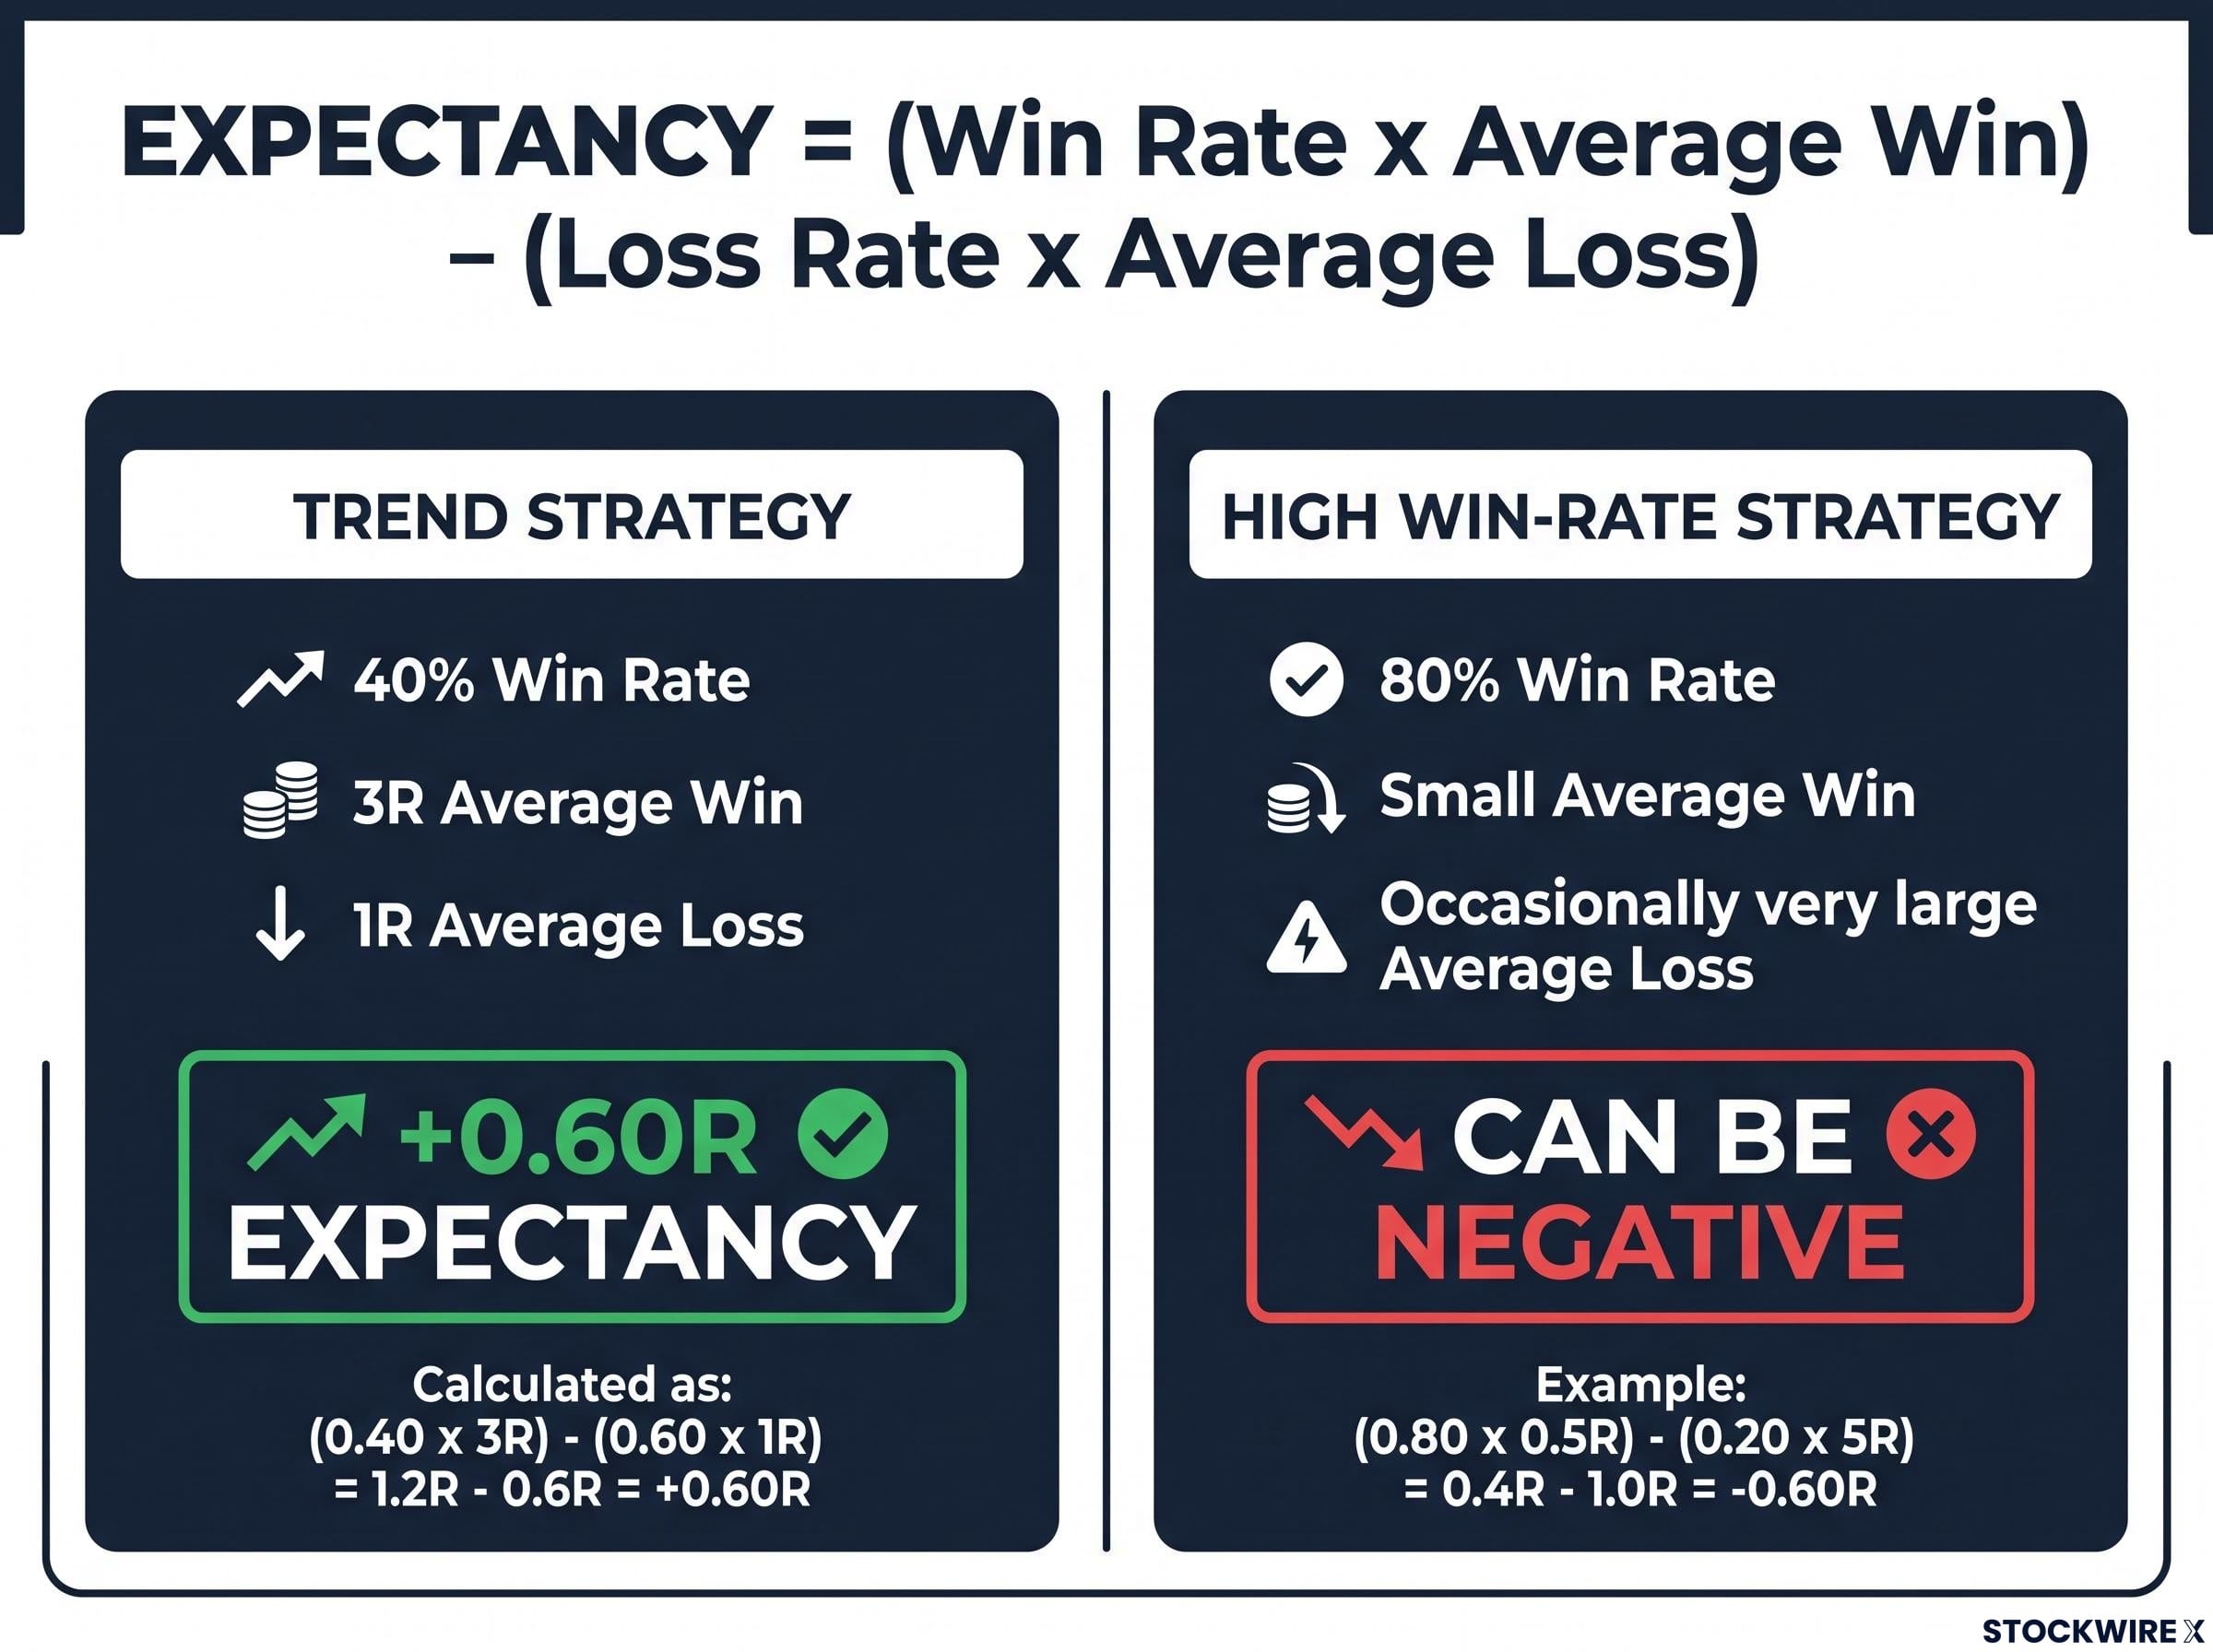
| Strategy | Win rate | Average win | Average loss | Expectancy |
|---|---|---|---|---|
| Trend strategy | 40% | 3R | 1R | +0.60R |
| High win-rate strategy | 80% | Small | Occasionally very large | Can be negative |
The first calculation runs (0.40 x 3R) – (0.60 x 1R) = +0.60R. You lose more often than you win, yet each trade earns you 0.6 of your risk on average. The second strategy feels better day to day, but one large loss can erase dozens of small gains.
So if you only track win rate, you cannot tell whether you have an edge. Calculate expectancy first.
Once you apply the trading expectancy formula to your own results, you will often find that a strategy winning 40% of the time can structurally beat one winning 70% of the time, provided average wins are large enough relative to average losses.
Frequency adds a second dimension. Holden argues that frequent trades with modest positive expectancy and rare trades with large expectancy can both be strong edges. A workable definition pulls these threads together:
Edge, defined A repeatable conditional advantage in a specified market, regime and setup, producing positive net expectancy after costs and risk controls.
Why expectancy is a long-run average, not a promise
Positive expectancy describes what happens over a large series of comparable trades. It says nothing certain about your next trade, which can lose even when the strategy is sound.
Costs matter too. If your records exclude fees and slippage, subtract the average transaction cost from the result. Expectancy measured before costs flatters your strategy, sometimes enough to turn a real loss into an apparent gain.
When big ASX news breaks, our subscribers know first
Why four wins in a row prove almost nothing
Go back to Holden’s opening breakouts. The wins were real. What they proved was much smaller than what he believed.
He later defined true scalping as a short execution window with every variable aligned beforehand. That is different from tape scalping, and different again from calling any fast trade a scalp. His early streak had none of that alignment. It was a false positive.
A process with zero edge can still produce a convincing streak when:
- you take many attempts and only remember or share the winners
- you choose the sample after the fact
- the market happens to suit your approach for a while
- you increase size after early success, magnifying the outcome
- losses are delayed by holding positions or selling options
That last point catches premium sellers. Strategies that collect small, frequent payments by selling options can show 80-90% winning trades and still carry negative expectancy once one or two severe losses arrive.
| Example | What it shows | Lesson |
|---|---|---|
| Premium selling | A high win rate can hide rare, very large losses | Judge the full loss distribution, not the share of winning days |
| Opening momentum | A short favourable run mistaken for a tested playbook | Define the setup, stop and daily loss limit first |
| Retail CFDs | Leverage and friction can overwhelm an attractive signal | Risk control matters as much as entry quality |
ASIC’s data puts numbers on that third row: 133,674 clients, aggregate net losses of about $458 million, including about $73 million in fees. The European Securities and Markets Authority (ESMA) reports that 74-89% of EU retail CFD accounts typically lose money. These are leveraged-product figures and should not be read as a rate for all trading.
The biases that turn luck into conviction
- Survivorship bias: failed traders and closed accounts disappear, so the visible winners look typical.
- Overconfidence: your streak reads as proof of personal skill.
- Gambler’s fallacy: after several wins, you believe a loss is “due”, or the reverse.
- Recency bias: you assume the conditions behind your streak will continue.
- Hindsight bias: the setup looks obvious once the move has happened.
An early winning streak should prompt measurement and controlled sizing, not bigger positions. Confidence built on five trades is the real risk.
Behavioural biases such as overconfidence, herding and the disposition effect appear across regulator data on retail accounts, which helps explain why a short winning streak so often leads to larger positions and heavier losses.
How a playbook separates edge from luck, and why edge can change after entry
“Opening momentum usually works” sounds like a strategy. It is closer to a hunch, because nothing in it can be tested or proven wrong.
Building the playbook
A playbook turns that hunch into a hypothesis. For the opening-momentum example, you would write down, in order:
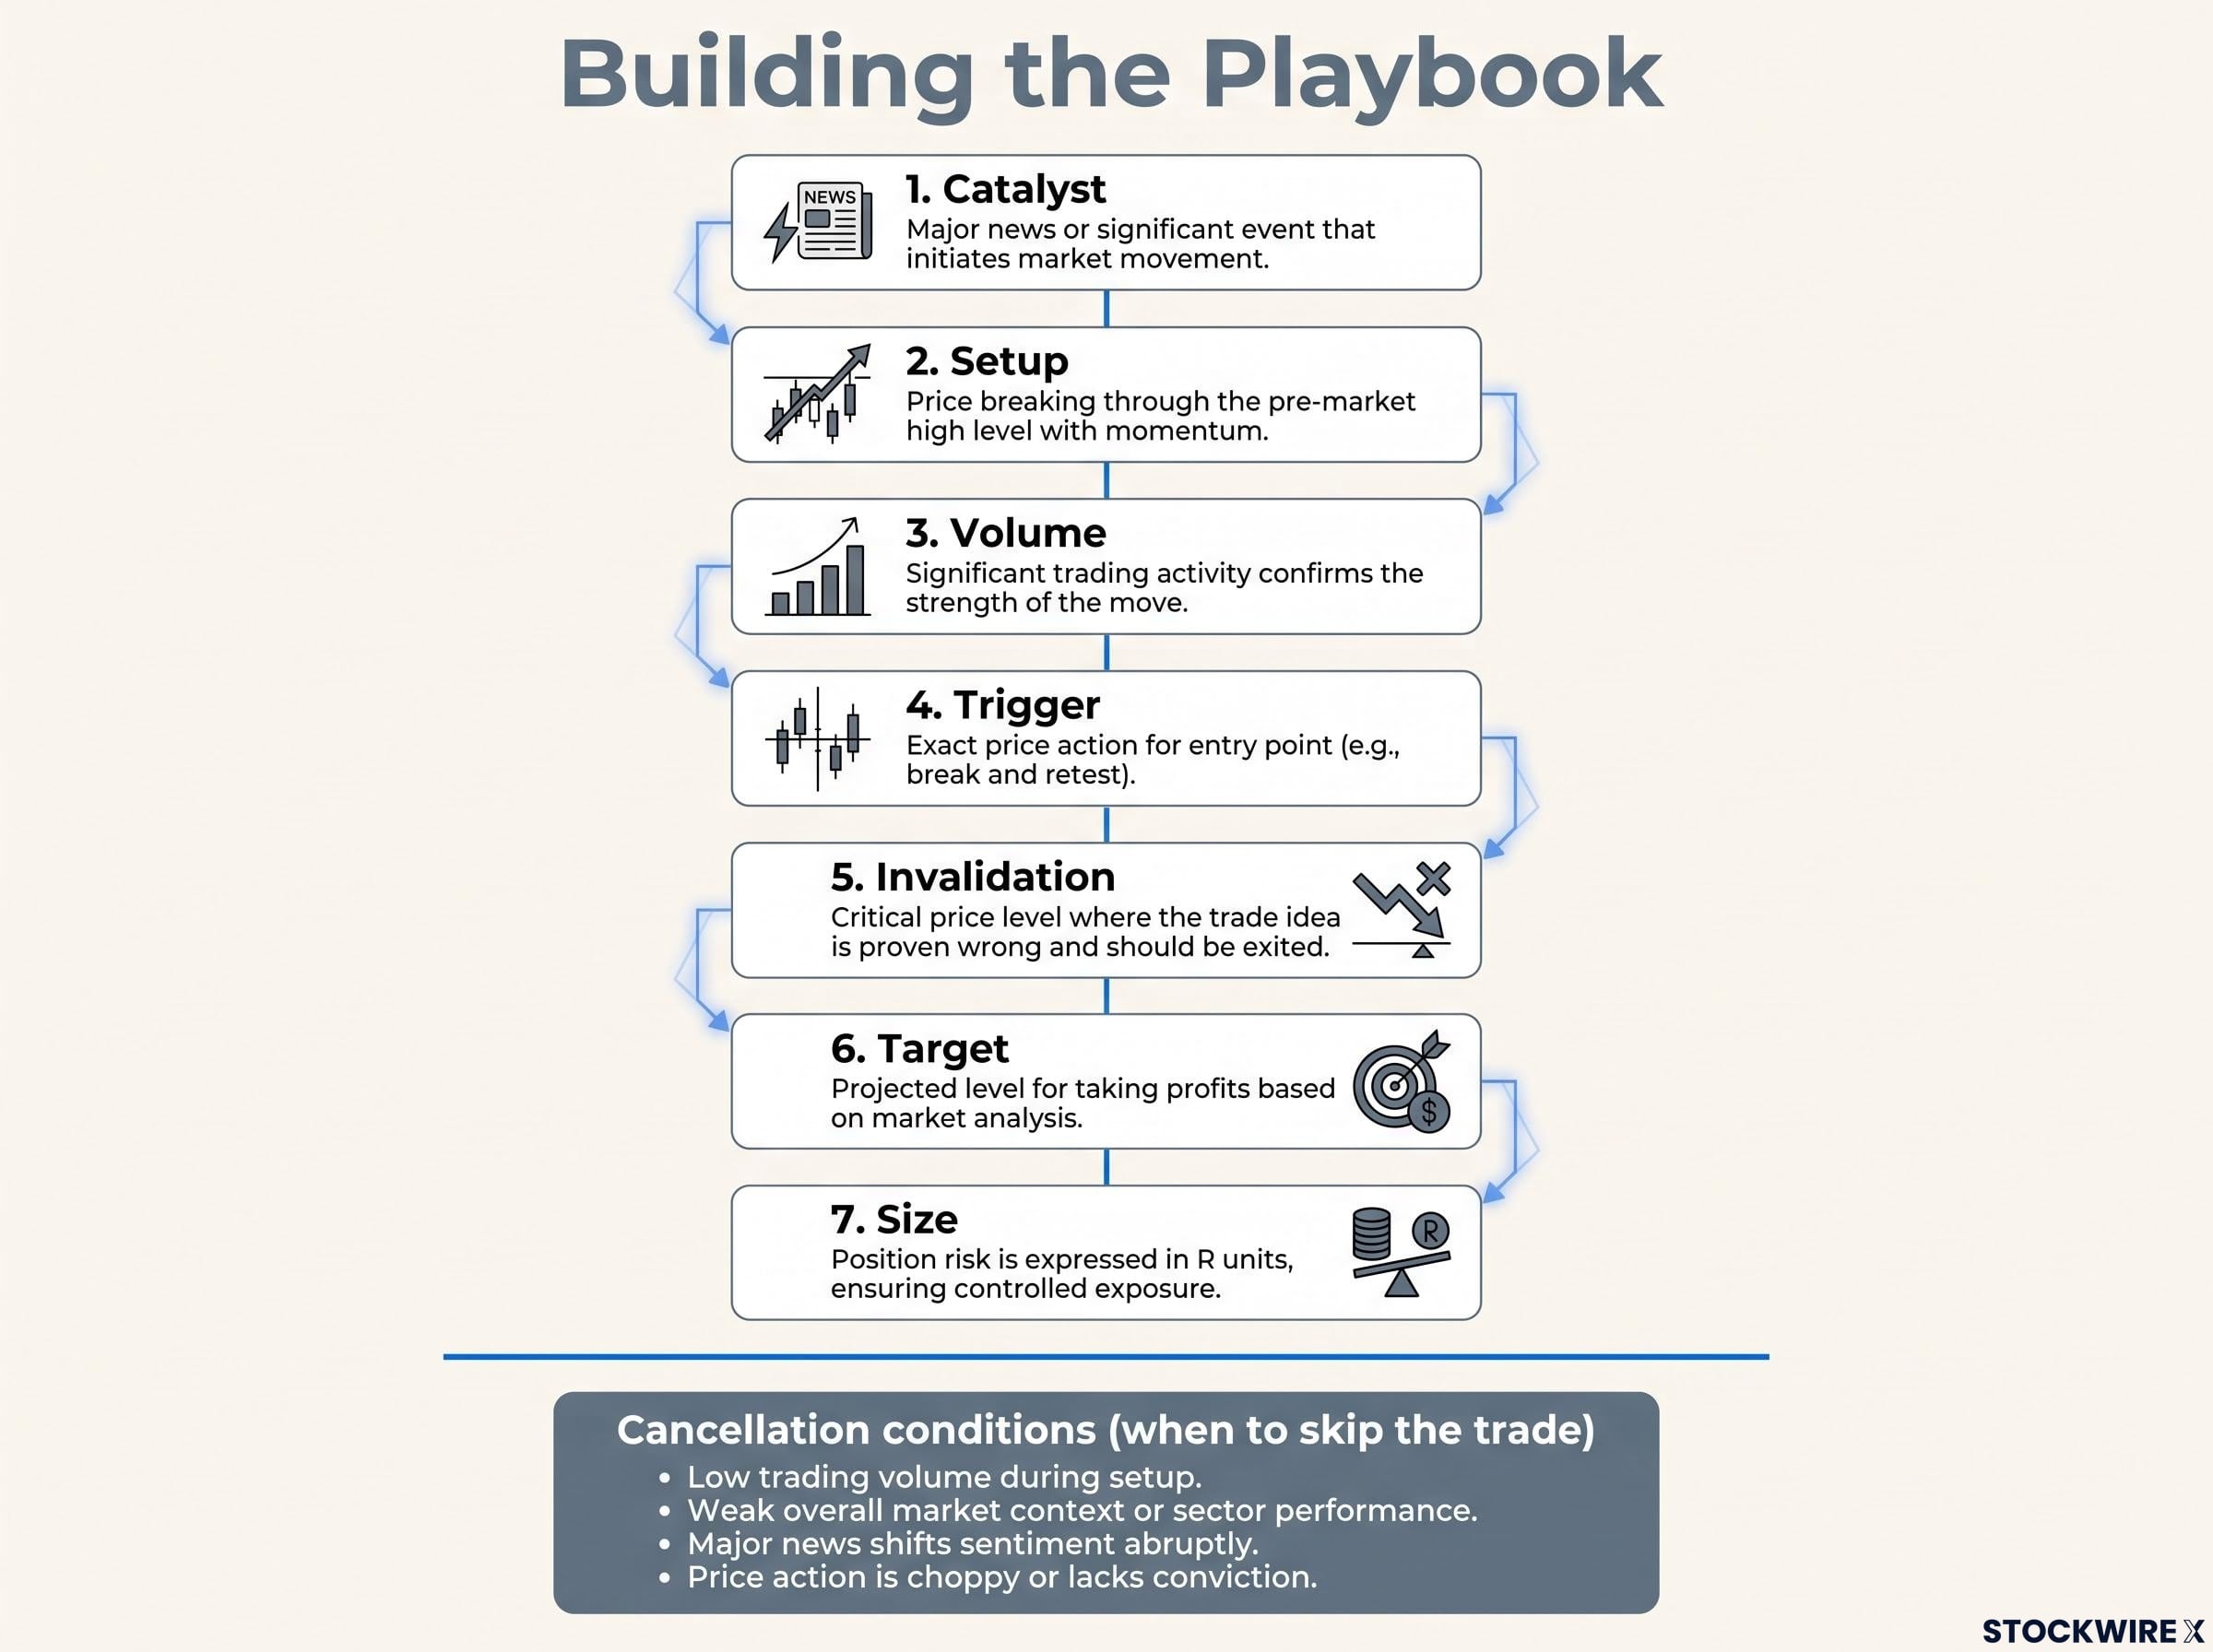
- Catalyst: the news or event giving the stock a reason to move
- Setup: price breaking the pre-market high at the open
- Volume: the trading activity required to confirm the break
- Trigger: the exact price action that gets you in
- Invalidation: the level that proves the idea wrong
- Target: where you expect to take profit
- Size: how much you risk, expressed in R
Add cancellation conditions as well, meaning the circumstances in which you skip the trade entirely. Holden observes that traders without a playbook miss the best setups and take lesser ones instead.
When edge fades after entry or over time
A valid setup at entry can switch off minutes later. Watch for:
- the catalyst failing to draw follow-through
- volume falling below what the setup needs
- price slipping back inside the pre-breakout range
- spreads widening as liquidity thins
- volatility shifting enough to make your stop or target inappropriate
- a larger participant absorbing the order flow you expected
Holden on edge Holden argues that few people talk about how dynamic edge is. Even premium sellers with high win rates, he says, must watch for moments when their edge is absent or has changed.
Over months, edge can also decay through regime shifts, crowding, volatility changes and changes in market microstructure (how orders are matched and filled). Track rolling expectancy by setup and regime, monitor clusters of losses and log your slippage.
One or two losses are normal variance. Sustained deterioration in the conditions that created your edge is evidence it has changed. Brett Steenbarger, writing for Interactive Brokers in June 2026, recommends switching a system off once its assumptions no longer hold.
Your edge is only as good as the conditions it requires. Write those conditions down, along with the signals that tell you the edge has left.
How to test your own trading edge
Testing does not need special software. It needs honest records and patience.
Document every trade, express results in R, calculate net expectancy, segment by setup and regime, then test on data you have not used. Your journal should capture at least:
- instrument, date and time
- catalyst and market regime
- setup name and volume conditions
- entry trigger, stop and target
- position size in R
- expected costs and actual slippage
- whether you followed the rules
- outcome in R and your emotional state
How many trades is enough?
No universal number exists. The answer depends on how large your edge is, how variable your results are, how many strategies you have tried and whether your trades are independent of one another. A practical hierarchy looks like this:
- Treat about 50 trades as a rough minimum for a preliminary, unstable estimate (GT-Score research proposes this as a default, not a statistical law).
- Collect more when the edge is small or losses are fat-tailed, meaning extreme losses occur more often than a normal distribution suggests.
- Separate development, validation and untouched out-of-sample data.
- Record every variation you test.
- Adjust for multiple testing and check survival across regimes, costs and small rule changes.
Marcos López de Prado and co-authors warn that the best of many backtests is often just a selected winner. The CFA Institute adds that a t-statistic of about 2.0, a common bar for statistical significance, is too permissive when many variants are tested.
Reviewing and segmenting your results
Split results by setup, regime, time of day and rule compliance. Track drawdown, losing streaks, and what happens when you remove your best and worst trades.
| Check | What it tests | Warning sign |
|---|---|---|
| Net expectancy | Profit after realistic costs | Positive only before fees |
| Rule perturbation | Sensitivity to small changes | Performance collapses (Steenbarger’s curve-fit signal) |
| Walk-forward by regime | Survival in new conditions | Works in one regime only |
Avoid changing several rules at once, mixing paper and live trades, journaling selectively or sizing up after a streak. Holden suggests developing traders aim for roughly $100-200 a day before thinking about scaling.
A strategy that survives realistic costs, modest rule changes and different regimes is as close to proof as you will get. Treat anything less as a hypothesis.
For readers weighing when to scale up, our deep-dive into prop desk culture explains why firms spend four of a trader’s first six months on habits before size.
Past performance does not guarantee future results. Any expectancy estimate is subject to changing market conditions and various risk factors.
What a real edge asks of you before it pays you
Edge is positive net expectancy, it lives inside a specific playbook, and it has to be tested and retested because conditions change. Holden’s breakout streak lacked all three pieces: no defined playbook, no measurement and no sizing discipline.
Choose one strategy you trade now. Write its playbook, then log every trade in R before you change your size. The regulator figures on retail losses come from leveraged products in specific jurisdictions, so treat them as a caution rather than a universal rate, but take the warning seriously.
This article is for informational purposes only and should not be considered financial advice. Investors should conduct their own research and consult with financial professionals before making investment decisions.