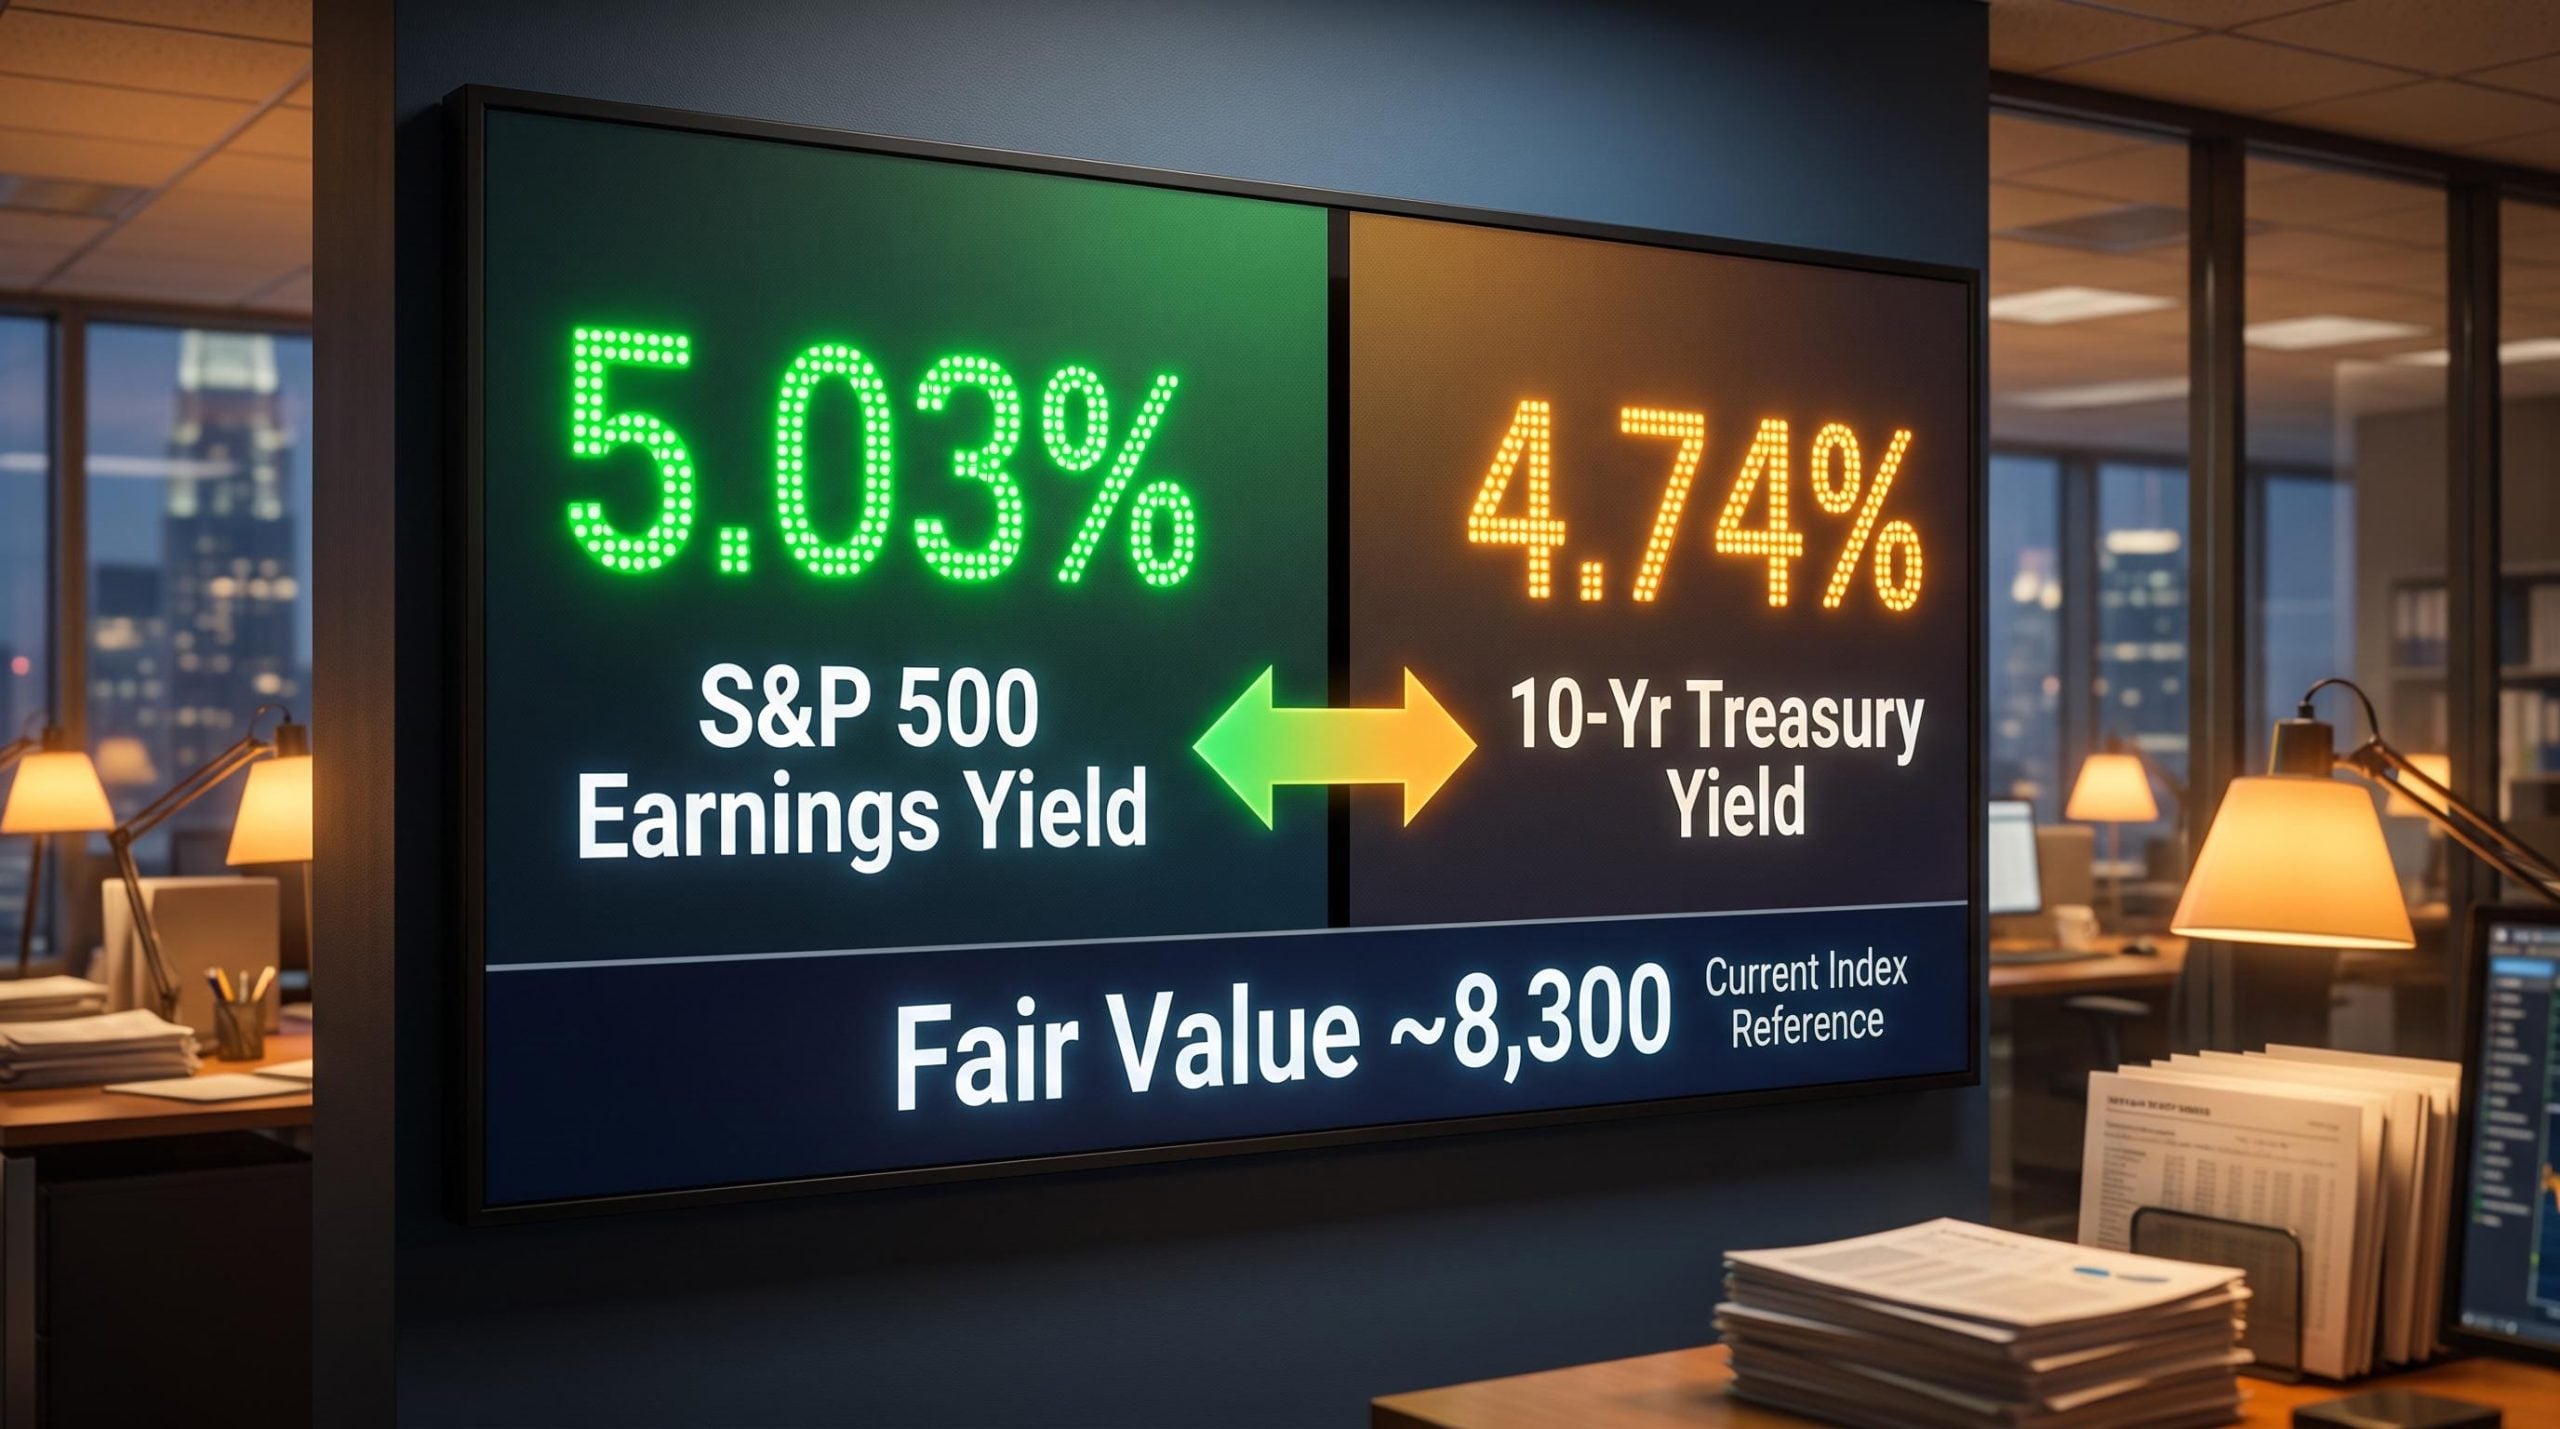
The S&P 500 is trading at roughly 7,674. A valuation framework that institutional strategists have relied on for decades puts fair value at approximately 8,300. That is an 8% gap, and it exists because of a single comparison most self-directed investors have never run themselves.
Yardeni Research argues that the Fed Model has quietly moved back into useful territory in mid-2026, precisely because the bond market distortions that broke its signal have unwound. Treasury yields are no longer being held down by central bank asset purchases; they are trading where genuine economic conditions, inflation expectations, and fiscal dynamics place them. When the inputs reflect reality, the framework that depends on them starts working again.
Here is what this piece gives you: the arithmetic to run the calculation yourself using live data, a clear read on what the current signal says about the S&P 500’s relative value versus bonds, and the exact yield level that would flip the model’s signal from constructive to cautionary. That threshold is closer than you might expect.
What the Fed Model actually does (and where it came from)
The Fed Model is built around a two-way comparison between equity and bond returns. On the equity side, it takes the S&P 500’s forward earnings yield, which you derive by inverting the forward price-to-earnings (P/E) ratio: a forward P/E of 20 times becomes an earnings yield of 5%. On the bond side, it uses the 10-year U.S. Treasury yield, the return available from the risk-free government benchmark.
The model then asks one question: which number is bigger?
- Earnings yield above Treasury yield: equities are signalling relative attractiveness compared to bonds
- Treasury yield above earnings yield: the signal reverses, and bonds look relatively more appealing
The Fed Model is a direct comparison between what stocks are earning relative to their price and what a risk-free government bond pays you. When stocks earn more, they look cheap. When bonds pay more, stocks look expensive.
That is the entire framework. No regression analysis, no Monte Carlo simulation. A ratio you could calculate on the back of an envelope.
The model built its credibility through the 1980s and 1990s, when its signal tracked market outcomes reliably. After 2000, however, the model’s usefulness eroded significantly. Ultra-low interest rate policy held Treasury yields artificially depressed, causing the model to read equities as cheap on a near-permanent basis. While that directional call proved broadly correct over very long horizons, the model lost its value as a risk signal and failed to warn investors ahead of the global financial crisis bear market.
Yardeni Research argues the model’s practical utility is being restored now that yields have normalised. If that argument is correct, the framework you just learned is not a museum piece. It is a live signal.
When big ASX news breaks, our subscribers know first
Running the numbers right now
Start with the two inputs. The S&P 500’s forward P/E sat at approximately 19.9 times in mid-August 2026, within an observed range of 19.6-20.1 times. Inverting that gives you an earnings yield of approximately 5.03% (1 divided by 19.9).
The 10-year U.S. Treasury yield closed at 4.69% on 20 August according to FRED data, with the 21 August session ranging between 4.73% and 4.74%. The original Yardeni Research analysis used approximately 4.68%, a reasonable approximation depending on the exact timestamp.
FRED’s 10-year Treasury yield data, published daily by the Federal Reserve Bank of St. Louis, is the primary source for the DGS10 series referenced throughout this calculation, and you can use it to pull the current yield figure any time you want to rerun the Fed Model arithmetic yourself.
Working through the model’s logic: a Treasury yield of 4.68% implies an equilibrium P/E of roughly 21.4 times (the reciprocal of 0.0468). Since the S&P 500 is currently trading at only 19.9 times forward earnings, the index sits below that implied fair multiple, suggesting the market has not yet priced in the full relative value the model identifies.
| Metric | Value |
|---|---|
| 10-year Treasury yield (FRED, 20 Aug close) | 4.69% |
| S&P 500 forward P/E | ~19.9× |
| S&P 500 earnings yield | ~5.03% |
| Implied fair P/E (Fed Model) | ~21.4× |
| S&P 500 implied fair value (Yardeni Research) | ~8,300 |
| S&P 500 current level | ~7,674 |
Yardeni Research estimates the S&P 500’s Fed Model fair value at approximately 8,300, roughly 8% above the current level of 7,674.
The roughly 8% gap is not a buying recommendation. It is a signal that, on this one relative-value measure, equities are modestly underpriced compared to the yield on a risk-free government bond. The value for you is that you now have every input. When Treasury yields shift or consensus earnings estimates change, you can rerun this calculation yourself.
Why the model stopped working, and why that matters less now
The Fed Model’s strongest stretch ran through the 1980s and 1990s, when Treasury yields reflected genuine economic conditions, inflation expectations, and fiscal dynamics. The comparison between earnings yields and bond yields made intuitive sense because bond yields were set by markets, not suppressed by central bank intervention.
That changed after 2000. The era of zero interest rate policy and quantitative easing artificially held Treasury yields near the floor. The effect on the model was straightforward and damaging:
- Artificially suppressed yields kept the earnings yield permanently above the Treasury yield, causing the model to signal cheap equities regardless of actual equity conditions
- Disconnect from fundamental equity risk: the signal became a reflection of monetary policy, not of relative value between asset classes
- Failure to signal the GFC bear market: the model’s persistent undervaluation reading did not prevent or foresee the global financial crisis equity crash
The broad directional signal, that stocks were cheap relative to bonds, did prove correct over very long periods during the ZIRP era. But as a timing tool or a risk signal, the model was functionally broken.
Why the current environment is different
Yardeni Research argues the model’s practical utility is being restored as Treasury yields return to levels more historically consistent with real economic activity and inflation. The 10-year yield sitting in the 4.7-4.74% range is not a product of quantitative easing. It reflects fiscal dynamics, growth expectations, and inflation pricing by actual market participants.
The premise that the ZIRP era is genuinely behind us rests on yield normalisation rather than a temporary spike: 30-year Treasury yields near 5.1% in mid-2026 are consistent with levels that prevailed in the early-to-mid 2000s, before quantitative easing compressed the baseline that an entire generation of investors came to treat as normal.
For you, the question is not whether yields are higher than during ZIRP. They obviously are. The question is whether the post-quantitative-easing normalisation is durable, because the model’s signal quality is only as good as the stability of the yield environment it operates in. If yields are genuinely market-set rather than policy-suppressed, the Fed Model’s comparison becomes meaningful again. If central banks return to aggressive intervention, the signal breaks again.
The 5% line that changes everything
The current signal is constructive, but there is a specific yield level at which it stops being constructive. That level is 5%.
The arithmetic is clean. At a 10-year Treasury yield of exactly 5%, the implied Fed Model fair P/E equals exactly 20 times (1 divided by 0.05). The S&P 500’s current forward P/E is approximately 19.9 times. At 5%, the gap between what equities earn and what bonds pay effectively vanishes. The relative-value cushion disappears.
With the 10-year yield trading at 4.73-4.74% on 21 August, you are roughly 26-27 basis points from that line. That is not distant.
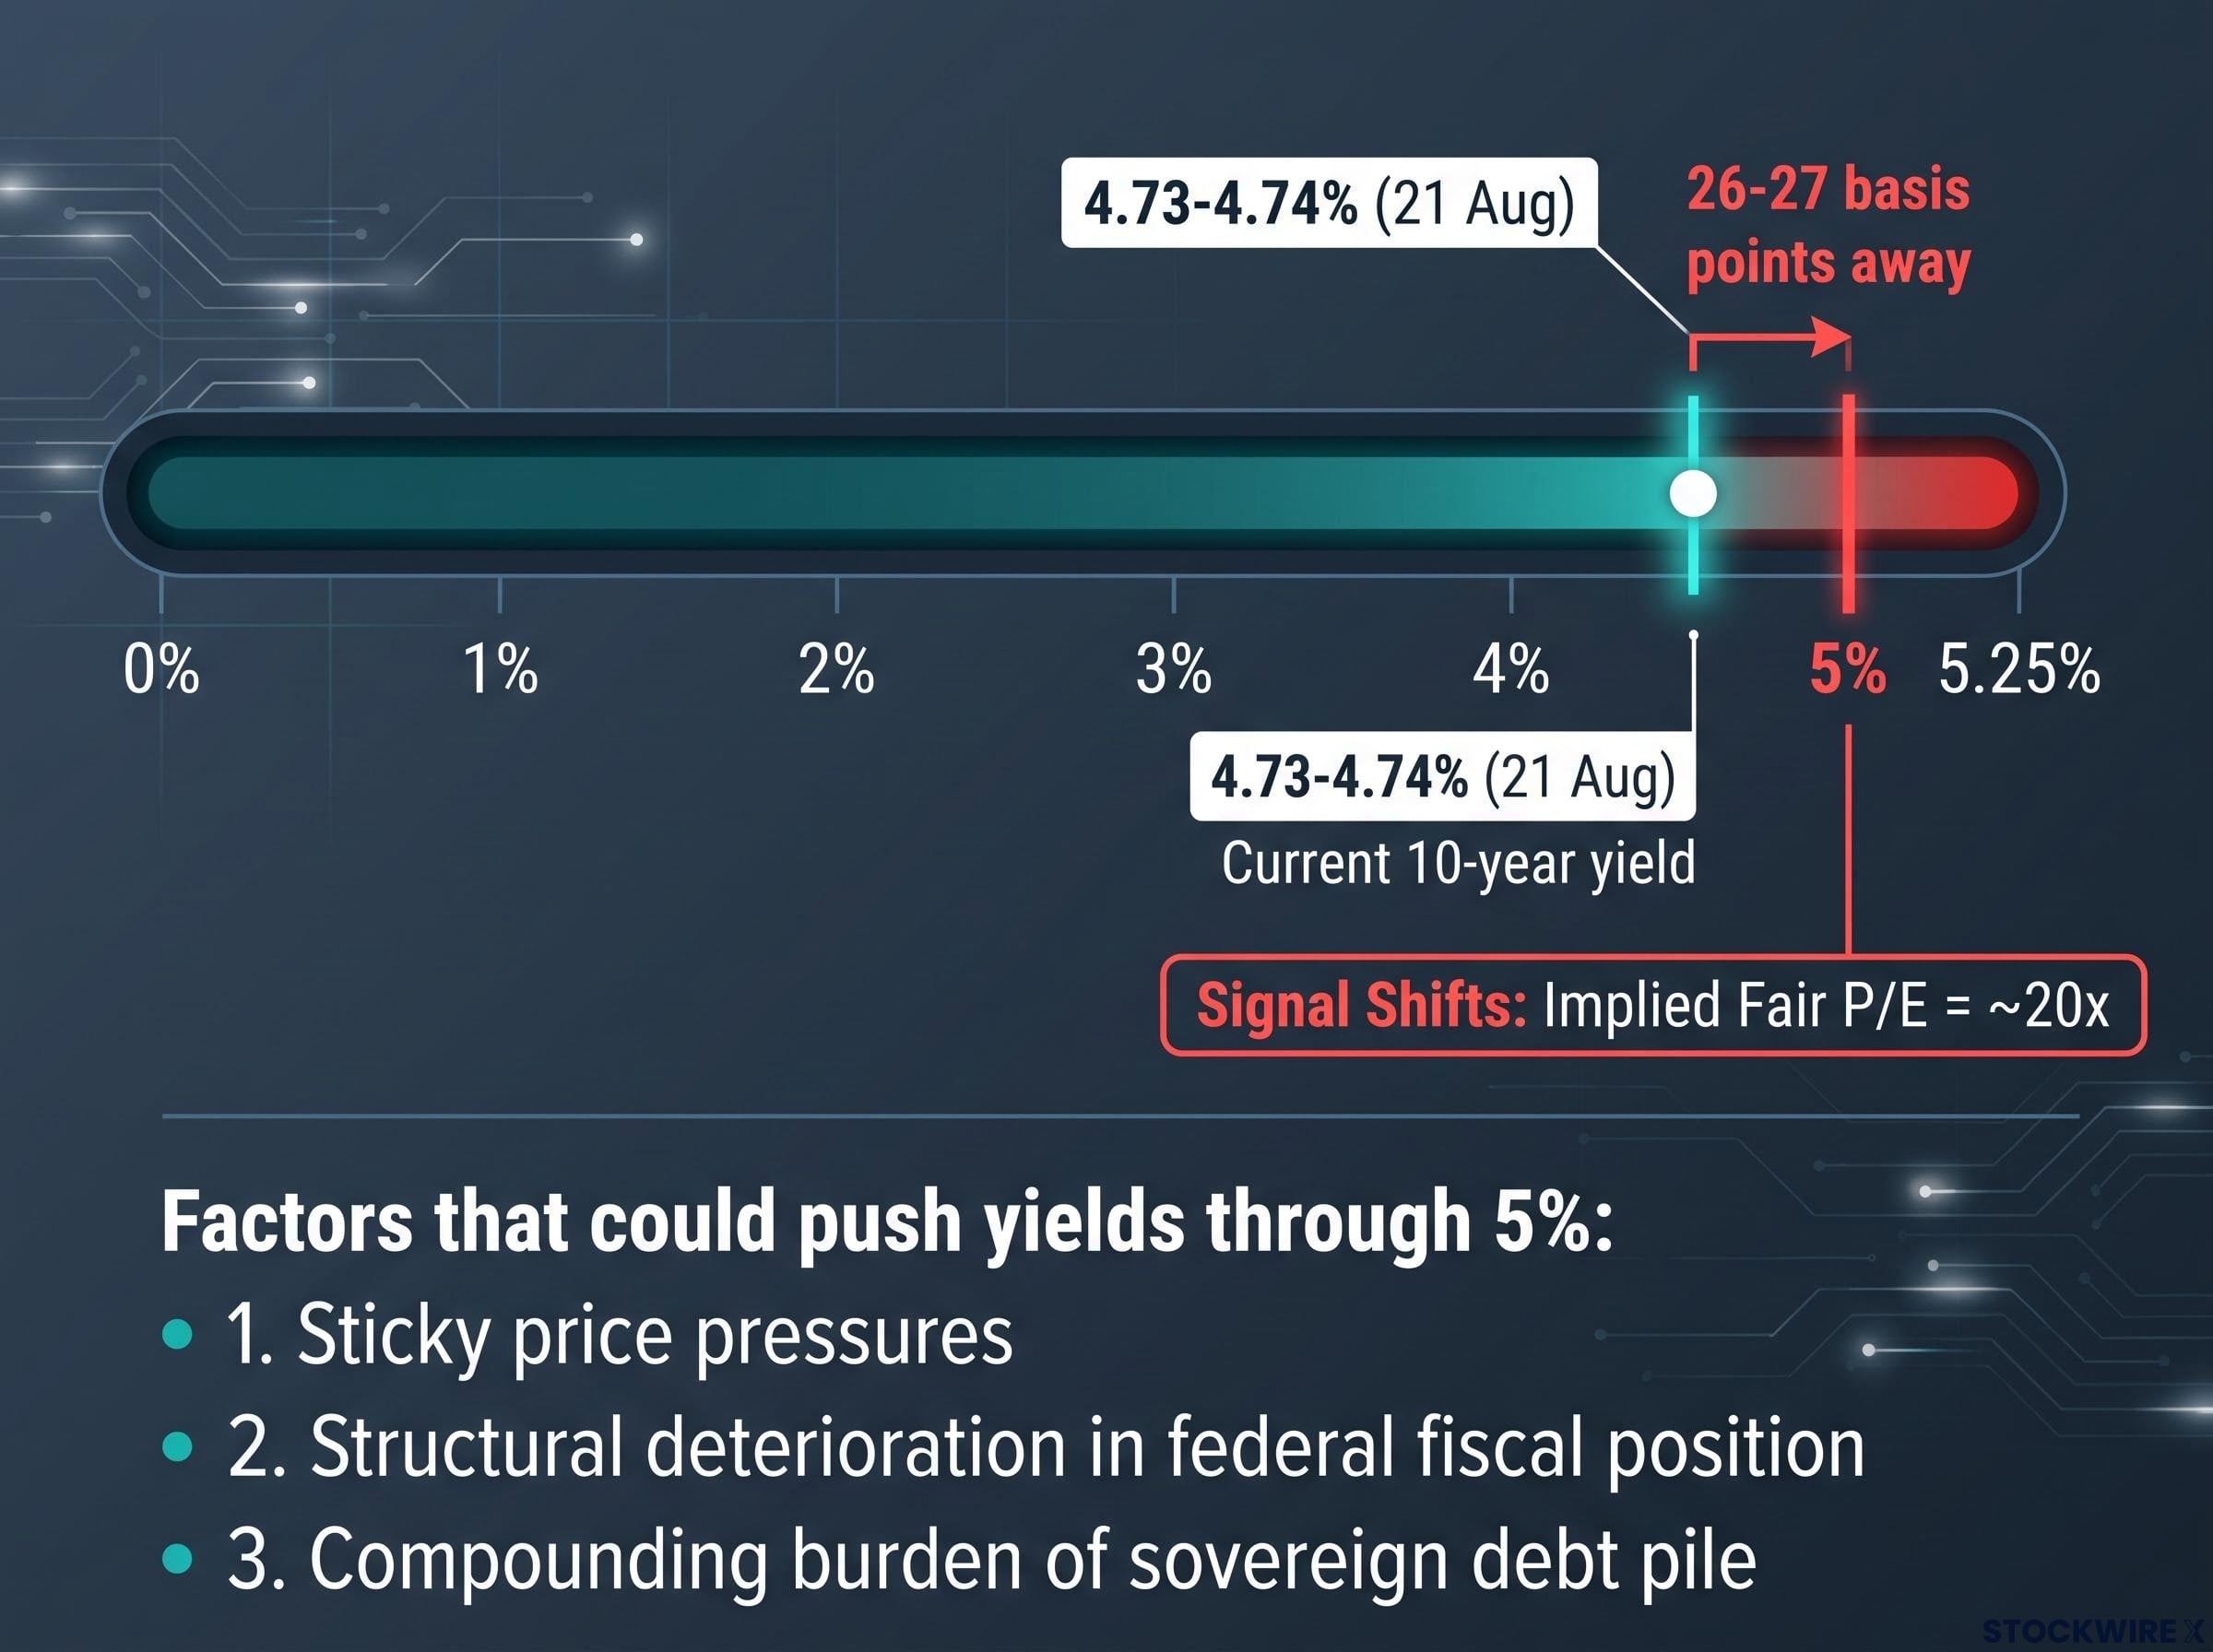
Yardeni Research identifies the 5% threshold on the 10-year Treasury yield as the inflection point where the Fed Model’s signal shifts from constructive to neutral or negative for equities.
A move above 5% would not just eliminate the current signal. It would compound the pressure through three stages:
- Fair P/E compression: a yield above 5% pushes the implied fair P/E below 20 times, meaning equities need to trade at lower valuations just to match the bond yield
- Forward earnings pressure: elevated borrowing costs could weigh on economic activity, reducing the forward earnings estimates that feed the model’s numerator
- Recession amplification: if borrowing costs climb high enough to lift recession odds materially, the resulting equity drawdown could run considerably further than the yield-driven valuation compression alone would suggest
Yardeni Research identifies three macro factors capable of pushing yields through 5%: price pressures that prove harder to tame than expected, a structural deterioration in the federal government’s fiscal position, and the compounding burden of a growing sovereign debt pile. These are the same variables that would undermine the constructive base case.
The 5% threshold is not a line on a chart. It is the specific yield level at which the Fed Model’s arithmetic shifts from saying equities are cheap relative to bonds to saying they are not. Knowing that lets you watch the right variable in real time rather than waiting for a strategist to interpret the move for you.
What the model cannot tell you
The Fed Model has a structural assumption baked into its arithmetic that you need to understand before treating its output as a verdict.
The model says equities are fairly valued when the earnings yield merely matches the Treasury yield. It does not require equities to offer any spread above the risk-free rate. In conventional finance, investors demand a premium for taking equity risk, compensation for the fact that stocks can fall 30% in a year while Treasury bonds will pay you back at par. The Fed Model ignores that premium entirely.
A century of global return data shows the long-run equity premium over bonds averaging 3-4 percentage points per year, which is exactly the kind of spread the Fed Model structurally ignores when it treats an earnings yield that merely matches the Treasury yield as sufficient justification for holding equities.
That means the fair-value estimate of approximately 8,300 is a ceiling consistent with zero required premium above Treasuries. If you require even a 1-2 percentage point spread above the bond yield to justify holding equities, you will reach a different, lower fair-value estimate from the same data.
The Fed Model’s structural blind spot connects directly to the equity risk premium, the spread investors historically demand above the risk-free rate to justify holding equities; Damodaran’s implied reading of 4.24% as of May 2026 places current valuations in a moderate-return zone rather than in either bubble or bargain territory.
Three additional limitations matter:
- Earnings revision sensitivity: the fair-value estimate is directly proportional to forward earnings. If forward earnings fall, fair value falls by the same proportion, regardless of what yields do.
- Nominal-only framework: the model compares nominal earnings yields to nominal Treasury yields without adjusting for inflation dynamics or real yield levels, a structural limitation in inflationary environments.
- Historical failure during ZIRP: the model’s track record includes a documented period where it failed to produce useful signals, and its current restoration rests on the premise that the ZIRP era is behind us, which is an assumption, not a certainty.
- Yardeni’s 80% base-case probability for a constructive macro scenario is one firm’s internal judgement, not a consensus market figure.
How earnings revisions move the target
The approximately 8,300 fair-value estimate assumes current forward earnings estimates hold. They may not.
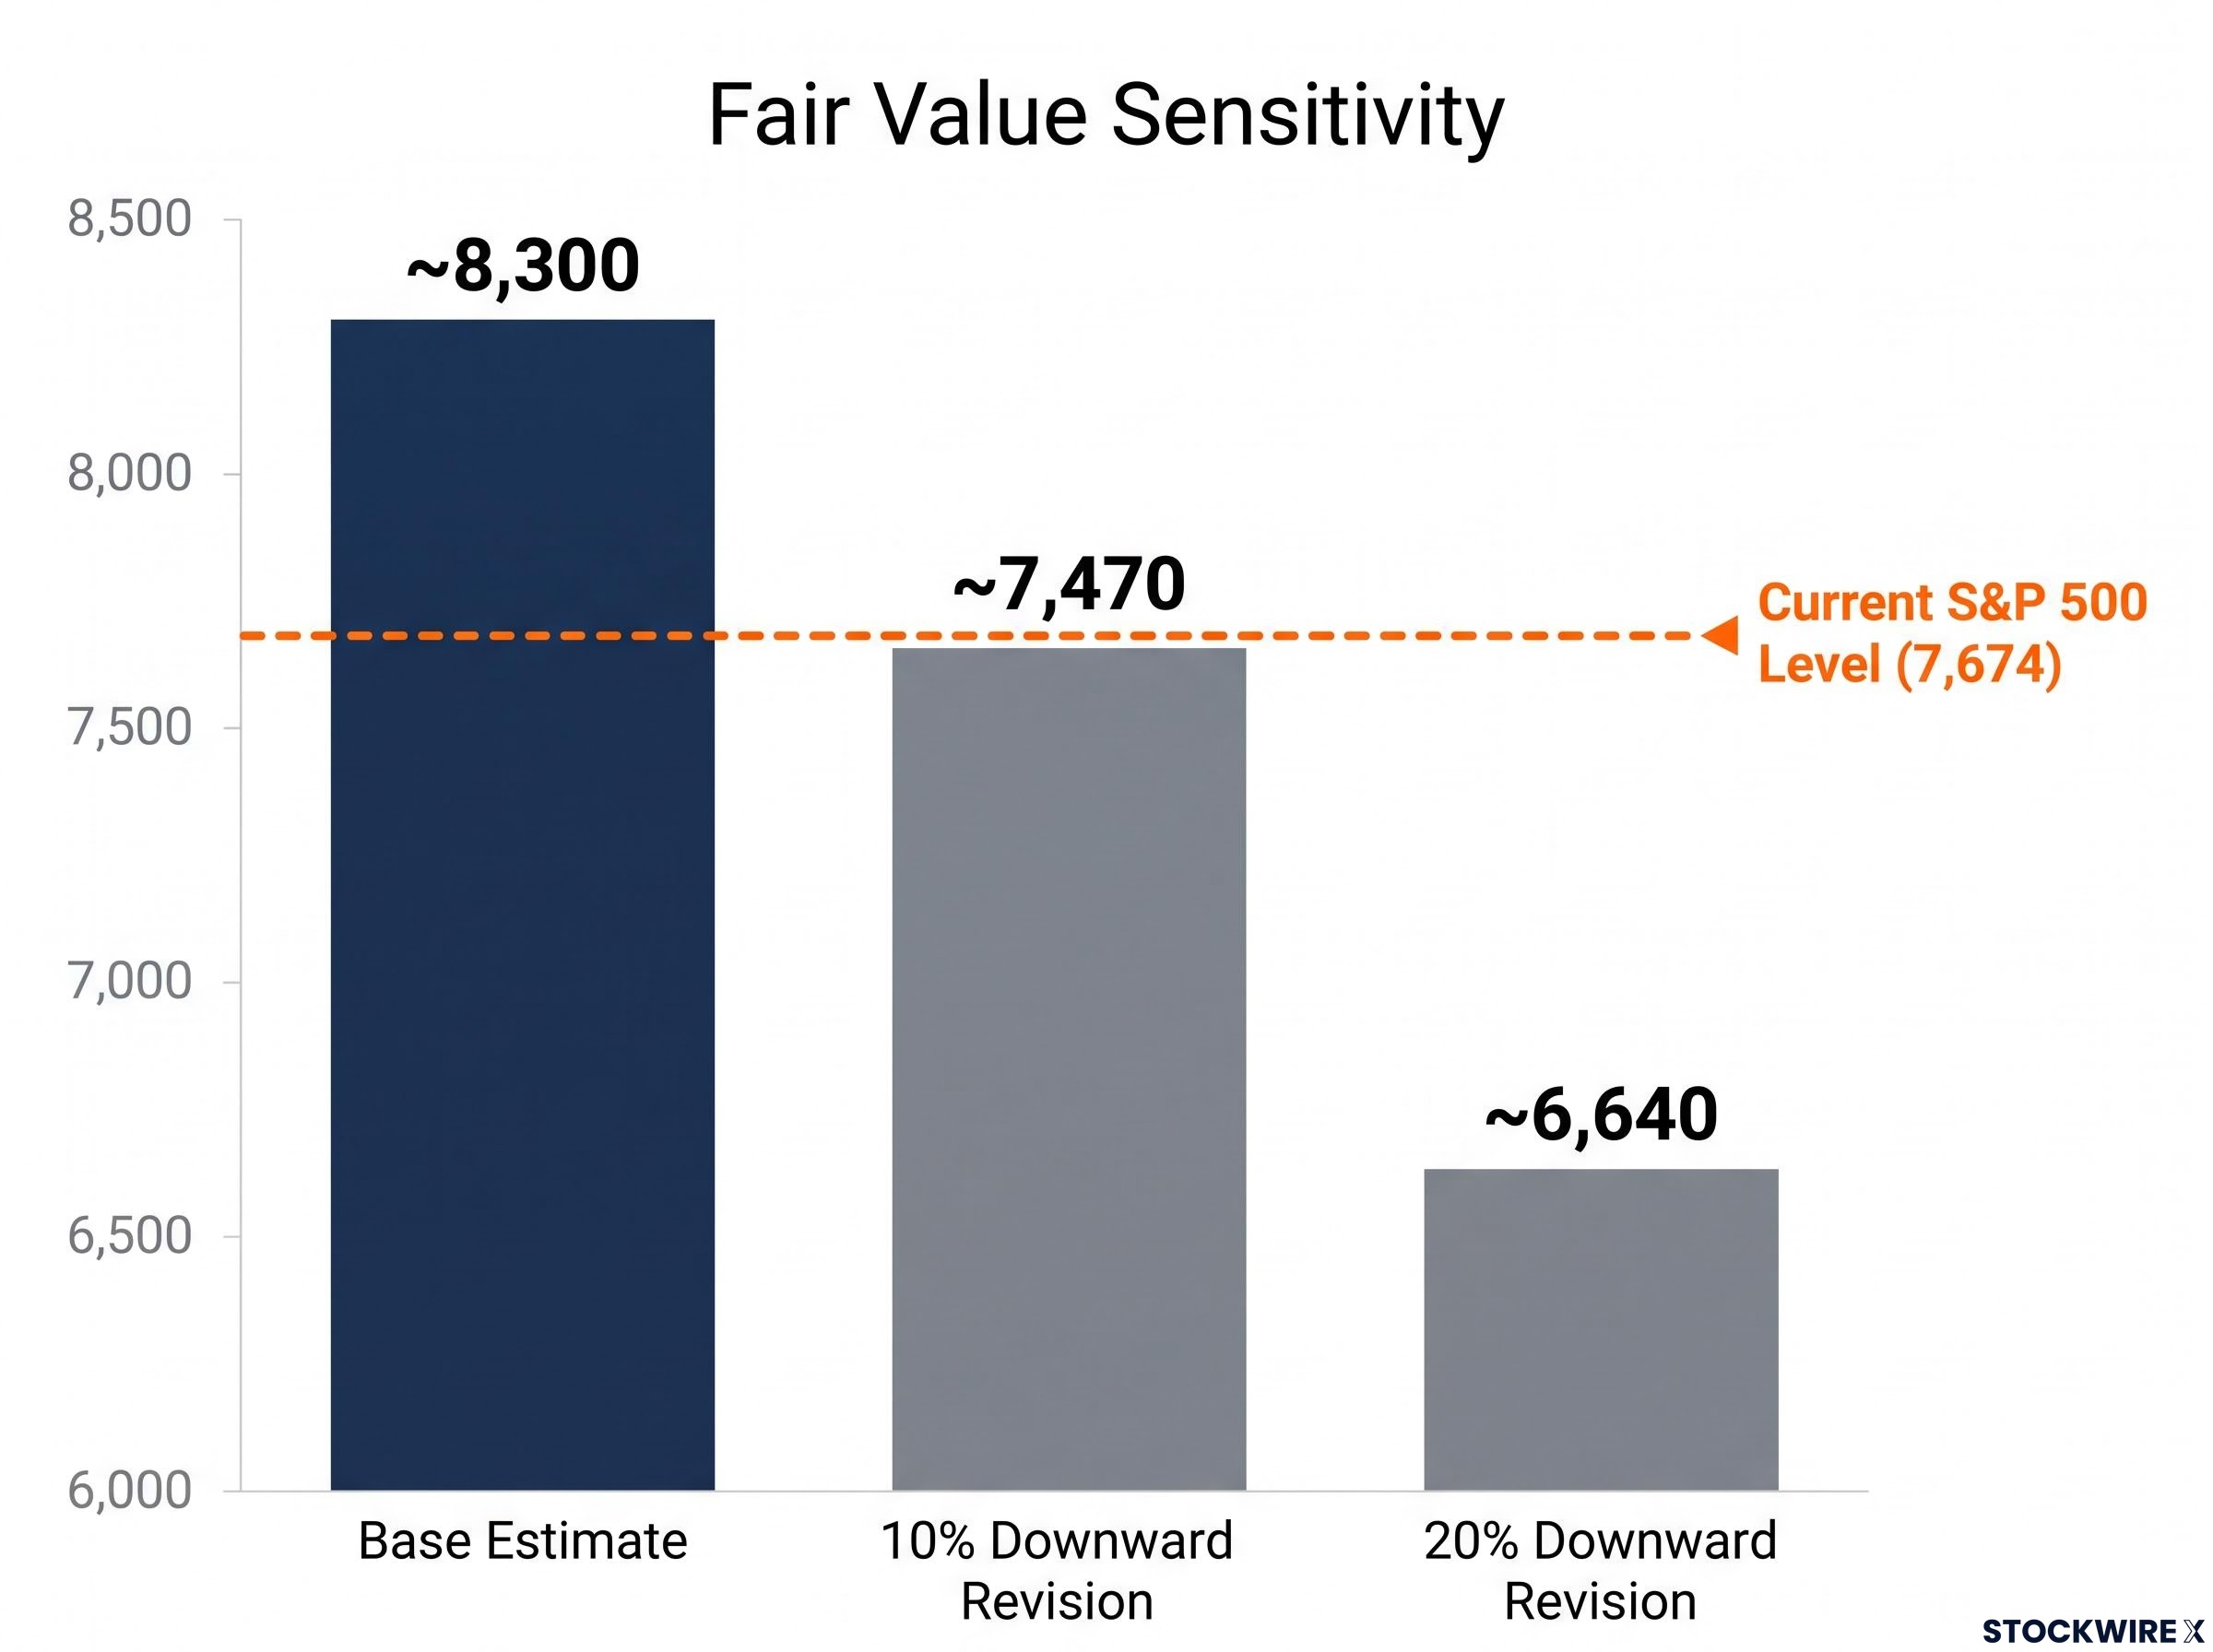
A 10% downward revision in forward earnings reduces the fair-value estimate proportionally, to approximately 7,470. A 20% revision takes it to approximately 6,640. That second number is below where the S&P 500 is trading right now.
This sensitivity cuts both ways, but the downside scenario matters more for risk management. The model’s output is only as good as the earnings estimates feeding it, and those estimates can move quickly during economic slowdowns.
What the Fed Model is telling you right now, and what to do with it
The current signal is straightforward. The S&P 500’s earnings yield of approximately 5.03% exceeds the 10-year Treasury yield of approximately 4.68-4.74%. On this measure, equities are modestly attractive relative to bonds. Yardeni Research’s implied fair value of approximately 8,300 represents roughly 8% potential upside from the 7,674 reference level, assuming the macro base case holds.
That base case, which Yardeni assigns an 80% probability (their internal judgement, not market consensus), depends on Treasury yields remaining within a 4-5% corridor. The macro forces capable of breaking through that ceiling are clear: inflation that proves stickier than anticipated, a federal deficit that continues to widen, and a government debt burden that compounds over time. Those same forces are what would send yields above 5% and shift the model’s signal from constructive to negative.
For readers wanting to understand the fiscal and structural forces behind the current yield environment, our deep-dive into the August 2026 Treasury repricing examines how rising term premium, persistent deficit concerns, and global sovereign repricing are combining to keep long-dated yields elevated.
The Fed Model cannot account for geopolitical disruptions, sudden earnings collapses, or shifts in investor risk appetite that fall outside its two inputs. It is one framework, not a complete investment thesis.
Here is what you can do with it:
- Track the 10-year yield against the 5% threshold. That is the specific level where the model’s constructive signal would shift to neutral or negative. You can monitor this daily.
- Update the earnings yield calculation when new forward P/E data is published. The arithmetic is one division. New consensus estimates from any major data provider give you a fresh input.
- Adjust for your own required equity risk premium. If you need a 1-2% spread above Treasuries to hold equities comfortably, subtract that from the model’s fair-value estimate. Your personal threshold is as important as the model’s.
The practical takeaway is not that the S&P 500 is definitively cheap. It is that you now have a specific, data-grounded framework for understanding when the relative-value argument for equities changes, and you know exactly which variable to watch.
This article is for informational purposes only and should not be considered financial advice. Investors should conduct their own research and consult with financial professionals before making investment decisions. Past performance does not guarantee future results. Financial projections are subject to market conditions and various risk factors.