
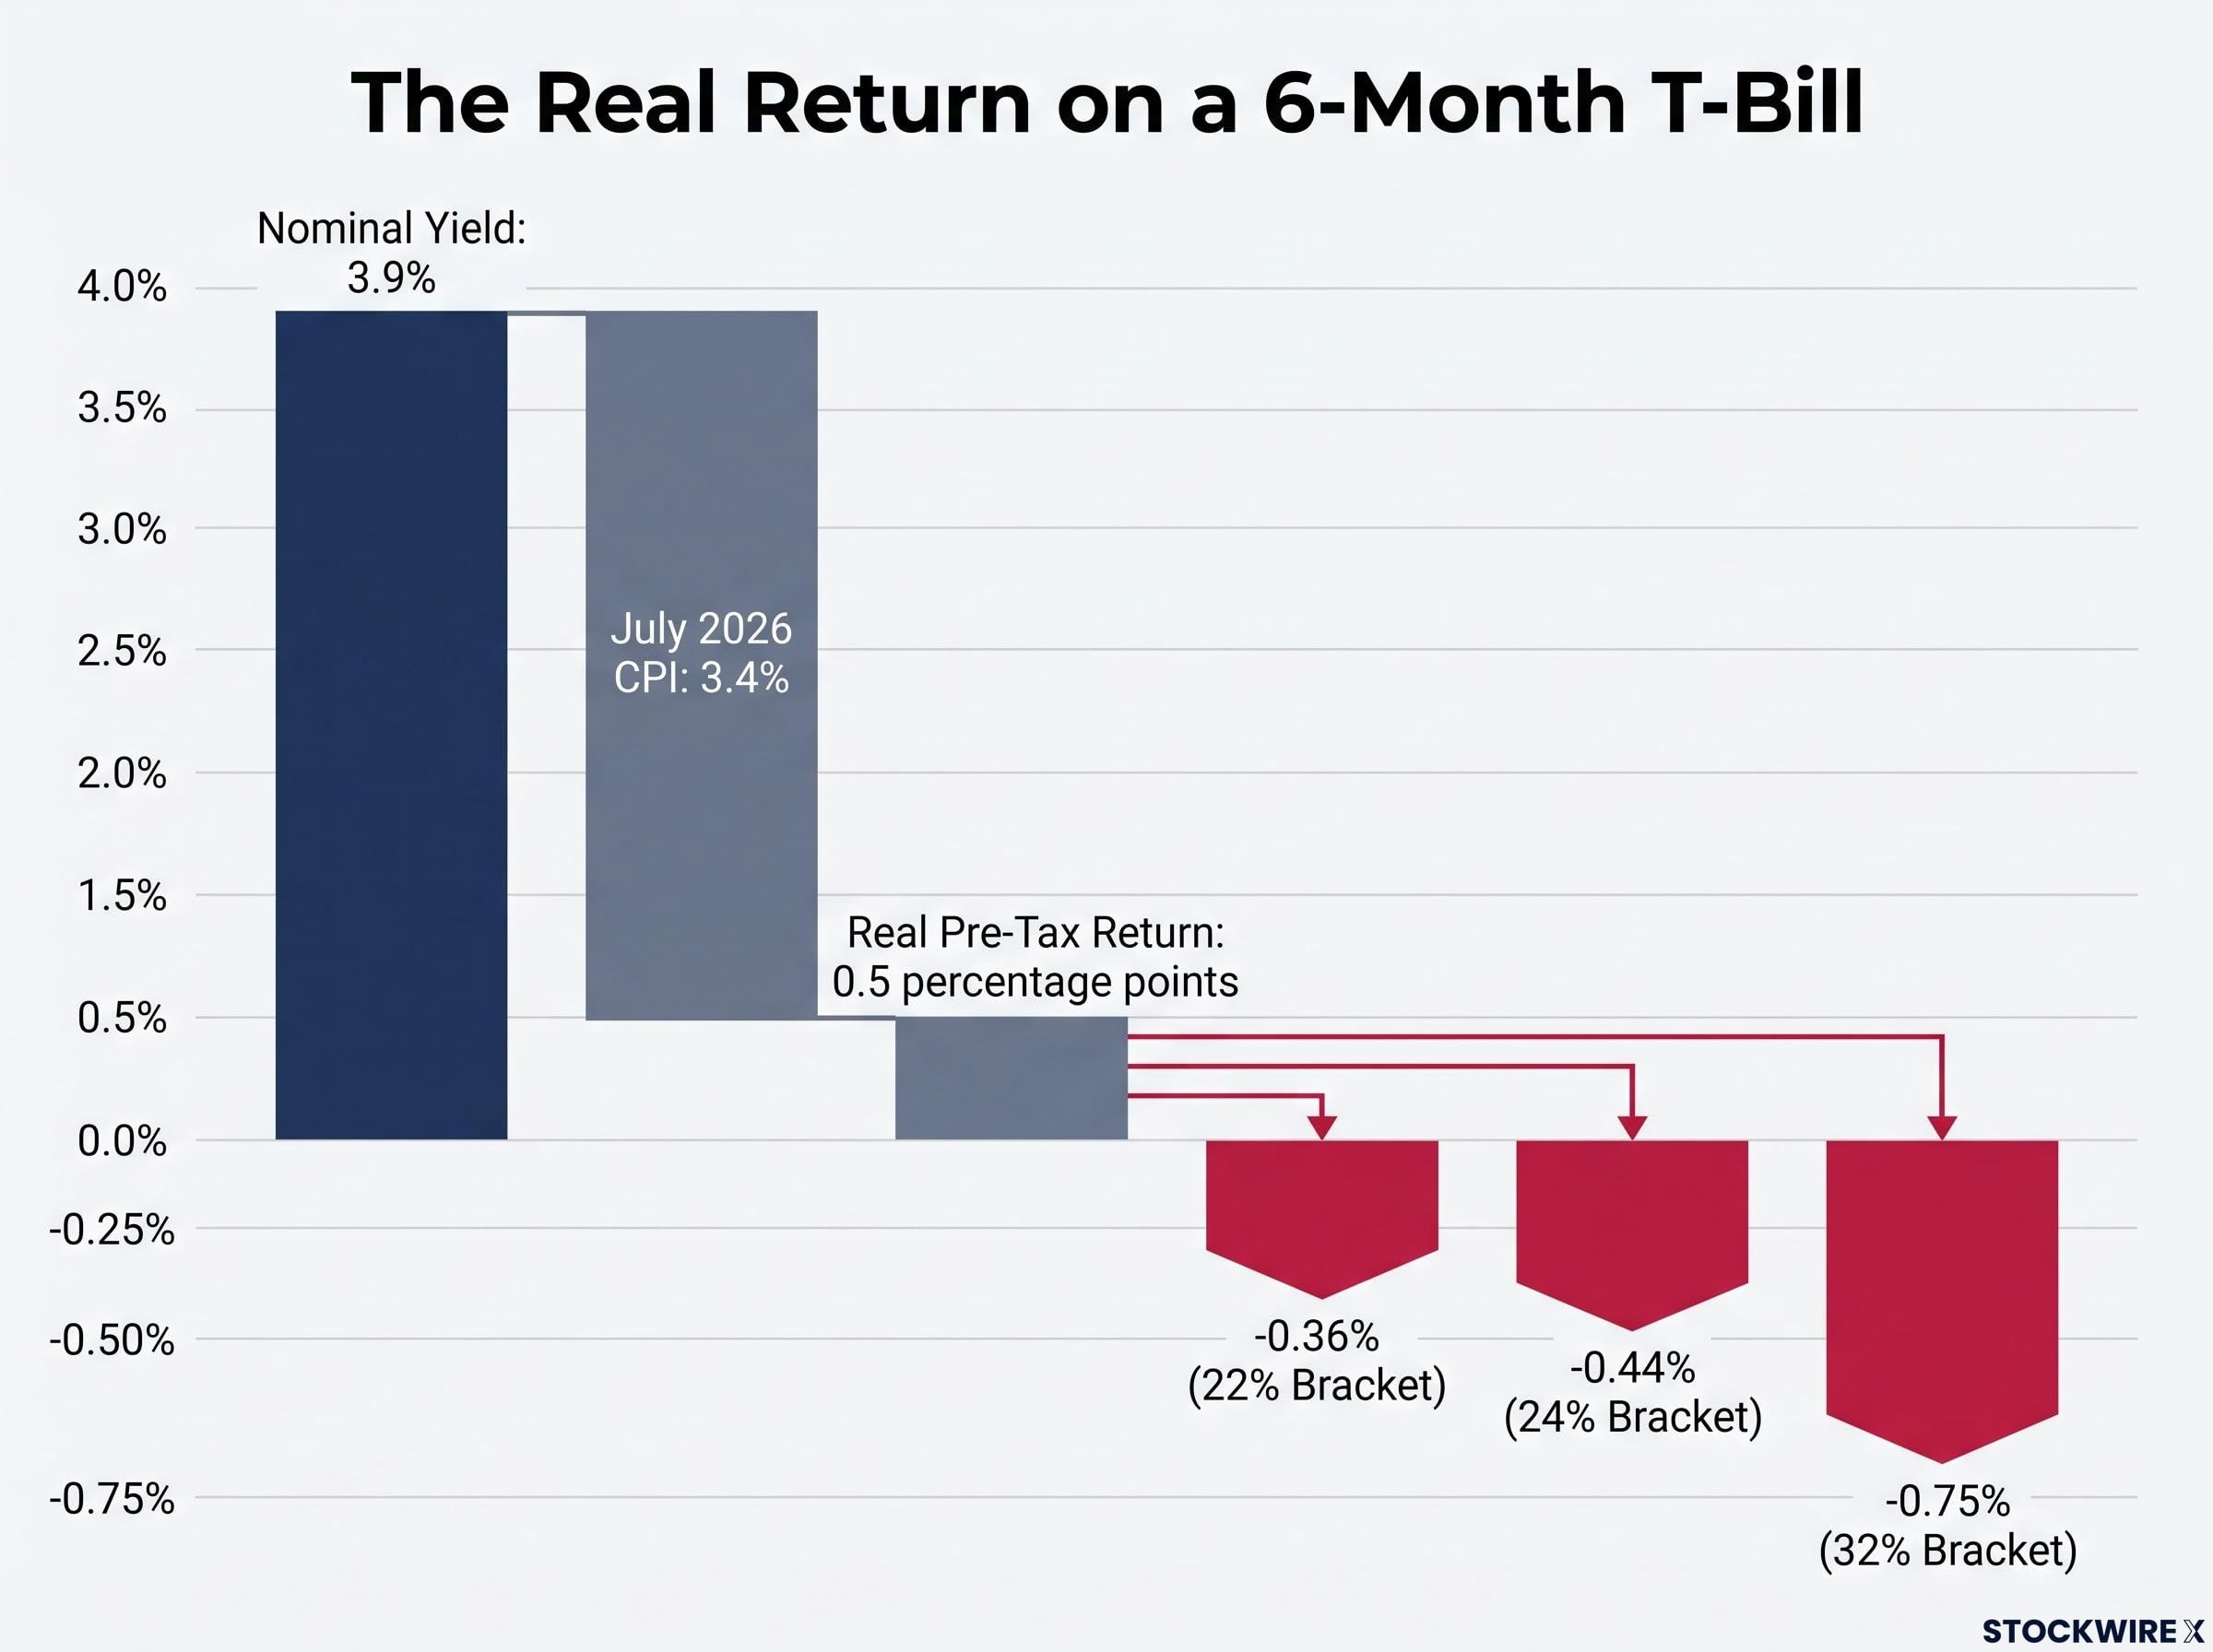
A 6-month Treasury bill yielding roughly 3.9% against July 2026 CPI of 3.4% leaves you with a real pre-tax return of approximately 0.5 percentage points. Federal income tax takes a bite out of even that. The instrument most investors default to as “safe yield” is, in practice, barely keeping pace with the cost of groceries.
Treasuries still do exactly what they were designed to do: deliver safety, liquidity, and a risk-free benchmark. But those design goals are not your goals. You want to preserve and grow purchasing power, and treating a T-bill as a wealth-building instrument in this environment is a category error. The yield you see on that bill is not even set purely by market forces; Treasury issuance policy itself shapes the number, a wrinkle most investors never examine.
Here is the analysis and the allocation model that lets you make an informed decision about which instruments belong in each part of your fixed income portfolio, and how to compare them on the terms that actually matter: after-tax yield, liquidity cost, and credit structure.
Why your T-bill return is smaller than the number suggests
Start with the headline: a 6-month Treasury yields approximately 3.9% as of mid-August 2026. July 2026 CPI came in at roughly 3.4% year-over-year. Subtract one from the other and you get a real pre-tax return of about 0.5 percentage points.
Real pre-tax return on a 6-month T-bill: approximately 0.5 percentage points. That is what you earn above inflation before the taxman arrives.
Now apply federal income tax. Treasury interest is exempt from state and local tax, which is a genuine advantage, but it is fully subject to federal tax. The table below shows what happens to your nominal 3.9% yield across three common federal brackets.
| Federal Tax Bracket | Nominal Yield | After-Federal-Tax Yield | Real After-Tax Return (vs 3.4% CPI) |
|---|---|---|---|
| 22% | 3.9% | 3.04% | -0.36% |
| 24% | 3.9% | 2.96% | -0.44% |
| 32% | 3.9% | 2.65% | -0.75% |
At every bracket shown, your real after-tax return is negative. You are paying for safety and liquidity, and that has legitimate value, but you are not being paid to hold Treasuries as a wealth-building instrument. Be honest with yourself about which goal you are actually pursuing.
The opportunity cost of idle cash compounds silently: Federal Reserve data shows middle-wealth households hold roughly 15% of total assets in cash, a share that translates into material purchasing-power erosion when real after-tax yields are negative across standard instruments.
TIPS, the inflation-protected alternative, carry their own limitation. When inflation anxiety is elevated, investor demand bids up TIPS prices and compresses real yields. The protection becomes most expensive at exactly the moment you want it most. Long-dated Treasuries, meanwhile, layer substantial interest-rate duration risk on top of the same compressed real yields.
When big ASX news breaks, our subscribers know first
How Treasury policy shapes the yields you see
Most investors assume T-bill yields are set by the market. That is only partly true. The yields you see are also shaped by deliberate government borrowing decisions.
According to analyst Chris Whalen, the U.S. Treasury has made short-term bill issuance a central pillar of its borrowing strategy, rolling through tranches of approximately $600-$800 billion at a time. By concentrating issuance at the short end of the curve, the government holds down its overall average borrowing cost relative to what longer-duration debt would require, but the consequence is that T-bill yields are partly a product of supply management decisions rather than a pure read of economic conditions.
Separate from issuance strategy, the Treasury General Account (TGA) introduces a second lever. The TGA is the government’s operating cash account sitting at the Federal Reserve, ringfenced from the broader financial system. As reported by Whalen, Scott Bessent’s publicly stated aim has been to build the TGA to around $800 billion, a sum large enough to move markets if deployed. When the Treasury channels those balances back into money markets via repurchase agreements, it eases short-term funding conditions and pushes yields lower without the Federal Reserve taking any action at all.
The two mechanisms work in parallel:
- Bill issuance strategy: Heavy short-term issuance floods the market with supply, restraining T-bill yields below where they might otherwise sit.
- TGA deployment: When TGA balances are pushed into money markets through repos, short-term funding conditions ease, compressing yields further.
Unlike conventional Federal Reserve quantitative easing, which involves the central bank purchasing bonds outright to expand bank reserves, Treasury’s toolkit operates through issuance volume and cash management on the short end of the curve. The outcome on yields can look similar even though the mechanism differs. The practical implication for investors is straightforward: the T-bill yield you receive is shaped in part by the government’s own cost-minimisation choices, which is one more reason to evaluate it against genuinely market-driven alternatives rather than accepting it as a neutral baseline.
The real yield hurdle rate that every fixed income instrument must now clear has shifted materially under Fed Chair Kevin Warsh, with 10-year TIPS real yields reaching 2.22%, a level that reframes the opportunity cost of holding sub-inflation instruments across the entire portfolio.
The alternatives, ranked by risk and what each one actually pays
The right question is not which instrument yields the most. It is which instrument is right for this specific portion of your capital, given your liquidity needs, tax situation, and risk tolerance. Each category below solves a different problem for a different dollar.
Treasury-only money market funds
Professional managers running Treasury-only money funds continuously roll into the best-available Treasury paper, typically generating a 0.10-0.30 percentage point premium over a direct T-bill purchase. You get the same credit profile (exclusively Treasury obligations), same-day liquidity, and a stable $1 net asset value (the price per share the fund maintains).
One important distinction: Treasury-only funds are not the same as broader “government” money funds, which may hold agency debt and repurchase agreements. If zero non-Treasury credit exposure is your goal, verify the fund’s mandate before you buy.
FDIC-insured bank deposits and CDs
Rates at well-rated banks have been running ahead of T-bill yields by a meaningful margin in the current environment, with high-yield savings and money market accounts commonly offering a spread of 0.5-1.0 percentage points or more above comparable Treasury paper. Certificates of deposit (CDs), where you lock your money for a fixed term in exchange for a set interest rate, extend duration and often add further yield.
FDIC-insured savings account alternatives, including high-yield savings accounts and Series I bonds, currently offer yields that materially exceed the standard big-bank rate, with the right combination depending on your tax situation, hold period, and liquidity requirements.
The trade-off is tax treatment. Unlike Treasury interest, deposit interest is subject to state and local income taxes, which erodes the apparent yield advantage for residents of high-tax states like California, New York, and Oregon. The Federal Deposit Insurance Corporation (FDIC) generally covers up to $250,000 per depositor per bank per ownership category; larger balances need to be spread across institutions or CD brokerage networks.
Fixed annuities
Fixed annuities (contracts with insurance companies that provide guaranteed periodic payments) can turn a portion of your portfolio into contractual, lifetime income. Headline payout figures for older buyers are frequently quoted in the low double digits, with rates in the region of 13-14% commonly appearing in marketing materials.
Important clarification: That headline payout rate combines interest and return of your own principal over the payout period. It is not a pure interest yield. Confusing the two is the most common source of reader error when evaluating annuities against bonds or bank deposits.
The backstop is state guaranty associations, not federal government insurance, with coverage typically ranging from $100,000 to $300,000 per policyholder per insurer depending on the state. Insurer credit quality matters significantly. Fixed annuities fit best if you already have a liquid safety buffer and want to guarantee a floor of retirement income, and you are comfortable trading liquidity and flexibility for predictable cash flow.
Mortgage REIT equities
Mortgage REITs (companies that use leverage to invest in mortgage-backed securities or originate loans) commonly deliver yields in the high-single-digit to low-double-digit range. The income is real, but it comes with real volatility.
Dividends can be cut during stress. Share prices swing with interest rates and credit spreads. Income is typically taxed as ordinary income. This is a yield-enhancement sleeve for a modest portion of your portfolio, not a cash equivalent. If you understand the risks and can tolerate the volatility, a small, deliberately sized allocation can complement safer holdings. It should never replace them.
| Instrument | Typical Yield vs. T-Bill | Liquidity | Credit Protection | Key Caveat |
|---|---|---|---|---|
| Treasury-only money fund | +0.10-0.30 pp | Same-day | Full Treasury backing | Verify fund mandate excludes agency debt |
| FDIC bank deposits / CDs | +0.5-1.0 pp or more | High (savings); lower (CDs) | FDIC up to $250,000 | Subject to state/local tax |
| Fixed annuities | Headline payout 13-14%* | Low (surrender charges) | State guaranty: $100K-$300K | *Includes return of principal |
| Mortgage REIT equities | High-single to low-double digits | High (listed equity) | None (equity risk) | Dividends variable; taxed as ordinary income |
When T-bills are still the right answer
None of what you have read so far argues for abandoning Treasuries entirely. This is a guide about matching instruments to goals, and there are three specific goals for which T-bills remain the correct answer.
- True cash reserves requiring zero principal risk. Capital that must remain immediately accessible without any risk of loss in value belongs in T-bills or Treasury-only money funds. Analyst Chris Whalen pointed to funds held on behalf of a charitable organisation as a textbook example of where T-bills are the appropriate vehicle, given the twin requirements of absolute safety and on-demand availability.
- High-income-tax-state investors. If you live in California, New York, Oregon, or a similar high-tax state, the state-tax exemption on Treasury interest can close or even reverse the yield gap against taxable bank products. Your after-tax comparison may look materially different from the nominal figures.
- Short-duration positioning for potential rate increases. If you expect rates to rise or stay volatile, the reinvestment flexibility of short-term Treasuries lets you roll into higher yields as they become available, trading current income for optionality.
Choosing Treasuries for these purposes is not a default or a failure of imagination. It is correct tool selection for the job at hand, which is precisely why the same logic argues against using them as a general wealth-building instrument.
A four-tier framework for building your fixed income stack
The practical move is segmenting your capital by function, not lumping it into a single instrument because that instrument feels safe. Here is the architecture:
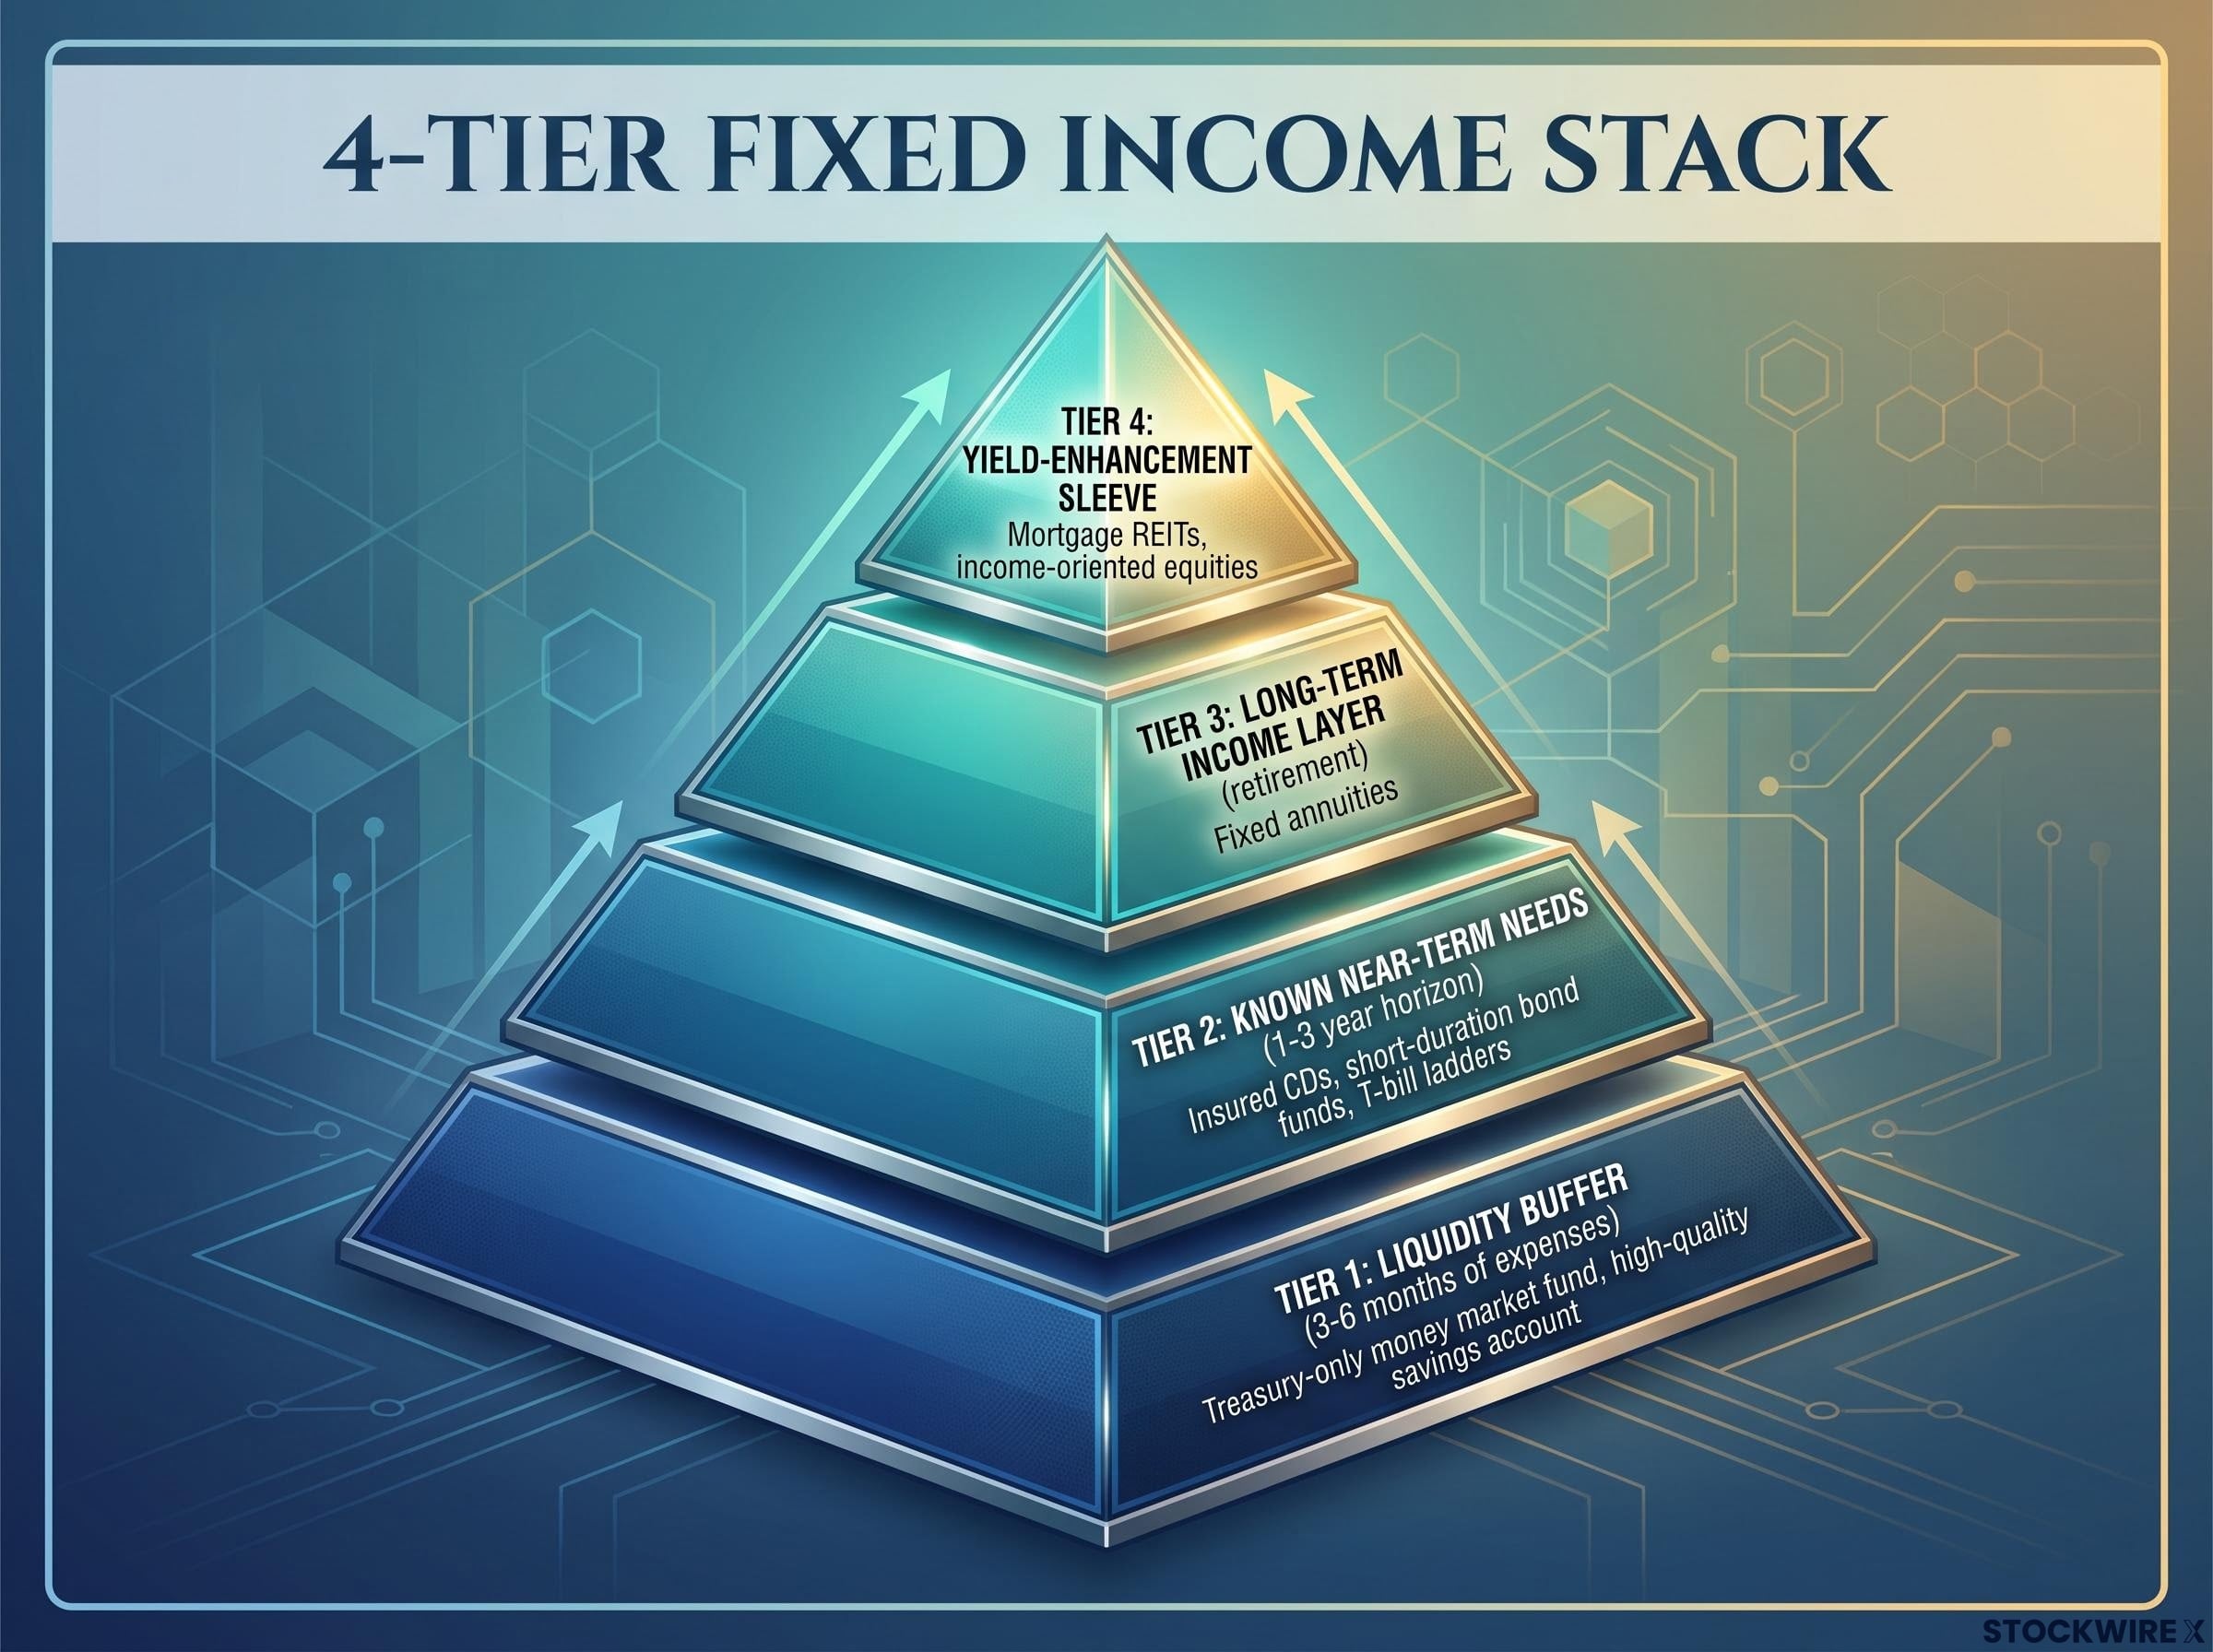
- Tier 1: Liquidity buffer (3-6 months of expenses). Treasury-only money market fund or high-quality savings account. The goal is capital preservation and instant access, not yield maximisation.
- Tier 2: Known near-term needs (1-3 year horizon). Insured CDs, short-duration bond funds, or T-bill ladders where state-tax advantages are material. The goal is modestly higher yield with controlled interest-rate and liquidity risk.
- Tier 3: Long-term income layer (retirement). Selective use of fixed annuities from strong insurers, evaluated carefully against bond ladders and other guaranteed income sources. The goal is a guaranteed floor of income.
- Tier 4: Yield-enhancement sleeve. Mortgage REITs or similar income-oriented equities, deliberately sized to your risk tolerance. The goal is incremental income, not core safety.
Every dollar of your fixed income capital has a job. The right instrument is determined by that job, not by a yield table in isolation.
Five questions to ask before moving capital
Before you shift a single dollar from one tier to another, answer these for each instrument you are comparing:
- After-tax yield: What do you actually keep after federal and state taxes?
- Liquidity cost: How costly is it, financially and practically, to access the funds early?
- Credit and structural risk: Who ultimately owes you money, and how are they regulated or guaranteed?
- Duration: How sensitive is the instrument’s price to interest-rate changes?
- Comparison integrity: Are you comparing a true interest yield against a payout that includes return of principal (as annuity headline rates do)?
If you cannot answer all five clearly for every instrument in the comparison, you are not ready to make the move.
Matching your capital to the right instrument in a rate-plateau environment
Treasuries are not broken. But defaulting to T-bills as a wealth-building strategy in an environment where real pre-tax returns sit at approximately 0.5 percentage points is a category error that costs you purchasing power over time, and that cost compounds.
The practical move is deliberate segmentation. Keep Treasuries for their genuine strengths: safety, liquidity, and state-tax advantage where it applies. Route capital toward better-yielding instruments, specifically insured bank products offering 0.5-1.0 percentage points of additional yield and carefully vetted annuities, for the portions of your portfolio where those strengths are not the primary need. Neither shift requires a fundamental change in risk posture for most investors.
In a rate-plateau environment where yields may stay range-bound rather than rising sharply, the opportunity cost of sitting entirely in T-bills is not temporary. It accumulates month after month, quarter after quarter. The four-tier framework and five evaluation questions in this guide are designed for exactly this kind of sustained, moderate-inflation, constrained-real-yield context.
Fixed income positioning in a rate-hold environment requires treating inflation as a risk to compensate for rather than a direction to predict, a discipline that becomes especially important when nominal yields are positive but real after-tax returns are not.
The core principle: real fixed income discipline means matching each dollar to its job, not defaulting to one instrument because it feels safe.
This article is for informational purposes only and should not be considered financial advice. Investors should conduct their own research and consult with financial professionals before making investment decisions. Past performance does not guarantee future results. Financial projections are subject to market conditions and various risk factors.